» EPRA SUSTAINABILITY BEST PRACTICE RECOMMENDATIONS · 2018-08-22 · EPRA Best Practice...
14
Page 1 of 14 » EPRA SUSTAINABILITY BEST PRACTICE RECOMMENDATIONS 30 June 2018 CONTENTS 1. Introduction ................................................................................................................................ 2 2. Overarching recommendations .................................................................................................. 2 3. Sustainability performance measures (EPRA tables) ................................................................. 6
Transcript of » EPRA SUSTAINABILITY BEST PRACTICE RECOMMENDATIONS · 2018-08-22 · EPRA Best Practice...
Page 1 of 14
» EPRA SUSTAINABILITY BEST PRACTICE
RECOMMENDATIONS
30 June 2018
CONTENTS
1. Introduction ................................................................................................................................ 2
2. Overarching recommendations .................................................................................................. 2
3. Sustainability performance measures (EPRA tables) ................................................................. 6

Page 2 of 14
INTRODUCTION
We report on our energy, GHG emissions, water and waste impacts as well as on social and governance indicators in accordance with the 3rd edition of the
EPRA Sustainability Best Practice Recommendations (EPRA sBPR). Our reporting response has been split into 2 sections:
1. Overarching recommendations
2. Sustainability Best Practice Performance Measures

Page 3 of 14
OVERARCHING RECOMMENDATIONS
1.1 Organisational boundaries We use an operational control approach for our data boundary. Unless indicated otherwise, the key figures relate to the financial year in question and the
entire Group (i.e. all the fully consolidated companies and equity-accounted companies based on the shareholdings as per the consolidated
annual financial statements). The recognition of the energy production of G+D Gesellschaft für Energiemanagement GmbH, Magdeburg, a joint venture in
which Deutsche Wohnen holds a 49% stake, constitutes an exception. The energy that G+D supplies to the Deutsche Wohnen portfolio,
which is provided with heating centrally, is recorded in the energy footprint consumption figures and is taken into account in all the key figures derived.
The energy which is sold and fed into the grid (combined heat and power [CHP] plants and the energy produced by Stadtwerke Thale GmbH, which was
acquired by G+D in the year under review) is not included in Deutsche Wohnen’s energy and environmental footprint.
1.2 Coverage Please see our EPRA performance tables for individual coverage of each performance measure.
1.3 Estimation of landlord-obtained utility consumption None of our data is estimated.
1.4 Third Party Assurance We do not have third party assurance.
1.5 Boundaries – reporting on landlord and tenant consumption We only report on landlord-obtained utilities consumption (although the bills we receive include consumption in tenant areas). Nearly 100% of the total
consumption within the common and tenant areas for natural gas (fuel), district heating and cooling and water is recharged to the tenant because the
vast majority is consumed by the tenants in common and tenant areas. We recharge the tenants based on the floor area and the individual tenant
consumption within the residential units. Tenant-obtained data (i.e. from bills which the tenant receives directly) is excluded.
1.6 Analysis - Normalisation Intensity indicators are calculated using floor area (m2) for whole buildings. We are aware of the mismatch between nominator and denominator, as our
consumption for electricity relates to common areas only, whereas we receive district heating and cooling, natural gas (fuel) and water bills for the entire
building and cannot separate common area from tenant area consumption. For our own offices we report intensity performance measures using floor
area (m2) as a denominator, too.
Page 4 of 14
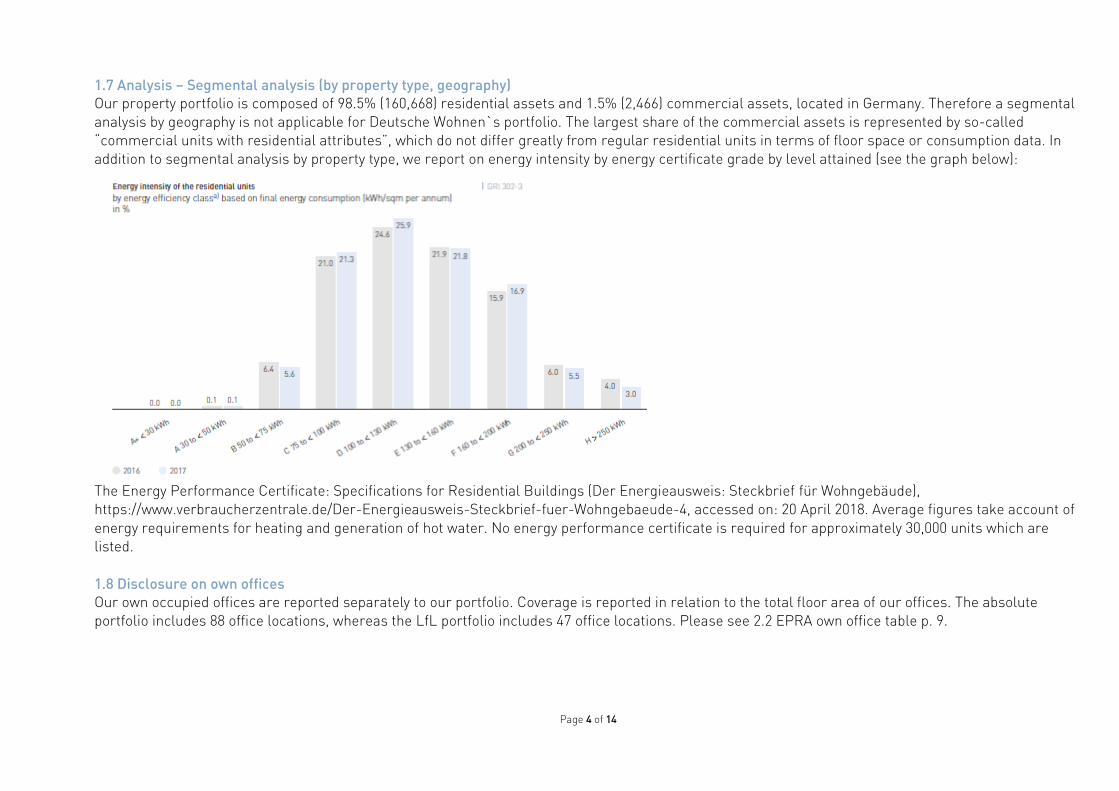
1.7 Analysis – Segmental analysis (by property type, geography) Our property portfolio is composed of 98.5% (160,668) residential assets and 1.5% (2,466) commercial assets, located in Germany. Therefore a segmental
analysis by geography is not applicable for Deutsche Wohnen`s portfolio. The largest share of the commercial assets is represented by so-called
“commercial units with residential attributes”, which do not differ greatly from regular residential units in terms of floor space or consumption data. In
addition to segmental analysis by property type, we report on energy intensity by energy certificate grade by level attained (see the graph below):
The Energy Performance Certificate: Specifications for Residential Buildings (Der Energieausweis: Steckbrief für Wohngebäude),
https://www.verbraucherzentrale.de/Der-Energieausweis-Steckbrief-fuer-Wohngebaeude-4, accessed on: 20 April 2018. Average figures take account of
energy requirements for heating and generation of hot water. No energy performance certificate is required for approximately 30,000 units which are
listed.
1.8 Disclosure on own offices Our own occupied offices are reported separately to our portfolio. Coverage is reported in relation to the total floor area of our offices. The absolute
portfolio includes 88 office locations, whereas the LfL portfolio includes 47 office locations. Please see 2.2 EPRA own office table p. 9.
Page 5 of 14
1.9 Narrative on performance Please refer to p. 8 for our portfolio, pp. 10 for our own occupied offices and p. 13 for social and governance indicators for more detail on consumption
and/or performance trends.
1.10 Location of EPRA Best Practice Performance Measures in companies’ reports EPRA Best Practice Performance Measures for our portfolio, own offices, social and governance indicators can be found in section 2.1 EPRA portfolio
table (p. 6 et seq.), section 2.2 EPRA own office table (p. 9 et seq.) and 2.3 EPRA social and governance table (p. 12 et seq.) of this report.

Page 6 of 14
SUSTAINABILITY BEST PRACTICE PERFORMANCE MEASURES (EPRA TABLES)
2.1 EPRA environmental performance measures (portfolio)
Absolute Like-for-like (LfL)
Indicator EPRA Unit of measure 2016 2017 2016 2017 % change
Electricity consumption for landlord controlled areas
Elec-Abs, Elec-LfL
kWh 33,313,000 32,948,000 32,341,389 31,874,241 -1.4
Proportion of electricity consumption from renewable sources % 90 90 87 87 0
Coverage of total units % 91 89 85 84 -1 pp
Energy consumption from landlord obtained district heating and cooling
DH&C-Abs, DH&C-LfL
kWh 589,419,000 618,952,000 355,285,906
358,522,622
0.9
Proportion of district heating & cooling from renewable sources % No district heating & cooling from renewable sources
Coverage of total units % 86 85 62 62 0
Energy consumption from landlord obtained fuels
Fuels-Abs, Fuels-LfL
kWh 566,986,000 581,525,000 365,812,904 368,006,152 0.6
Proportion of fuels from renewable sources % Share of energy from renewable sources (pellets) around 1.4 %.
Coverage of total units % 86 85 62 62 0
Building energy intensity Energy-Int kWh/m2 139 144 123 123 0
Direct Scope 1 GHG emissions (total) GHG-Dir-Abs
t CO2 137,426 140,990 88,237 88,903 0.75
Coverage of total units % 86 85 62 62 0
Total Scope 2 indirect GHG emissions (location based)
GHG-Indir-Abs
t CO2 191,435 199,954 124,991 125,391 0.3
Total Scope 2 indirect GHG emissions (market based) t CO2 175,634 184,327 107,025 107,948 0.9
Coverage of total units % 86 = DH&C-Abs
91 = Elec-Abs 85 = DH&C-Abs
89 = Elec-Abs 62 = DH&C-LfL
85 = Elec-LfL 62 = DH&C-LfL
84 = Elec-LfL 0 = DH&C-LfL
1 pp= Elec-LfL
Building GHG emissions intensity GHG-Int t CO2/m2 0.036 0.038 0.023 0.024 0.8
Total water consumption Water-Abs, Water-LfL
m3 8,453,625 7,929,615 8,235,899 7,589,974 -7.8
Coverage of total units % 67 65 63 62 -1 pp
Building water consumption intensity Water-Int m3/m
2 1.33 1.24 1.35 1.25 -7.8

Page 7 of 14
Weight of waste by disposal route (total) Waste-Abs, Waste-LfL
tonnes not applicable
% recycled not applicable
% sent to landfill
not applicable
Coverage % not applicable
Type and number of assets certified Cert-Tot
% of portfolio certified OR number of certified assets
See therefore 1.7 100 See therefore
1.7 100 0
Notes: › Coverage for each indicator and year has been defined as the proportion of the total portfolio consisting of:
2016: 160,160 residential and commercial units;
2017: 163,134 residential and commercial units
› Heating energy is provided by either district heating or fuel (natural gas, domestic fuel oil or pellets). In total, heating energy consumption coverage in
absolute terms amounts to 85 % of our total portfolio and in LfL terms to 62% of our total portfolio in 2017. The share of units which use DHC and
fuels breaks down as follows (2016/2017): DH&C-Abs (46/45%), DH&C-LfL (33/33%), Fuels-Abs (40/40%) and Fuels-LfL (29/29%).
› The heating energy consumption figures (DH&C-Abs, DH&C-LfL, Fuels-Abs, Fuels-LfL) were adjusted to reflect weather conditions using the climate
factors of Germany’s National Meteorological Service (DWD).
› The LfL share of renewable sources has been calculated as a proportion of the absolute and LfL consumption data.
› Waste indicators (Waste-Abs, Waste-LFL) are not applicable as Deutsche Wohnen is not responsible for waste across its portfolio.
› GHG emissions represent direct (Scope 1) and indirect (Scope 2) energy climate emissions based on the portfolio’s energy consumption. The Scope 1
value and the location-based Scope 2 value were calculated using the emission factors of the Institute for Living and the Environment (Institut Wohnen
und Umwelt – IWU) and the emission factor for the German electricity mix of the German Environment Agency (UBA) (527 g CO2e/kWh). The market-
based Scope 2 value is also presented in order to illustrate the positive effects on the climate from sourcing certified green electricity. The share of
emissions based on green electricity factor (0 g CO2e/kWh) is displayed in the table under Elec-Abs, Elec-LfL.
› GHG-Int: As electricity consumption accounts for only approximately 1% of heating energy consumption, and around 90% of the total electricity
consumed is sourced as green electricity (0 g CO2e/kWh), the CO2 intensity figure only includes the climate emissions related to heating energy
consumption.
› Water data (Water-Abs, Water-LfL) relates to our Berlin portfolio and is taken from our main water meters. These record both the individual tenants’
consumption levels, which account for the majority of total consumption, and general water consumption in the communal areas as well as for
sprinkler systems. There are no sub-meters for the individual spaces in part of our portfolio. It is therefore not currently possible to provide separate
data for water consumption in the communal areas, which account for only a very small proportion – around 1% – of the total area.

Page 8 of 14
› Cert-Tot: The weighted average of the final energy consumption on the basis of the current energy performance certificate of properties.
Discrepancies in the final energy requirements of approximately 20 kWh may arise due to the non-specification of the type of heating in question. The
allocation according to current category of energy efficiency of properties is therefore based solely on the classification in accordance with the
German Energy Saving Ordinance [EnEV]. Taking account of approximately 30,000 listed units for which no energy performance certificate is required,
the data comprises approximately 100% of our total portfolio. See therefore 1.7 for the percentage of energy performance by level attained.
Narrative on performance: › Elec-LfL: The slight reduction in 2016 is due to renovation of buildings and technical energy efficiency measures implemented across our portfolio.
› Energy-Int: Consistent figure due to an increasing district heating and electricity consumption value.
› Fuels-LfL: The minimal increase in fuel consumption in 2017 is mainly due to an increase in direct usage of natural gas by tenants other than
heating.
› GHG-Dir-LfL: The minimal increase in emissions is mainly due to an increase in direct usage of natural gas by tenants other than heating.
› GHG-Indir-LfL: The minimal increase in emissions in 2016 is mainly attributable to higher consumption of district heating.
› GHG-Int: Consistent figure due to an increasing district heating and electricity consumption value.
› Water-Abs and Water-LfL: The decrease cannot be solely attributed to our own water saving measures since the value includes tenant area
consumption as well and is therefore depending on tenant patterns within the assets as well as on individual consumption behaviour.
› Cert-Tot: In terms of energy consumption, approximately 74.5% of our units already perform better than the average residential property in Germany
(160 kWh/sqm per annum). Some 27% of our units use less than 100 kWh/sqm per annum (A+ to C). The average consumption of our holdings stands at
133.4 kWh/sqm per annum, having fallen again slightly as compared to the previous year (2016: 135.1 kWh/sqm per annum). See therefore 1.7 for the
percentage of energy performance by level attained.

Page 9 of 14
2.2 EPRA environmental performance measures (own office)
Absolute Like-for-like (LfL)
Indicator EPRA Unit of measure 2015 2016 2015 2016 % change
Electricity consumption
Elec-Abs, Elec-LfL
kWh 1,117,632 1,027,510 820,591 902,446 10
Proportion of electricity consumption from renewable sources
% 95 95 87 93 6 pp
Coverage of floor area % 100 100 85 78 -7 pp
Energy consumption from district heating and cooling
DH&C-Abs, DH&C-LfL
kWh 2,761,588 2,362,098 1,604,841 1,807,314 12.6
Proportion of district heating & cooling from renewable sources
% not applicable
Coverage of floor area % 99 95 84 78 -6 pp
Energy consumption from fuel
Fuels-Abs, Fuels-LfL
kWh 905,166 936,326 770,142 730,661 -5.1
Proportion of fuels from renewable sources % Share of energy from renewable sources (pellets) around 0.5 %.
Coverage of floor area % 99 95 84 78 -6 pp
Building energy intensity Energy-Int kWh/m2 184 152 145 156 7.7
Direct Scope 1 GHG emissions (total) GHG-Dir-Abs
t CO2 219 227 185 175 -5.4
Coverage of floor area % 99 95 84 78 -6 pp
Total Scope 2 indirect GHG emissions (location based)
GHG-Indir-Abs
t CO2 1,504 1,331 980 1,090 11.2
Total Scope 2 indirect GHG emissions (market based)
t CO2 844 724 530 566 6.9
Coverage of floor area % 99 = DH&C-Abs 100 = Elec-Abs
95 = DH&C-Abs 100 = Elec-Abs
84 = DH&C-LfL 85 = Elec-LfL
78 = DH&C-LfL 78 = Elec-LfL
-6 pp= DH&C-LfL -7 pp = Elec-LfL
Building GHG emissions intensity GHG-Int t CO2/m2 0.041 0.033 0.032 0.034 3.8
Total water consumption Water-Abs, Water-LfL
m3
not applicable Coverage %
Building water consumption intensity Water-Int m3/m
2 not applicable
Weight of waste by disposal route (total) Waste-Abs, Waste-LfL
tonnes
not applicable
% recycled
% sent to landfill
Coverage %
Page 10 of 14
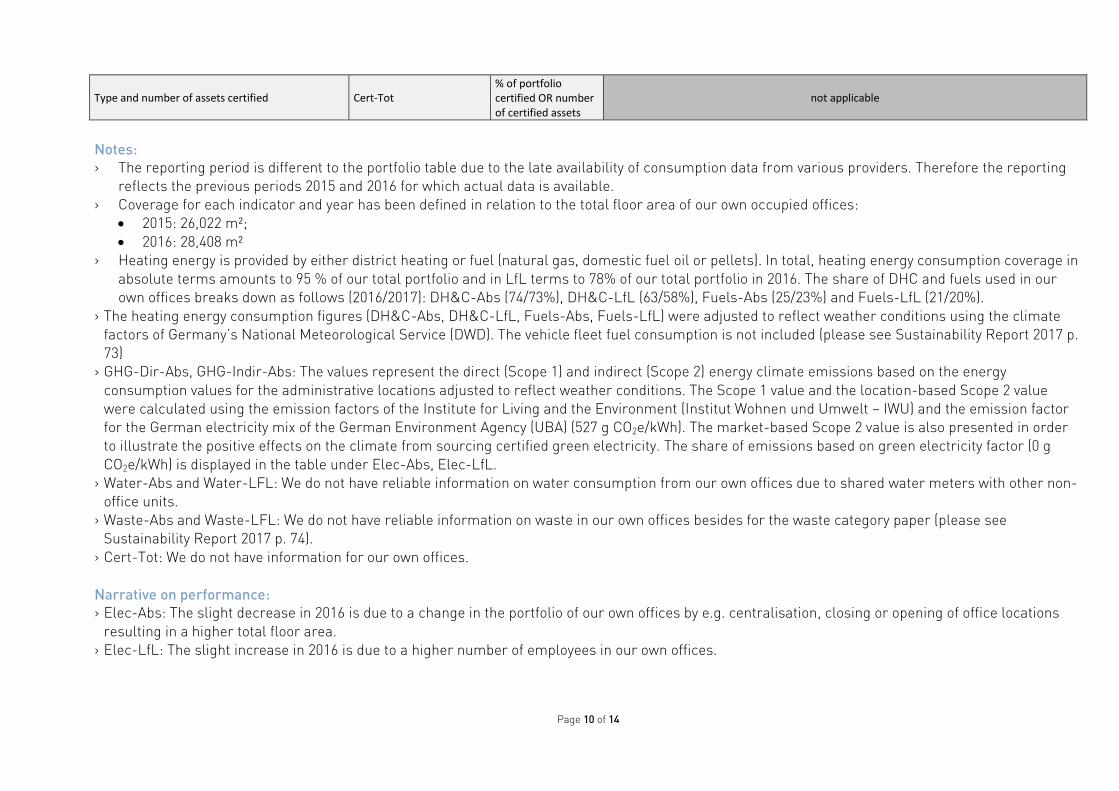
Type and number of assets certified Cert-Tot % of portfolio certified OR number of certified assets
not applicable
Notes: › The reporting period is different to the portfolio table due to the late availability of consumption data from various providers. Therefore the reporting
reflects the previous periods 2015 and 2016 for which actual data is available.
› Coverage for each indicator and year has been defined in relation to the total floor area of our own occupied offices:
2015: 26,022 m²;
2016: 28,408 m²
› Heating energy is provided by either district heating or fuel (natural gas, domestic fuel oil or pellets). In total, heating energy consumption coverage in
absolute terms amounts to 95 % of our total portfolio and in LfL terms to 78% of our total portfolio in 2016. The share of DHC and fuels used in our
own offices breaks down as follows (2016/2017): DH&C-Abs (74/73%), DH&C-LfL (63/58%), Fuels-Abs (25/23%) and Fuels-LfL (21/20%).
› The heating energy consumption figures (DH&C-Abs, DH&C-LfL, Fuels-Abs, Fuels-LfL) were adjusted to reflect weather conditions using the climate
factors of Germany’s National Meteorological Service (DWD). The vehicle fleet fuel consumption is not included (please see Sustainability Report 2017 p.
73)
› GHG-Dir-Abs, GHG-Indir-Abs: The values represent the direct (Scope 1) and indirect (Scope 2) energy climate emissions based on the energy
consumption values for the administrative locations adjusted to reflect weather conditions. The Scope 1 value and the location-based Scope 2 value
were calculated using the emission factors of the Institute for Living and the Environment (Institut Wohnen und Umwelt – IWU) and the emission factor
for the German electricity mix of the German Environment Agency (UBA) (527 g CO2e/kWh). The market-based Scope 2 value is also presented in order
to illustrate the positive effects on the climate from sourcing certified green electricity. The share of emissions based on green electricity factor (0 g
CO2e/kWh) is displayed in the table under Elec-Abs, Elec-LfL.
› Water-Abs and Water-LFL: We do not have reliable information on water consumption from our own offices due to shared water meters with other non-
office units.
› Waste-Abs and Waste-LFL: We do not have reliable information on waste in our own offices besides for the waste category paper (please see
Sustainability Report 2017 p. 74).
› Cert-Tot: We do not have information for our own offices.
Narrative on performance: › Elec-Abs: The slight decrease in 2016 is due to a change in the portfolio of our own offices by e.g. centralisation, closing or opening of office locations
resulting in a higher total floor area.
› Elec-LfL: The slight increase in 2016 is due to a higher number of employees in our own offices.
Page 11 of 14
› DH&C-LfL: The increase in 2016 is mainly due to a higher occupancy rate of our offices due to the higher number of employees as well as to differing
meter reading dates and the individual consumption behaviour.
› Fuels-Abs: The slight increase in 2016 is due to a change in the portfolio of our own offices by e.g. centralisation, closing or opening of office locations
resulting in a higher total floor area.
› Fuels-LfL: The slight decrease in 2016 is due to renovation of buildings and the implementation of technical energy efficiency measures such as a
connection to district heating.
› Energy-Int: The main factor contributing to the increase is the higher number of employees. In fact, taken the energy consumption per capita a decrease
of 6% was achieved due to energy efficiency measures (please see Sustainability Report 2017 p. 55).
› GHG-Dir-LfL: The decrease in 2016 is due to renovation of buildings and the implementation of technical energy efficiency measures.
› GHG-Indir-LfL: The increase in 2016 is due to higher consumption of district heating and cooling and electricity (see Elec-LfL and DH&C-LfL).
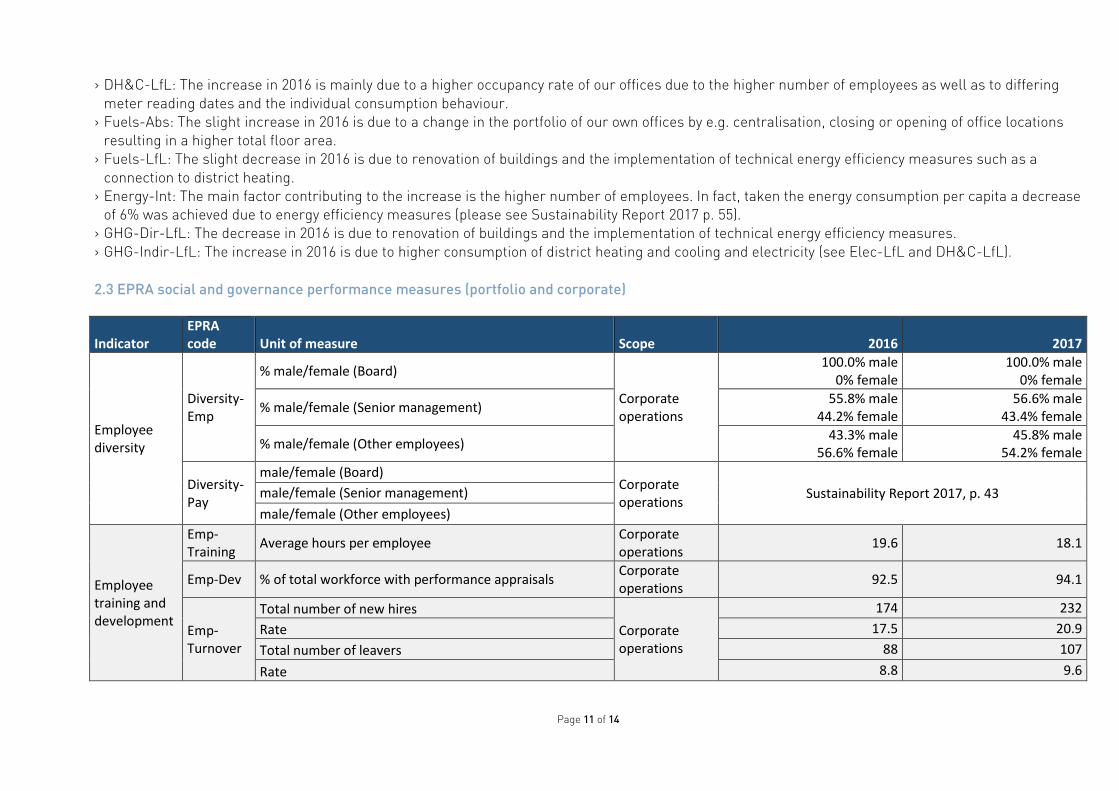
2.3 EPRA social and governance performance measures (portfolio and corporate)
Indicator EPRA code Unit of measure Scope 2016 2017
Employee diversity
Diversity-Emp
% male/female (Board)
Corporate operations
100.0% male 0% female
100.0% male 0% female
% male/female (Senior management) 55.8% male
44.2% female 56.6% male
43.4% female
% male/female (Other employees) 43.3% male
56.6% female 45.8% male
54.2% female
Diversity-Pay
male/female (Board) Corporate operations
Sustainability Report 2017, p. 43 male/female (Senior management)
male/female (Other employees)
Employee training and development
Emp-Training
Average hours per employee Corporate operations
19.6 18.1
Emp-Dev % of total workforce with performance appraisals Corporate operations
92.5 94.1
Emp-Turnover
Total number of new hires
Corporate operations
174 232
Rate 17.5 20.9
Total number of leavers 88 107
Rate 8.8 9.6

Page 12 of 14
Health and safety
H&S-Emp
Injury frequency rate
Corporate operations
0.02 0.02
Lost day rate (number) 105 131
Absenteeism rate 5.9 5.6
Fatalities (Total number) 0 0
H&S-Asset % of assets undergoing health & safety assessments Portfolio 100 100
H&S-Comp
Total number of incidents of non-compliance from health & safety assessments
Portfolio 0 0
Communities Comty-Eng
% of assets with community engagement initiatives Portfolio Sustainability Report 2016, p.
40 et seq. Sustainability Report 2017, p.
60 et seq.
Governance
Gov-Board
Total number of Executive members
Corporate operations
3 members 3 members
Total number of Independent members (Supervisory Board)
6 members 6 members
Average tenure 10 years 10 years
Total number with competencies relating to environmental and social topics
Election process; full range of competencies to fulfil the role of supervision.
Gov-Select
Process for nominating and electing the highest governance body
Corporate operations
Sustainability Report 2017, p. 79
Gov-CoI Process for managing conflicts of interest Corporate operations
Sustainability Report 2017, p. 79
Notes: › Diversity-Emp: % male/female (Other employees) includes trainees; % male/female (Senior management) includes Management Board.
› H&S-Emp: Injury frequency rate: Workplace accidents in relation to total working hours of all employees.
› H&S-Emp: Instead of the lost day rate per X hours worked, the lost day rate is reported as an absolute number based on the following definition: Period
(days) in which work was not possible due to employees not being able to perform their usual duties as a result of a workplace accident.
› H&S-Emp: Absenteeism rate: Lost days based on calculation of actual absenteeism (as a percentage) of the total number of work days designated for
the employees over the same period.
› Comty-Eng: Deutsche Wohnen specifically focuses on measures that allow the company to use its core areas of expertise effectively by numerous local
activities in various locations. Currently we do not collect data on the percentage of assets covered by community engagement initiatives. For the
following reporting period we want to be able to report this indicator.
Page 13 of 14
Narrative on performance: › Diversity-Emp: We commit to diversity and oppose any form of discrimination in all aspects of employment. Further information on the reasons for the
gender composition of the Supervisory Board and the respective target is given in the annual report 2017 (Corporate Governance Report p. 9)
› Diversity-Pay: Our remuneration structure comprises four salary levels. These are based on a comparison of all the occupations at the individual
Deutsche Wohnen companies and on wage agreements within the industry. We assign the employees to these four levels in accordance with their job
description and qualifications. With this remuneration system based on transparent rules, we ensure that employees in comparable positions receive
the same amount of remuneration.
› Emp-Turnover: Our workforce increased again on a net calculation basis by 125 employees.
› Emp-Training: The slight decrease of average hours per employee is due to the higher number of employees, however investments into training and the
absolute number of training hours delivered increased. More information on our management approach and additional indicators are provided in our
Sustainability Report (p. 42; 72).
› H&S-Emp: The rates confirm the effect of our occupational health and safety management approach. The increase of lost days is due to the higher
number of employees. More information is provided in our Sustainability Report (p. 44; 72).
› H&S-Asset; H&S-Comp: In 2017 we kept our performance standard by carrying out a complete health & safety assessment of our portfolio with no
reported incidents.
› Gov-Board; Gov-Select; Gov-CoI: No changes in the composition, selection process of the Supervisory Board or the rules to disclose conflicts of interest.

Page 14 of 14
CONTACT
Kati Pohl
Sustainability Management/CSR
Phone +49 (0)30 897 89 5331
Fax +49 (0)30 897 89 5399
Deutsche Wohnen SE
Mecklenburgische Straße 57
14197 Berlin
Published by Consultant
Deutsche Wohnen SE, Berlin Jones Lang LaSalle, London