Disclaimer · Disclaimer Publication of Merck KGaA, Darmstadt, Germany. In the United States and...
225
DISCLAIMER Publication of Merck KGaA, Darmstadt, Germany. In the United States and Canada the subsidiaries of Merck KGaA, Darmstadt, Germany operate under the umbrella brand EMD.
Transcript of Disclaimer · Disclaimer Publication of Merck KGaA, Darmstadt, Germany. In the United States and...

Disclaimer Publication of Merck KGaA, Darmstadt, Germany. In the United States and Canada the subsidiaries of Merck KGaA, Darmstadt, Germany operate under the umbrella brand EMD.

Merck Annual Report2012
Mer
ckA
nnua
l Rep
ort 2
012
The
road
to to
mor
row
Performance-oriented
Effi cient
Committed
Objective-driven

Merck Annual Report2012
Mer
ckA
nnua
l Rep
ort 2
012
The
road
to to
mor
row
Performance-oriented
Effi cient
Committed
Objective-driven
We are a leading pharmaceutical, chemical and life science company with four strong and dynamic divisions: Merck Serono, Consumer Health, Performance Materialsand Merck Millipore.
We have a clear focus on research and development as well as profi table, high-margin specialties for high-growth markets.
We are committed to living our social, economic and ecological responsibility – toward people, toward our partners in the market and toward our shareholders.
With around 39,000 employees in 66 countries.
Objective-drivenCommittedPerformance-orientedEffi cientSince 1668
We are Merck
Emanuel Merck (1794 – 1855) ➝ established the world‘s oldest pharmaceu-tical and chemical company out of the Engel-Apotheke (Angel Pharmacy), which was founded in 1668. Today we are carrying this tradition into the future with pioneering spirit and innovative strength.

Contents
The road to tomorrow
#01 To our Shareholders 023 ➝ Letter from Karl-Ludwig Kley 026 ➝ The Executive Board
#02 Group Management Report 031 ➝ Merck at a glance 037 ➝ Corporate Responsibility 046 ➝ Merck Shares 048 ➝ Overall Economic Situation 049 ➝ Financial Position and Results of Operations 058 ➝ Merck Serono 070 ➝ Consumer Health 074 ➝ Performance Materials 078 ➝ Merck Millipore 083 ➝ Corporate and Other 084 ➝ Risk Report 091 ➝ Report on Expected Developments 098 ➝ Report in accordance with Section 315 (4)
of the German Commercial Code (HGB) 098 ➝ Subsequent Events
#03 Corporate Governance 101 ➝ Statement on Corporate Governance 121 ➝ Report of the Supervisory Board 124 ➝ Objectives of the Supervisory Board with respect to its composition
#04 Consolidated Financial Statements 128 ➝ Consolidated Income Statement 129 ➝ Consolidated Statement of Comprehensive Income 130 ➝ Consolidated Balance Sheet 131 ➝ Consolidated Cash Flow Statement 132 ➝ Consolidated Statement of Changes in Net Equity 134 ➝ Notes to the Group accounts
#05 Responsibility Statement
#06 Auditor’s Report
#07 More Information 210 ➝ Glossary 215 ➝ Financial Calendar for 2013 216 ➝ Awards and Recognitions
➝ Business Development 2008 – 2012 ➝ Information and Service

The Merck Group In brief
Key figures of the Merck Group
€ million 2012 2011Change
in %
Total revenues 11,172.9 10,276.4 8.7Sales 10,740.8 9,905.9 8.4Operating result (EBIT) 963.6 1,132.1 –14.9
Margin (% of sales) 9.0 11.4 –EBITDA 2,360.2 2,730.9 –13.6
Margin (% of sales) 22.0 27.6 –EBITDA pre one-time items 2,964.9 2,723.8 8.9
Margin (% of sales) 27.6 27.5 –EPS pre one-time items (in €) 7.61 6.79 12.1Free cash fl ow 2,039.9 1,436.4 42.0
Group sales
€ million0
2012
2011
2010
2009
2008
0
10,740.8
9,905.9
8,928.9
7,377.7
7,201.6
EBITDA pre one-time items
€ million0
2012
2011
2010
2009
2008
0
2,964.9
2,723.8
2,545.0
1,652.6
2,051.8
Contents, Merck In brief

The road to tomorrow
The road to tomorrow
The road to tomorrow
The road to tomorrow
The road to tomorrow
The road to tomorrow
The road to tomorrow
The road to tomorrow
The road to tomorrow
The road to tomorrow
The road to tomorrow
The road to tomorrow
The road to tomorrow
The road to tomorrow
The road to tomorrow
The road to tomorrow
The road to tomorrow
The road to tomorrow
The road to tomorrow
The road to tomorrow
The road to tomorrow
The road to tomorrow
The road to tomorrow
The road to tom
orrow The road to tom
orrow The road to tom
orrow The road to tom
orrow The road to tom
orrow The road to tom
orrow The road to tom
orrow The road to tom
orrow The road to tom
orrow The road to tom
orrow The road to tom
orrow The road to tom
orrow The road to tom
orrow The road to tom
orrow The road to tom
orrow The road to tom
orrow The road to tom
orrow The road to tom
orrow The road to tom
orrow The road to tom
orrow The road to tom
orrow The road to tom
orrow The road to tom
orrow The road to tom
orrow The
road to tomorrow
The road to tomorrow
The road to tomorrow
The road to tomorrow
The road to tomorrow
The road to tomorrow
The road to tomorrow
The road to tomorrow
The road to tomorrow
The road to tomorrow
The road to tomorrow
The road to tomorrow
The road to tomorrow
The road to tomorrow
The road to tomorrow
The road to tomorrow
The road to tomorrow
The road to tomorrow
The road to tomorrow
The road to tomorrow
The road to tomorrow
The road to tomorrow
The road to tomorrow
The road to tomor-
row The road to tom
orrow The road to tom
orrow The road to tom
orrow The road to tom
orrow The road to tom
orrow The road to tom
orrow The road to tom
orrow The road to tom
orrow The road to tom
orrow The road to tom
orrow The road to tom
orrow The road to tom
orrow The road to tom
orrow The road to tom
orrow The road to tom
orrow The road to tom
orrow The road to tom
orrow The road to tom
orrow The road to tom
orrow The road to tom
orrow The road to tom
orrow The road to tom
orrow The road to tom
orrow The road
to tomorrow
The road to tomorrow
The road to tomorrow
The road to tomorrow
The road to tomorrow
The road to tomorrow
The road to tomorrow
The road to tomorrow
The road to tomorrow
The road to tomorrow
The road to tomorrow
The road to tomorrow
The road to tomorrow
The road to tomorrow
The road to tomorrow
The road to tomorrow
The road to tomorrow
The road to tomorrow
The road to tomorrow
The road to tomorrow
The road to tomorrow
The road to tomorrow
The road to tomorrow
The road to tomorrow
The road to tom
orrow The road to tom
orrow The road to tom
orrow The road to tom
orrow The road to tom
orrow The road to tom
orrow The road to tom
orrow The road to tom
orrow The road to tom
orrow The road to tom
orrow The road to tom
orrow The road to tom
orrow The road to tom
orrow The road to tom
orrow The road to tom
orrow The road to tom
orrow The road to tom
orrow The road to tom
orrow The road to tom
orrow The road to tom
orrow The road to tom
orrow The road to tom
orrow The road to tom
orrow The road to
tomorrow
The road to tomorrow
The road to tomorrow
The road to tomorrow
The road to tomorrow
The road to tomorrow
The road to tomorrow
The road to tomorrow
The road to tomorrow
The road to tomorrow
The road to tomorrow
The road to tomorrow
The road to tomorrow
The road to tomorrow
The road to tomorrow
The road to tomorrow
The road to tomorrow
The road to tomorrow
The road to tomorrow
The road to tomorrow
The road to tomorrow
The road to tomorrow
The road to tomorrow
The road to tomorrow
The road to tom
orrow The road to tom
orrow The road to tom
orrow The road to tom
orrow The road to tom
orrow The road to tom
orrow The road to tom
orrow The road to tom
orrow The road to tom
orrow The road to tom
orrow The road to tom
orrow The road to tom
orrow The road to tom
orrow The road to tom
orrow The road to tom
orrow The road to tom
orrow The road to tom
orrow The road to tom
orrow The road to tom
orrow The road to tom
orrow The road to tom
orrow The road to tom
orrow The road to tom
orrow The road to tom
or-row
The road to tomorrow
The road to tomorrow
The road to tomorrow
The road to tomorrow
The road to tomorrow
The road to tomorrow
The road to tomorrow
The road to tomorrow
The road to tomorrow
The road to tomorrow
The road to tomorrow
The road to tomorrow
The road to tomorrow
The road to tomorrow
The road to tomorrow
The road to tomorrow
The road to tomorrow
The road to tomorrow
The road to tomorrow
The road to tomorrow
The road to tomorrow
The road to tomorrow
The road to tomorrow
The road to tom
orrow The road to tom
orrow The road to tom
orrow The road to tom
orrow The road to tom
orrow The road to tom
orrow The road to tom
orrow The road to tom
orrow The road to tom
orrow The road to tom
orrow The road to tom
orrow The road to tom
orrow The road to tom
orrow The road to tom
orrow The road to tom
orrow The road to tom
orrow The road to tom
orrow The road to tom
orrow The road to tom
orrow The road to tom
orrow The road to tom
orrow The road to tom
orrow The road to tom
orrow The road to tom
orrow
row The road to tom
orrow The road to tom
orrow The road to tom
orrow
The road to tomorrowMerckAnnual Report for 2012
Join us on the road to tomorrow – with our 2012 Annual Report, which offers far more than just a look back at the past year. Follow our progress on this journey – with our online media as well as our media for tablet computers.More information is available online at:
➝www.merckgroup.com➝magazine.merck.com

Fit for
2018
I
ME
RC
K A
NN
UA
L R
Ep
oR
t 20
12 –
th
E R
oA
d t
o t
oM
oR
Ro
w –
ww
w.M
ER
CK
gR
oU
p.C
oM
Future
growth
A shared
performAnce culture➝ Five leadership principles “Results Orientation”,
“Efficiency”, “Global Footprint”, “Innovation/Quality”, and “Customer Focus”➝ An improved feedback culture
Greater efficiency
➝ Less complexity in structures and processes ➝ Lower costs in all units, functions and countries
➝ A continuous improvement program in daily business
Global leadership organization
➝ New appointments to management positions throughout the entire company
➝ A new talent and performance management process
New strategy:
➝ Group strategy➝ Divisional strategies
➝ Ten strategic growth initiatives on which investments are focused
2 Merck 2012Fit for 2018

Ideas that connectIdeas that enable change
The future is created in the minds and hearts of pioneering thinkers and dynamic entrepreneurs. With expertise, passion and innovative products, Merck provides valuable impetus to improve and enrich everyday life as well as the health and lives of people – on both a small and large scale.
Yet the future is also being created by the visionary ideas and clear goals of the pharmaceutical, chemical and life science leader of tomorrow.
On the road to tomorrow we launched a change process called “Fit for 2018”. We are streamlining our organizational structure and at the same time align-ing it specifically to current and future requirements. We are giving our strong divisions full business accountability. We are increasing our profitability and establishing clear guidelines with centrally steered corporate development targets. We are establishing a performance-oriented culture while promoting objective-driven thinking, engaged teamwork and efficient actions.
Our shared ideas connect us. They are changing our company.
FundaMenTal TransFOrMaTiOnFOr FuTure grOWTh
3Merck 2012The road to tomorrow
3
I
Obje
ctiv
e-dr
iven
Mer
ck
ME
RC
K A
NN
UA
L R
Ep
oR
t 20
12 –
th
E R
oA
d t
o t
oM
oR
Ro
w –
ww
w.M
ER
CK
gR
oU
p.C
oM
The road to tomorrowIdeas that connect ➝ Ideas that enable change
4 Merck 2012The road to tomorrow

1/4
I
ME
RC
K A
NN
UA
L R
Ep
oR
t 20
12 –
th
E R
oA
d t
o t
oM
oR
Ro
w –
ww
w.M
ER
CK
gR
oU
p.C
oM
Ideas that connect Objective-driven
Objective ➝ General: A clearly defined, targeted future status. ➝ To us: The motivation for our actions and the key driver
of our innovative strength.
-A-
-B-
The road to tomorrow 1 / 4
Through our objective-driven actions, we’re capturing new markets
5Merck 2012The road to tomorrow

1/4
I
ME
RC
K A
NN
UA
L R
Ep
oR
t 20
12 –
th
E R
oA
d t
o t
oM
oR
Ro
w –
ww
w.M
ER
CK
gR
oU
p.C
oM
Ideas that enable change Objective-driven
Eshmuno ➝ helps to produce new medicines, for instance to treat hemophilia.
-A-
-B-
Eshmuno – how shared goals lead to competitive advantages
➝ Objective-driven actions are a cornerstone of our corporate strategy. Constant innovations have enabled us to become a driving force in the life sciences sector and help our customers – whether research laboratories or pharmaceutical manu-facturers – to work even more productively and safely.
➝ We’re doing this with the new eshmuno product line. These “smart” ion exchange resins make the purification of biomolecules much easier, faster and more produc-tive. As a result, it is possible to obtain purified blood factors in the downstream processing of blood plasma.
6 Merck 2012The road to tomorrow

I
ME
RC
K A
NN
UA
L R
Ep
oR
t 20
12 –
th
E R
oA
d t
o t
oM
oR
Ro
w –
ww
w.M
ER
CK
gR
oU
p.C
oM
7Merck 2012The road to tomorrow
I
Perf
orm
ance
-ori
ente
dM
erck
ME
RC
K A
NN
UA
L R
Ep
oR
t 20
12 –
th
E R
oA
d t
o t
oM
oR
Ro
w –
ww
w.M
ER
CK
gR
oU
p.C
oM
The road to tomorrowIdeas that connect ➝ Ideas that enable change
8 Merck 2012The road to tomorrow

2/4
I
ME
RC
K A
NN
UA
L R
Ep
oR
t 20
12 –
th
E R
oA
d t
o t
oM
oR
Ro
w –
ww
w.M
ER
CK
gR
oU
p.C
oM
Ideas that connect Performance-oriented
Performance ➝ General: The result of an endeavor over a certain period of time. ➝ To us: The foundation for achieving our objectives and meeting the needs
of our customers and business partners.
-A-
-B-
The road to tomorrow 2 / 4
Performance and customer focus bring us closer to people
9Merck 2012The road to tomorrow

2/4
I
ME
RC
K A
NN
UA
L R
Ep
oR
t 20
12 –
th
E R
oA
d t
o t
oM
oR
Ro
w –
ww
w.M
ER
CK
gR
oU
p.C
oM
Ideas that enable change Performance-oriented
Gonal-f ® ➝ is a leading global fertility product that reflects how we understand performance and customer orientation. With sales increasing by 16 percent to € 612 million in 2012, this product is one of our top-three selling drugs.
-A-
-B-
Gonal-f ® – how performance creates mutual benefit
➝ Performance and customer orientation are two of our top priorities at our pharmaceutical research hubs in darmstadt (germany), Boston, Ma (united states) and Beijing (China), because our focus is on people. This particularly applies to our research and development work in fertility in order to support couples who wish to conceive.
➝ Increasing fertility: That is what our successful drug gonal-f ® stands for. With this product, we are helping people to enrich their lives through new life, bringing joy to couples in over 100 countries around the world. Their happiness is what inspires us to aim for even higher levels of performance each and every day.
10 Merck 2012The road to tomorrow

I
ME
RC
K A
NN
UA
L R
Ep
oR
t 20
12 –
th
E R
oA
d t
o t
oM
oR
Ro
w –
ww
w.M
ER
CK
gR
oU
p.C
oM
11Merck 2012The road to tomorrow
I
With
com
mitm
ent
Mer
ck
ME
RC
K A
NN
UA
L R
Ep
oR
t 20
12 –
th
E R
oA
d t
o t
oM
oR
Ro
w –
ww
w.M
ER
CK
gR
oU
p.C
oM
The road to tomorrowIdeas that connect ➝ Ideas that enable change
12 Merck 2012The road to tomorrow

3/4
I
ME
RC
K A
NN
UA
L R
Ep
oR
t 20
12 –
th
E R
oA
d t
o t
oM
oR
Ro
w –
ww
w.M
ER
CK
gR
oU
p.C
oM
Ideas that connect With commitment
Commitment➝ General: Personal effort applied to a certain cause. ➝ To us: The basis for our exceptional ideas with which we sustainably
help people around the world.
-A-
-B-
The road to tomorrow 3 / 4
We are committed to helping people all over the world
13Merck 2012The road to tomorrow

3/4
I
ME
RC
K A
NN
UA
L R
Ep
oR
t 20
12 –
th
E R
oA
d t
o t
oM
oR
Ro
w –
ww
w.M
ER
CK
gR
oU
p.C
oM
Ideas that enable change With commitment
Minilab ➝ Interpol estimates that up to 30 percent of the medicines being offered worldwide are counterfeit or of inferior quality. In developing countries, this rate is many times higher. Globally, more than 570 Minilabs are currently in use in more than 80 countries, mainly in Africa and Asia.
-A-
-B-
Minilabs – how a charitable initiative is delivering sustainable support
➝ Commitment, courage and responsibility are values that have always character-ized us. On this basis, we constantly develop exceptional solutions – not just for our customers and employees, but for people all over the world.
➝ Our Minilabs are one example of a solution that helps people. These mobile laboratories can be used worldwide to check medicines for their authenticity. They were developed by the global Pharma health Fund (gPhF), a charitable initiative funded by Merck. Thanks to gPhF and its collaboration with inter-national partners, our Minilabs are being used in over 80 countries around the world to check the quality of medicines.
14 Merck 2012The road to tomorrow

I
ME
RC
K A
NN
UA
L R
Ep
oR
t 20
12 –
th
E R
oA
d t
o t
oM
oR
Ro
w –
ww
w.M
ER
CK
gR
oU
p.C
oM
15Merck 2012The road to tomorrow

I
Effic
ient
lyM
erck
ME
RC
K A
NN
UA
L R
Ep
oR
t 20
12 –
th
E R
oA
d t
o t
oM
oR
Ro
w –
ww
w.M
ER
CK
gR
oU
p.C
oM
The road to tomorrowIdeas that connect ➝ Ideas that enable change
16 Merck 2012The road to tomorrow
4/4
I
ME
RC
K A
NN
UA
L R
Ep
oR
t 20
12 –
th
E R
oA
d t
o t
oM
oR
Ro
w –
ww
w.M
ER
CK
gR
oU
p.C
oM
Ideas that connect Efficiently
Efficiency ➝ General: The relationship between input and benefit achieved. ➝ To us: A crucial factor in achieving our objectives, both internally
and in cooperation with others.
-A-
-B-
The road to tomorrow 4 / 4
By working together, we are creating efficient supply
17Merck 2012The road to tomorrow

4/4
I
ME
RC
K A
NN
UA
L R
Ep
oR
t 20
12 –
th
E R
oA
d t
o t
oM
oR
Ro
w –
ww
w.M
ER
CK
gR
oU
p.C
oM
Ideas that enable change Efficiently
Dr.Reddy‘s➝ Dr. Reddy’s Laboratories Ltd. is an ideal partner with expertise in biosimilars and generics as well as in emerging markets. Combining this with our experience in developing, manufacturing and commercializing biopharmaceuticals will enable us to achieve success together.
-A-
-B-
Dr. Reddy’s – how efficient cooperation creates maximum synergy
➝ Efficiency is a crucial factor in our work. We want to sustainably benefit from synergy effects that are constantly created not only within our company, but also in cooperation with other companies. We’re partnering globally with dr. reddy’s on biosimilars, drawing benefit from both its expertise and market strength as well as from the significant reduction in R&D costs.
➝ Through biosimilars, we want to decisively improve our range of products and services, also for oncology patients, giving them more economical access to high-quality medicines, and, last but not least, help optimize the performance capability of health care systems in emerging countries.
18 Merck 2012The road to tomorrow

I
ME
RC
K A
NN
UA
L R
Ep
oR
t 20
12 –
th
E R
oA
d t
o t
oM
oR
Ro
w –
ww
w.M
ER
CK
gR
oU
p.C
oM
19Merck 2012The road to tomorrow

TOGETHERon the road to tomorrow
I
One WOrld€ 11,173 million in total revenues
One TeaM38,847 employees
ME
RC
K A
NN
UA
L R
Ep
oR
t 20
12 –
th
E R
oA
d t
o t
oM
oR
Ro
w –
ww
w.M
ER
CK
gR
oU
p.C
oM
20 Merck 2012The road to tomorrow

028
021
# 01 To our Shareholders
023➝ Letter from Karl-Ludwig Kley026➝ The Executive Board
Merck 2012
To o
ur S
hare
hold
ers

1/5
I
Letter from Karl-Ludwig Kley
22 Merck 2012To our Shareholders
To o
ur S
hare
hold
ers

In 2012, Merck continued successfully down the “road to tomorrow”. Not only did we make progress with one of the most extensive change programs in the 345-year history of the company, we also succeeded in further expanding our business in a challenging economic environment.
The numbers prove this. Total revenues increased by 8.7% to € 11.2 billion. Our businesses grew mainly in emerging markets and in North America. Our strategy to focus on these centers of growth is thus paying off.
EBITDA pre one-time items, with which we measure the earning power of operating activities, also increased sharply – by 8.9% to € 3.0 billion. Owing to one-time effects in connection with the “Fit for 2018“ efficiency and growth program, profit after tax declined by 6.3% to € 579 million.
We reduced net financial debt, resulting primarily from the Millipore acquisition, by nearly € 1.6 billion to € 1.9 billion in 2012. We will continue to lower our debt in 2013.
At the Annual General Meeting on April 26 we will propose to increase the dividend by € 0.20 to € 1.70 per share. The level of the dividend payment reflects the robust financial strength and good business performance of Merck.
We also made good progress in 2012 with the internal realignment of Merck. We simplified our organizational structures, accelerated processes and thus started to lower costs considerably.
For instance, we established a new global leadership organization at Merck. This involved numerous personnel changes at the upper levels of management. The new structure enables us to address customer wishes and requirements even faster and in a more targeted way than before.
At Merck Serono, we streamlined our R&D organization and started to realign our development pipeline. Apart from focusing on the most promising internal projects, the efforts also included in-licensing agreements.
And lastly, we created the foundations to lower our costs permanently and noticeably. The planned closure of the Merck Serono site in Geneva and the framework agreement with the employee representatives in Germany were just two steps among many. Nearly all countries and areas of the Group were and still are involved in this process, with which we are freeing up resources for future growth.
23Merck 2012To our Shareholders
Letter from Karl-Ludwig Kley

In 2013, we will initially be working to globally conclude the efficiency program started in 2012. It will then be superseded by a continuous improvement program, which will build on our achievements and optimize Merck going forward.
At the same time, we are setting the course for long-term profitable growth of our businesses by successively further developing our strategy, portfolio and the regional positioning of our divisions.
At Merck Serono, we are working to improve our pipeline – also through in-licensing agreements – and to strengthen our regional presence, especially in the United States, Japan and China. At the same time, we continue to rely on collaborations with external research and development partners.
Strengthening profitability and focusing on strategic brands are the main objectives of Consumer Health.
In Performance Materials, firstly we want to defend our global market leadership in liquid crystals. Secondly, we are positioning ourselves in OLED technology as a reliable supplier and a provider of all-round solutions. And we are repositioning our Pigments business.
In order to achieve even stronger growth with innovative products in the life science sector, at Merck Millipore we are investing heavily in research and development as well as in bolt-on acquisitions.
In addition to the divisional strategies, we defined strategic initiatives in areas of overriding importance to the future development of Merck. One example is the optimization of our internal talent management process, which we are using to even better promote prospective executives and prepare them for future assignments within the company.
24 Merck 2012To our Shareholders
Letter from Karl-Ludwig Kley

Our goal is to transform Merck into a faster and more efficient company that delivers profit-able growth through its innovative pharmaceutical, chemical and life science businesses.
In doing so, we will remain true to our well-established values of courage, achievement, responsibility, respect, integrity and transparency. They still form the coordinate system by which we align our entrepreneurial activity.
In 2018, we want to be a company that is synonymous with innovation, quality and sustain-ability. A company that remains recognized for performance, efficiency and the career opportunities that it offers around the world. And a company that is respected for its values, its culture, and for the fact that it always acts responsibly. In brief: We are committed to making great things happen at Merck. That is what our workforce of around 39,000 men and women are aiming for each and every day.
The “road to tomorrow”, which we began traveling down in 2011 and 2012, will also serve as our path in the coming years. As the German novelist Theodor Fontane once wrote: “Courage is good but persistence is better.”
I thank you for the trust and the support that you have shown us on this journey. Please remain with us as we continue along the road to tomorrow.
Karl-Ludwig KleyChairman of the Executive Board
25Merck 2012To our Shareholders
Letter from Karl-Ludwig Kley

The Executive Board
Matthias ZachertChief Financial Officer
Born in 1967, university degree in business administration; Joined Merck in June 2011 as a Member of the Executive Board
Responsibility for Group functions: Group Accounting & Subsidiaries; Group Controlling & Risk Management; Corporate Finance; Group Tax; Group Insurance; Group Procurement; Investor Relations
Karl-Ludwig KleyChairman of the Executive Board
Born in 1951, lawyer; Member of the Supervisory Board and Board of Partners of Merck from March 2004 to June 2006; Member of the Executive Board since September 2006
Responsibility for Group functions: Group Strategy; Group Communications; Group Legal & Compliance; Group Internal Auditing
Kai BeckmannHead of Group Human ResourcesChief Administration Officer
Born in 1965, university degree in computer science; Joined Merck in 1989; Member of the Executive Board since April 2011
Responsibility for Group functions: Group Human Resources; Group Information Services; Site Operations; Inhouse Consulting
26 Merck 2012To our Shareholders

1/5
I
Bernd ReckmannResponsible for the Performance Materials and Merck Millipore divisions
Born in 1955, biochemist; Joined Merck in 1986; Member of the Executive Board since 2007
Responsibility for Group functions: Environment, Health, Safety, Security, Quality
Stefan OschmannResponsible for the Merck Serono and Consumer Health divisions
Born in 1957, veterinarian; Joined Merck in January 2011 as a Member of the Executive Board
Responsibility for Group functions: Patents & Scientific Services

-qR-
-qR-
-qR-
-qR-
-ID-
-ID-
-ID-
-ID-
-i-
-i-
-i-
-i-
1/5
I
ME
RC
K A
NN
UA
L R
EP
OR
T 20
12 –
TH
E R
OA
D T
O T
OM
OR
RO
W –
WW
W.M
ER
CK
GR
OU
P.C
OM
Merck Serono
Consumer Health
Performance Materials
Merck Millipore
Merck Serono is the largest division of Merck. It markets innovative prescription drugs to treat cancer, multiple sclerosis, infertility, growth disorders, and selected cardiovascular and metabolic diseases. Merck Serono’s products are primarily prescribed by specialists and largely manufactured using biotechnology.
Our Consumer Health division offers over-the-counter pharmaceuticals and focuses on a range of well-known brands that primarily address health themes such as mobility, women’s and children’s health, cough and cold, as well as everyday health protection.
Performance Materials provides high-tech performance chemicals for applications in fields such as consumer electronics, lighting, coatings, printing, plastics, and cosmetics. With a market share of between 50% and 60%, Merck has been the market leader in liquid crystal mixtures for many years.
Our Merck Millipore division is the world’s third-largest supplier of products and services for the life science industry. These are used by customers working in research and analytical laboratories as well as in pharmaceutical manufacturing.
www.merckserono.com
www.merck-consumer-health.com
www.merck-performance-materials.com
Page 58
Page 70
Page 74
Page 78www.merckmillipore.com
Our divisions
28 Merck 2012To our Shareholders
098
029
# 02Merck Group Management Report 2012
031➝ Merck at a glance037➝ Corporate Responsibility046➝ Merck Shares048➝ Overall Economic Situation 049➝ Financial Position and Results of Operations 058➝ Merck Serono 070➝ Consumer Health 074➝ Performance Materials 078➝ Merck Millipore 083➝ Corporate and Other 084➝ Risk Report 091➝ Report on Expected Developments 098➝ Report in accordance with Section 315 (4)
of the German Commercial Code (HGB)098➝ Subsequent Events
Merck 2012
Grou
p M
anag
emen
t Rep
ort

2/5
I
ME
RC
K A
NN
UA
L R
Ep
oR
t 20
12 –
th
E R
oA
d t
o t
oM
oR
Ro
w –
ww
w.M
ER
CK
gR
oU
p.C
oM
Group-wide transformation program
On the road to tomorrow
Efficiency➝ Simplify the organization ➝ Optimize cost structure➝ Increase R&D productivity
Cultural Change➝ Fill key positions with best managers➝ Foster performance culture
Portfolio➝ No portfolio divestments until 2014 ➝ No transformational deals before 2014
Organic growth➝ Exploit leading market positions➝ Execute selected bolt-on acquisitions
Transformation process 2012–2018
Merck Serono generates the largest proportion of sales and earnings
1 Including Corporate and Other (€ –211 million)
Sales 2012
€ 10,741 millionEBITDA pre one-time items 20121
€ 2,965 million
2%Consumer Health
56%Merck Serono 19%
Merck Millipore
23%Performance Materials
4%Consumer Health
56%Merck Serono
16%Performance Materials
24%Merck Millipore
2011 2012 2013 2014 2015 2016–18
30 Merck 2012Group Management Report
Grou
p M
anag
emen
t Rep
ort

Merck at a glance
Our divisionsMerck is a global company with operations spanning innovative pharmaceutical and biopharmaceutical products, life science tools and specialty chemicals. Merck is organized around four divisions.
Group Sales
€ million0
2012
2011
2010
2009
2008
0
10,741
9,906
8,929
7,378
7,202
Group EBITDA pre one-time items
€ million0
2012
2011
2010
2009
2008
0
1 Unaudited
2,965
2,724
2,5451
1,6531
2,0521
Merck SeronoMerck Serono develops, manufactures and markets prescription drugs to treat cancer, multiple sclerosis (MS), infertility, growth disorders, and selected cardiovascular and metabolic diseases. In 2012, the division contributed 56% to Group sales and 56% to Group EBITDA pre one-time items (excluding Corporate and Other). The division was formed in 2007 by the merger of Merck’s ethical pharmaceutical business with the biopharmaceutical company Serono.
31Merck 2012Group Management Report

Merck Serono’s products are primarily prescribed by specialists and sales are dominated by drugs manufactured using biotechnology. The two main products, Rebif ® and Erbitux ®, generate around half of the division’s sales. Rebif ® is a leading drug for the treatment of relapsing multiple sclerosis, where relapses and recovery episodes alternate. The human serum albumin-free formulation of Rebif ® providing improved injection tolerability has been available outside the United States since 2007. The targeted cancer drug Erbitux ® is approved for the treatment of metastatic colorectal cancer. This monoclonal antibody is also a standard in the treatment of squamous cell carcinoma of the head and neck. The fertility franchise, a complete portfolio of recombinant gonadotropins delivering around 14% of sales, is an important growth contributor based on current trends of couples postponing childbearing until later in life. Additionally, increasing ability to pay and access to health care has spurred the growth of Merck Serono’s infertility treatments in the Emerging Markets. The General Medicine unit contributes one third of overall sales and comprises branded products to treat diabetes and cardiovascular diseases. These drugs are no longer patent protected, yet as is the case for Glucophage ® (metformin) in diabetes, they remain recognized standard treatments. Sales of this portfolio are growing in the Emerging Markets due to increasing wealth and changing lifestyles. Merck has been actively marketing pharmaceutical products in the Emerging Markets for decades and is viewed as a trusted partner by doctors and government agencies.
Often, successful therapy is not just about the drug, but also how it is administered to the patient. Merck Serono has years of experience in developing novel injection devices that are easy to use, especially in the areas of Multiple Sclerosis, Fertility and Endocrinology. They offer patients the benefit of less painful and often more reliable injections than using a prefilled syringe. From the healthcare professional’s perspective, these devices can enhance patient’s compliance with treatment. Successful adoption of devices has proven to be a significant differentiator even with the advent of generic competition, for example in the field of growth hormone deficiency.
Merck Serono invests around € 1 billion each year in research and development (R&D) focused on the core therapeutic areas of Oncology, Multiple Sclerosis, and Immunology. With three global hubs located in Europe, North America and Asia, Merck Serono is well placed to access local science and talent as well as to conduct global clinical trials.
In addition to in-house research, Merck Serono is committed to building long-term relationships with external partner companies, academic institutions and collaborative groups that enhance the productivity of its drug discovery activities, providing access to innovative and emerging technologies. The division is also seeking to strengthen its franchises by in-licensing of clinical stage compounds.
Consumer HealthThe Consumer Health division manufactures and markets prescription-free drugs primarily addressing health themes such as mobility, women’s and children’s health, cough and cold as well as everyday health protection. The division focuses on a number of well-known brands ranking among the top three in certain markets. It has a strong base in Europe and is quickly growing in Emerging Markets. In 2012, the division contributed 4% to Group sales and 2% to Group EBITDA pre one-time items (excluding Corporate and Other).
The Merck Serono division focuses on biopharmaceuticals
Injection devices offer benefits
R&D focus on Oncology, MS and Immunology
32 Merck 2012Group Management Report
Merck at a glance

Performance Materials Performance Materials is a specialty chemicals business that offers high-tech performance chemicals for applications in fields such as consumer electronics, lighting, coatings, printing, plastics, and cosmetics. The division comprises the two business units Liquid Crystals and Pigments & Cosmetics. In 2012, Performance Materials contributed 16% to Group sales and 23% to the Group’s EBITDA pre one-time items (excluding Corporate and Other), indicating the division’s healthy and sustainable profitability.
Liquid Crystals generates more than 70% of the division’s sales. Based on a market share of between 50% and 60%, this business has for many years commanded the number one market position for liquid crystal mixtures used in liquid crystal displays (LCDs). With the broadest offering in the industry, the business unit’s product portfolio comprises liquid crystals tailored to match the individual requirements of the full range of LCDs, from small displays in smartphones to ultra-large televisions. The portfolio includes liquid crystals based on polymer stabilized vertical alignment (PS-VA) technologies, primarily used in mid- and large-sized televisions, as well as liquid crystals based on in-plane switching (IPS) technology, which are also used in televisions as well as increasingly in mobile devices such as tablet PCs and smartphones. The Liquid Crystals business unit operates in a highly consolidated market with a total of only three suppliers, indicating the high barriers to entry as a result of the scientific complexity of liquid crystals and their high quality requirements. Liquid Crystals supplies all seven major LCD panel manufacturers that serve television manufacturers or other consumer electronics companies. The business unit also offers materials for organic light-emitting diodes (OLED) used for new lighting applications and display technologies.
The Pigments & Cosmetics business unit develops and markets a comprehensive product portfolio of decorative and functional pigments, spanning a variety of colors and shimmer effects. These pigments are primarily processed into automotive and industrial coatings, plastics, cosmetic products and security paints. The portfolio also includes high-quality cosmetic products especially for use in skin care, oral care and hair care products, including UV filters.
To secure and strengthen its position as innovation leader in its respective fields, ongoing investments in R&D, particularly in Liquid Crystals, are a cornerstone of the division’s business strategy.
Merck MilliporeMerck Millipore offers solutions to two key customer groups: on the one hand research and analytical laboratories in the pharmaceutical/biotechnology industry or in academic institutions and on the other hand production customers manufacturing large- and small-molecule drugs. Formed in 2010 through the acquisition of the Millipore Corporation, the division has developed into the global number three supplier of tools to the life science industry. The division has a broad product portfolio with scale and geographic reach and conducts smaller bolt-on acquisitions to make effective use of its global sales channels. Merck Millipore achieves the majority of its sales with consumables, significantly more than the estimated industry average. Based on its diversified group of customers and its focus on consumables the division generates recurring sales streams that lead to stable, attractive cash flows with a low risk profile. In 2012, the division contributed 24% to Group sales and 19% to Group EBITDA pre one-time items (excluding Corporate and Other).
Market leader in liquid crystals based on a broad product portfolio and R&D investments
Global number three supplier in the life science market
33Merck 2012Group Management Report
Merck at a glance

The Bioscience business unit, which contributes 18% to divisional sales, is focused on the needs of researchers to understand complete biological systems and identify new therapeutic targets. The product portfolio aims to simplify the work flow for researchers, offering consolidated and validated solutions. Main product groups on offer include devices and consumables for filtration and sample preparation, reagents and kits for cell biology experiments, and small instruments and consumables for cell analysis. The life science research sector is highly innovative and the business unit generates between 15% and 20% of annual sales based on new product launches.
The Lab Solutions business unit accounts for 42% of sales and supplies products to laboratories that help to identify and eliminate impurities and contaminants. It is one of the leading suppliers of laboratory water equipment and consumables. Lab water purity is critical to the success of research experiments and the market is characterized by strong customer loyalty and high barriers to entry. The unit also develops and markets test solutions that help identify microbial contamination i.e. in pharmaceuticals, food or tap water.
The Process Solutions business unit supplies products used by pharmaceutical and biotechnology companies to manufacture large- and small-molecule drugs safely and efficiently. It contributes 40% of the division’s sales. Merck Millipore has become the leading supplier in this sector based on constant innovation, highest quality and reliable supply. In the area of small molecule production, Merck Millipore offers over more than 400 chemicals used for synthesis of active pharmaceutical ingredients in addition to products that convert drugs into their final forms, e.g. pills or injection solutions. The offering in biotech production comprises products supporting cell growth and gene expression, a wide range of filtration devices as well as salts and sugars that ensure the stability and biological activity of the final drug. Merck Millipore’s single-use solutions offer increased operational flexibility and versatility to biopharmaceutical customers since they eliminate time and cost of cleaning, are easily adaptable to different products and therefore need lower capital investment.
Success of new product launches is critical to the growth and profitability of all three business units. Therefore around 6% of sales are re-invested in R&D activities.
In North America, Merck has been operating its divisions under the name EMD since 2001 to differentiate itself from Merck & Co. of the United States, an independent company.
Company strategy
Merck aspires to be a successful player in the pharmaceutical, life science tools and speciality chemicals industries, with leading positions in attractive segments of these markets. To achieve this, we are building on our leading brands in all four of our divisions in order to create a revenue stream that, in our current understanding, is widely protected from economic cycles. Furthermore, Merck has a solid market position in the Emerging Markets shown by a high exposure of more than one-third of Group sales. Current and future investments are targeted to benefit from future volume growth in the Emerging Markets.
Bioscience mainly serves the research sector
Process Solutions addresses the needs of pharmaceutical manufacturers
Strong market positions in pharmaceuticals, life science and specialty chemicals
34 Merck 2012Group Management Report
Merck at a glance

Merck is in the midst of a transformation, which started with an overhaul of the Group’s organizational structures. The subsequent and first-ever company-wide efficiency program will lead to more focus on growth in the coming years. The organizational changes have been already implemented. The efficiency measures are currently being implemented with the aim of ensuring a cost structure that is competitive with that of our peers. Management expects to expand operating and net margins through to 2014, with the primary driver of this performance improvement being Merck Serono. A more far-reaching goal of Fit for 2018 consists of a cultural change leading to the creation of a strong performance-oriented culture. Elements include results orientation, efficiency, a global footprint, innovation, quality, and customer focus.
At Merck Serono, the major change is a refocused R&D organization (see page 64 et seq.). Operating costs, historically higher than industry average (in % of sales), are to be reduced. Actions facilitating these changes include the closure of the former Merck Serono headquarters in Geneva (Switzerland), reducing fixed costs in R&D, more focused spending in marketing and selling, and the consolidation of various depart-ments and functions across the division.
Consumer Health will fundamentally improve its operational profitability, which is currently lower than industry average. This will be achieved by more focused and therefore lower spending in marketing and selling, and more targeted spending in R&D.
In contrast to the pharmaceutical divisions, Performance Materials and Merck Millipore are not viewed as major restructuring cases. However, in the context of the Group-wide program, smaller scale projects are being or will be implemented to eliminate inefficiencies, for example in Pigments & Cosmetics.
Also in Group functions (departments that are not allocatable to a single division and are reported under Corporate and Other) selected efficiency measures are planned.
Merck expects to deliver visible margin expansion as of 2014, while continuing to generate organic sales growth. Planned net savings of € 365 million, which are to be reached annually from 2017 onwards, should lead to structurally improved Group profitability.
For Merck Serono, the company aims to generate net cost savings of € 300 million annually from 2014 onwards. Out of these savings, 40% are planned to come from lower but more effective spending in the division’s R&D functions. Commercial Operations (impacting costs of marketing and selling as well as administration) will contribute around 60% of the savings, primarily through a leaner and more centralized organization. The target for Consumer Health is net cost savings of € 25 million annually from 2014 onwards, achieved through lower spending on marketing and selling, administration, research and development as well as optimized logistics. With a stable medium-term sales outlook and comparably high margins, Performance Materials remains an attractive business and a core part of Merck. For Merck Millipore, longer- term saving targets have been established. The division is expected to deliver net cost savings of approximately € 40 million annually from 2017 onwards, primarily generated through more efficient production and lower logistics costs.
Fit for 2018: company-wide transformation program initiated
Medium-term net cost savings targets for Group and divisions established
35Merck 2012Group Management Report
Merck at a glance

Merck has a very high free cash flow yield and is improving its capital deployment. In the context of its first company-wide efficiency program, cash is being reserved with high priority to fund restructuring measures across all divisions and regions. Around € 800 million of one-time costs related to restructuring are planned to be incurred from 2012 to 2015. Secondly, Merck aims to maintain a healthy balance sheet. The debt incurred in connection with the acquisition of Millipore in 2010 is being repaid as soon as the tranches reach maturity. In 2012 € 1 billion was used to repay maturing bonds. Thirdly, to provide for future growth cash is used for selective bolt-on acquisitions especially in the life science area (Merck Millipore) and product in-licensing (Merck Serono). Merck is not planning to make any transfor mational acquisitions as long as the majority of the restructuring initiatives have not been implemented.
Lastly, Merck uses its cash to pay a dividend to its shareholders. For the coming years, Merck is aiming to distribute – based on current economic and business assumptions and subject to the approval of the Annual General Meeting – a dividend that is at least stable in absolute amounts compared to the dividend paid for the year 2011.
Dividend per share
€0
2012
2011
2010
2009
2008
0
1.70
1.50
1.25
1.00
1.50
Current capital allocation strategy is focused on restruc-turing measures, debt reduction, in-licensing deals, smaller acquisi-tions and dividends
36 Merck 2012Group Management Report
Merck at a glance

Our corporate culture has always been characterized by responsible behavior – whether with respect to our products, our employees, the environment, or society. That is because not only ownership, but also business success creates responsibility.
Firmly establishing responsible behavior throughout the company is one of the basic principles of company management at Merck. In order to sustainably implement these principles, a Corporate Responsibility committee discusses relevant overarching issues. This committee includes representatives from the individual divisions and Group functions such as Environment, Health, Safety, Security, Quality, as well as Communications, Humans Resources and Legal.
Against the background of the UN‘s endorsement of the Guiding Principles for Business and Human Rights and their integration into the principles of the Organization for Economic Co-operation and Devel-opment (OECD) for multinational companies, Merck conducted a Group-wide analysis in order to ascertain the subsequent new requirements not covered by existing guidelines and directives.
In 2012, Merck continued to be a member of the FTSE4Good Index, a leading international stock index for sustainable investment. Companies are included in this index based on criteria such as effective environmental protection as well as adherence to and support of human rights principles. As in 2011, Merck continued to be included in the sustainability index of Deutsche Börse.
Corporate responsibility activities and key issues are selected on the basis of materiality analyses. These activities and issues are described on the following pages as well as in our extensive Corporate Responsibility Report, which we publish regularly. Merck conducts these materiality analyses at regular intervals in order to identify and prioritize the sustainability topics that are most important to the company. The analysis took into account the perspectives of various stakeholder groups, including, for instance, employees, business associates, site neighbors, and investors.
Employees
As of December 31, 2012, our company had 38,847 employees (2011: 40,676 employees). Merck was represented in 66 countries by 203 companies and had 65 production sites located in 22 countries.
The “Fit for 2018” efficiency program significantly impacted HR work in 2012. In order to implement the necessary personnel reduction measures in a socially responsible manner, the structural prerequisites and rules were set up with the respective management and labor representatives in the majority of countries in which Merck operates. In Germany, for example, a partial retirement program and a voluntary leaver program were offered. As of the reporting date, around 1,200 employees had enrolled in these programs. Overall, the number of employees decreased by 1,829 compared to 2011.
Management and labor representatives agree on efficiency program
Corporate Responsibility
37Merck 2012Group Management Report

Merck remains committed to the vocational and advanced training of its employees. Consequently, Merck has maintained a constant level of vocational training in Darmstadt, the largest site of the Merck Group. A total of 528 young people were enrolled in vocational training programs in 23 different occupations there.
Number of employees as of December 31, 2012 / percentage of total workforce
2
3
4
1
1 Europe 20,777 54%2 North America 4,848 12%3 Emerging Markets 11,642 30%4 Rest of World 1,580 4% Total 38,847 100%
Core topics of our international human resources work
Merck has increasingly been positioning itself as a global company. In order to prepare the company for the resulting new challenges in international personnel management, Human Resources also positioned itself globally in 2012. Global structures were created and uniform principles were implemented in order to establish a global HR organization. All global HR processes applied to date, such as the Global Rewards Policy, the Performance Management Process as well as Talent & Succession Management, were further developed in order to promote a performance-oriented mindset and to strengthen the corporate culture based on the Merck Values. In this connection, measures were also taken to enhance the company’s attractiveness to internal and external talent, which has positively impacted the image of Merck as an employer. This was confirmed by employer ranking lists, such as the “Universum” employer ranking for scientists, in which Merck scored higher in 2012 than in 2011.
Merck is using the motto “Make great things happen” to position itself in the global job market. This communicates to potential applicants what makes Merck unique: an inspiring, motivating work environment in which innovations thrive; an environment in which everyone has the opportunity to apply their ideas and commitment to benefit customers and the company, while at the same time developing themselves further.
Performance management and career opportunitiesAssessing the performance of employees is crucial to Merck’s success and employee development. Key features here are clear objectives, differentiated and open feedback on performance, as well as the prepa-ration of individual development plans. To date, around 23,800 employees have participated in the globally uniform Performance Management Process.
Further development of global HR processes
38 Merck 2012Group Management Report
Corporate Responsibility

Identifying employee potential is directly related to performance management. Merck wants to offer its talent the opportunity to have an interesting career and to continually develop themselves within the company both personally and professionally. Therefore, in 2012, a new, integrated performance and talent process was developed that systematically combines performance management and the identification of potential. This will create a stronger performance culture and enable more targeted talent development. On this basis, internal appointments to vacant (management) positions can be steered and implemented better. In addition, the new process will help to retain talented employees and to position Merck as an attractive employer for potential new employees.
In 2012, 88% of management position vacancies were filled by internal candidates. Some key positions in the organization were also filled by external executives in order to add new perspectives to the long-standing experience existing in-house.
Global Rewards PolicyThe Global Rewards Policy applies to all Merck companies worldwide and ensures a systematic compensation structure. The guidelines describe the principles governing how employees are remunerated based on their performance, abilities, the situation in the respective labor market, and the specific requirements of the respective businesses. Existing remuneration systems, especially as they relate to variable compensation, are continuously further developed in order to take into account the changing needs of our global businesses.
Occupational health and safetyWe apply the lost time injury rate (LTIR) as an indicator to determine the success of measures aimed at accident prevention as well as occupational health and safety. This internationally recognized key figure describes the number of workplace accidents resulting in lost time per one million working hours. Merck had set itself the goal of reducing the LTIR to 2.5 by 2015. In 2012, we again outperformed this goal, achieving an LTIR of 2.3.
The success of our BeSafe! initiative launched in 2010 encourages us to continue this program and to further strengthen our safety culture. The program has a globally uniform structure, but also consists of local programs to meet the specific requirements of the individual sites. BeSafe! focuses on anchoring the safety culture as a management task and on empowering our employees to take independent responsibility.
Incidents
2008 2009 2010 2011 2012
LTIR (Lost Time Injury Rate) 3.9 3.5 3.0 2.0 2.3Number of fatalities 1 0 1 0 0
Strengthening the performance culture and developing talent in a more targeted way
39Merck 2012Group Management Report
Corporate Responsibility

Employee diversity
As a global company, Merck endeavors to achieve a good balance between different cultures and nationalities, between different age groups, as well as between male and female employees. We are convinced that workforce diversity promotes innovation and team performance, contributing to the company’s entrepre-neurial success. In order to sustainably anchor this diversity, we want to further develop existing measures.
Ratio of men and womenWomen currently make up 42% of the workforce. The ratio of female to male employees varies among individual business areas, functions and regions. In Pharmaceuticals 46%, in Group functions 42%, and in Chemicals 37% of all employees are female. In North America, 46% of all employees are female, in Europe 45%, in Emerging Markets 37%, and in Rest of World likewise 37%. Women make up 51% of the workforce in research and development, which is the highest percentage, followed by 50% in administration. The lowest percentages of women are in production (34%) and the infrastructure units (30%). Merck has set itself the goal of increasing the percentage of female employees wherever they are underrepresented.
Internationality72% of the Merck workforce is employed outside of Germany; 26% of all employees are German citizens. One of our basic principles is to hire and develop employees from the countries in which we operate.
Age structureDemographic change, and the associated aging of the population, is not equally apparent in all countries in which we operate. However, we must adapt to it, particularly in Germany, in some other EU countries, and in the United States. In these countries, the average age of our employees exceeds 40 – and we assume that this figure will increase further. In Europe, we are using various programs to address these demographic challenges. These include adapting workplaces to the needs of older employees and establishing a health management program to maintain their ability to perform their jobs.
Management positionsBalanced diversity among executive staff enhances career advancement opportunities for talented employees. At the same time, it also enables the company to leverage a broad base of experience and allows for more differentiated entrepreneurial decision-making.
The percentage of women in management positions, meaning Global Grade 14 and higher, is currently 24% calculated across the entire company. The percentage is higher at the legal entities in the countries than at corporate headquarters in Darmstadt; it is also higher in Pharmaceuticals than in Chemicals. The ratio of women in management positions is lower in certain Group functions, such as IT for example. We set ourselves a global objective of increasing the percentage of women in management positions to 25% to
Increasing the percentage of female employees where they are underrepresented
40 Merck 2012Group Management Report
Corporate Responsibility

30% by 2016. In order to attain this goal, various HR measures and global management training programs are used to address this topic and raise awareness among executive staff. Internal and external recruitment staff have been set the goal of focusing more on diversity when selecting candidates. Greater importance is also being given to the topic when identifying talented employees as well. In addition, local measures and offers are being expanded in order to support work-life balance.
61% of all management positions (Global Grade 14 and higher) are held by persons of non-German nationality – altogether 57 different nationalities are represented in such positions. The internationality of our management levels reflects the global nature of our business activities.
Responsibility for products and the environment
The safety of our products – for users and patients as well as the environment – is at the core of our corporate responsibility. Our product safety guidelines are oriented to statutory regulations in force around the world. Through voluntary commitments to charters and codes of practice formulated by the national and international associations of the chemical and pharmaceutical industries, we exceed these requirements. Examples include the global Responsible Care Charter in the chemical industry as well as rules governing pharmaceutical marketing practices specified by pharmaceutical industry associations. Our aim is to offer customers and patients high-quality original products.
When developing new products, we take the sustainability aspects of their entire life cycle into account. Extensive documentation of product properties and compliance with all legal requirements have a high priority for us.
We actively support our customers, for example, by providing them with comprehensive information material as well as advanced application-related training. We benefit from our broad positioning and our very extensive product range as well as a correspondingly high level of expertise.
Our quality vision points in the same direction – “Quality is in everything we do!” This vision addresses the responsibility of all employees individually – in all divisions, in all Group functions and at all levels of the hierarchy. In our view, quality has a lot to do with the trust that our customers have been placing in us for centuries.
REACH: Phase 2 is progressing according to scheduleThe implementation of the EU regulation REACH (Registration, Evaluation, Authorisation and Restriction of Chemicals) is currently in the second phase. It concerns all substances that we produce or import in volumes ranging between 100 and 1,000 metric tons per year – totaling approximately 75 different substances. These substances must be completely registered with the European Chemicals Agency (ECHA) by June 1, 2013. We have begun all the necessary processes for this and are fully on schedule with our activities. In parallel, we have already started to register the first substances for Phase 3, which will run from 2013 to 2018 and comprises all substances produced or imported in volumes exceeding one metric ton per year.
Internationality of management levels
Voluntary commitments exceed the statutory requirements
41Merck 2012Group Management Report
Corporate Responsibility

Merck Bioethics Advisory PanelThe Merck Bioethics Advisory Panel, comprising renowned, independent scientists and bioethicists from various countries, convened again in 2012. The panel specifically addresses bioethical topics that arise at Merck, such as questions regarding biopharmaceuticals or stem cells. In extensive discussions and working groups, the experts focused on aspects such as clinical trial design in developing countries as well as clinical research in countries with limited resources.
Access to Medicine Index: Improved rankingMerck ranks eighth in the current Access to Medicine Index published by the Access to Medicine Foundation in November 2012. Compared to 2010, Merck thus improved its ranking by nine places. The Index compares 20 pharmaceutical companies every two years based on a ranking of various activities focused on improving access to medicines in countries with low and middle incomes.
We aim to create the conditions for sustainable access to high-quality, safe medicines and health solutions in developing countries. In order to further the goal of making our health solutions accessible and affordable to patients in developing countries, Merck has further expanded its Access to Health initiative. This constitutes a framework spanning all divisions and functions of the company, helping us to more effectively address issues relating to access to medicines in developing countries.
Fight against counterfeit products: MACON NetworkMerck is resolute in its fight against counterfeit products. Counterfeit medicines endanger the life and health of patients. Furthermore, counterfeit medicines that are illegally marketed under the Merck brand name also damage the good reputation of Merck products. In order to fight this particularly unscrupulous form of organized crime, various departments within Merck and all subsidiaries abroad are cooperating in MACON (Merck Anti-Counterfeiting Operational Network). Contacts to local, regional and international authorities are actively maintained, training courses for employees and agency staff are conducted, and resources are made available for forensic product analyses. Merck is also actively involved in issues concerning the anticounter-feiting protection of its packaging and offers innovative solutions that meet market needs.
Environmental protection expenditureExpenditure on environmental protection, health and safety totaled € 146 million in 2012. This figure includes investments made during the reporting period.
EHS management system and ISO group certificateThe Corporate EHS Policy defines our principles and strategies for the environment, health and safety. It is implemented through internal guidelines and instructions for compliant behavior, such as the Merck Group EHS, Security and Quality Manual.
Since our businesses are constantly changing, our environmental management system must also remain flexible and adaptable. For this reason, internal and external audits are conducted on a regular basis to determine whether the ISO 14001 requirements are still being met. In the course of the annual surveillance, the ISO 14001 group certificate was confirmed for our environmental management system for 2012 as well.
Improving access to medicines in developing countries
42 Merck 2012Group Management Report
Corporate Responsibility

Energy
2008 2009 2010 2011 2012
Energy consumption (in GWh) 1,435.0 1,322.1 1,454.7 1,445.6 1,437.8Purchased energyNatural gas (in million m³) 77.8 71.9 77.3 76.2 78.2Liquid fossil fuels (in kilotons) 7.8 5.6 7.9 7.9 7.4Electricity (in GWh) 504.2 468.0 508.8 507.0 487.6Portfolio-adjusted in accordance with the Greenhouse Gas Protocol
CO2eq emissions (eq=equivalents)
Emissions in kilotons 2008 2009 2010 2011 2012
Direct CO2eq emissions 303 302 352 318 319Indirect CO2eq emissions 210 187 204 203 197Total CO2eq emissions 513 489 556 521 516Portfolio-adjusted in accordance with the Greenhouse Gas Protocol
Air emissions
Emissions in kilotons 2008 2009 2010 2011 2012
Nitric oxides 0.2 0.1 0.2 0.1 0.2Sulfur dioxide 0.05 0.03 0.03 0.02 0.02Dust 0.02 0.02 0.02 0.03 0.03VOC (volatile organic compounds) 1.9 0.2 0.2 0.2 0.2Not portfolio-adjusted
EDISON: 200 climate protection projectsMerck aims to continually improve its performance while using energy, water and materials economically and efficiently. The objective is to reduce the impact on the environment as well as to achieve cost savings. The current focus is on climate protection: By 2020, Merck aims to reduce its total direct and indirect greenhouse gas emissions by 20% – measured against 2006 levels.
43Merck 2012Group Management Report
Corporate Responsibility
In order to achieve its climate goals, Merck launched a climate protection program called EDISON. This initiative pools all Merck Group activities worldwide that are aimed at climate protection and energy efficiency. In 2013, as in 2012, the Executive Board will additionally earmark around € 10 million for measures to conserve energy and reduce greenhouse gas emissions. With the EDISON program, which consists of around 200 individual projects, Merck aims to save around 64 kt of CO2 equivalents per year in the medium term. Around one-third of these globally planned projects have already been implemented or are ongoing, including also major projects on energy generation and heat recovery.
New power plants under constructionA new power plant is being constructed in Goa, India, for example, which will use climate-neutral biomass as fuel to supply the site with electricity and steam. Another EDISON project is the combined heat and power plant at the Gernsheim site in Germany that is currently under construction. This uses a high-efficiency gas turbine-driven co-generation system to produce electricity, while almost completely preventing the loss of unused heat.
Energy management plays an important role in sustainable energy efficiency and climate protection. In 2012, the two Merck production sites of Darmstadt and Gernsheim, which account for around 40% of the global energy consumption at Merck, were certified to the ISO 50001 standard for energy management systems.
Carbon Performance Leadership Index: Rating improvedThe Carbon Disclosure Project is an independent non-profit organization that aims to improve transparency with respect to climate-harming greenhouse gas emissions. In the related Carbon Performance Leadership Index, which measures corporate performance in reducing emissions, we improved our rating from C to B, which clearly places us in a high performance band among all companies included in the category for Germany, Austria and Switzerland. Around 350 companies are rated for their performance in reducing emissions. Only nine of them received a rating of A or A-, and 29 a rating of B.
Green³ conceptWith its Green³ concept, the Liquid Crystals business unit is playing a key role in helping to promote eco-friendly, economical, safe technologies. We are developing innovative, environmentally friendly materials for energy-efficient LC and OLED displays and are helping our customers to design ecological production processes. The Green³ concept was expanded to also include cosmetics products from our Performance Materials division. The concept evaluates all possibilities for sustainably procuring and producing cosmetic ingredients and for optimizing the related production processes. In dialogue with our customers from the cosmetics industry, we also develop proposals for cosmetic formulations that meet the strict sustainability criteria and are in line with the current trend toward more natural cosmetics.
Life cycle analyses for selected productsProduct life cycle analyses (also called eco-balance sheets or life cycle assessments) are used to determine the impact that products have on the environment. A product carbon footprint, for example, quantifies the total amount of greenhouse gas emissions that a product causes throughout its entire life cycle. A product water footprint is an indicator of the total water used throughout a product‘s life cycle.
Highly efficient combined heat and power plant
44 Merck 2012Group Management Report
Corporate Responsibility

In view of the growing importance of the topic, our Performance Materials division has determined the product carbon footprint for liquid crystal mixtures and pearl effect pigments as well as the product water footprint for liquid crystal mixtures. Here we are pursuing a cradle-to-gate approach, meaning from raw material sourcing and production through to delivery to customers. In addition, the Merck Millipore division is working intensively on this topic and has carried out a number of life cycle analyses and comparative product studies. Merck Millipore is also using these to further reduce the environmental impact of products as part of its Design for Sustainability program.
Responsibility for society
Our social commitment comprises local and regional charitable projects that the Merck subsidiaries imple-ment independently as part of the existing Corporate Responsibility concept, as well as global projects. The latter include the Merck Praziquantel Donation Program, the Global Pharma Health Fund (GPHF) and the Deutsche Philharmonie Merck.
Merck Praziquantel Donation Program: Combating the tropical disease schistosomiasisIn 2007, we entered into a partnership with the World Health Organization (WHO) to combat the worm dis-ease schistosomiasis in African school children. As part of this collaboration, Merck is donating Cesol ® 600 tablets containing the active ingredient praziquantel. Schistosomiasis is the most common tropical disease in Africa after malaria, causing primarily children to suffer. Since the partnership began, more than 28 million children have been treated in 11 African countries.
We have made a commitment to WHO to continue donating Cesol ® 600 until the disease has been eliminated in Africa and will increase our drug donation ten-fold in the medium term. Apart from this, we are also supporting an awareness program in African schools to educate pupils about the causes of schistosomiasis and ways to prevent the disease. Furthermore, we entered into a public-private partner-ship with TI Pharma, Astellas Pharma Inc. and the Swiss Tropical and Public Health Institute in July 2012 in order to develop a pediatric formulation of praziquantel for preschool children. At the present time, infants and small children who are infected with schistosomiasis cannot be adequately treated since the standard therapy is available only as tablets for adults and children as of the age of six.
Global Pharma Health Fund: Protection from counterfeit medicinesThe Global Pharma Health Fund (GPHF), which is exclusively funded by Merck, is combating counterfeit medicines in developing and emerging countries. According to estimates by the International Criminal Police Organization (Interpol), between 10% and 30% of the medicines offered worldwide are either counterfeit or of inferior quality. Many African and Asian countries are especially affected by this since they lack effective regulatory and enforcement systems for medicines. In order to identify counterfeits and quickly remove them from circulation, more than 570 compact mobile laboratories, or GPHF-Minilabs, were in use in more than 80 countries at the end of 2012. These Minilabs make it possible to rapidly identify 58 different drug active ingredients and to immediately detect inferior or ineffective medicines.
Deutsche Philharmonie Merck: Cultural promotionThe Deutsche Philharmonie Merck is one example of how we promote culture. With up to 80 professional musicians and a very diverse concert repertoire, this orchestra is not only an integral part of the cultural life in the vicinity of our corporate headquarters in Darmstadt – it also tours internationally.
Program to fight schistosomiasis expanded
45Merck 2012Group Management Report
Corporate Responsibility

2/5
I
Merck Shares
110 €
Jan. Feb. March April May June July Aug. Sept. Oct. Nov. Dec.
100 €
90 €
80 €
70 €
The performance of Merck shares vs. the DAX ®, the Bloomberg Europe 500 Pharmaceuticals Index (BEPHARM) and the Bloomberg EMEA Chemicals Index (BEUCHEM) – 2012
Merck DAX ® BEPHARM Index BEUCHEM Index
During 2012, the Merck share price rose 30%. Thus, Merck outperformed the DAX ® by 1% and the relevant pharmaceutical and chemistry industry indices by 13% and 19%, respec-tively. Reaching an annual high of € 106.55 in December 2012, the price neared the all-time high of € 109.26 in September 2007.
The average daily trading volume decreased by 38% from just under 500,000 in 2011 to just over 300,000 shares. The North America region continued to dominate with more than 50% of shares in free float, slightly down compared to 54% in 2011. By investor type, GARP (growth at reasonable price) investors continue to dominate. Together, the top five investors held around 30% of the free float at year-end.
At a glance
46 Merck 2012Group Management Report

2/5
I
Share data 1
2012 2011
Dividend / in € 1.70 1.50Share price high / in € 106.55 78.47Share price low / in € 72.37 56.82Year-end share price / in € 99.83 77.03Daily average number of Merck shares traded 2 / in units 310,601 498,784Market capitalization 3 (at year-end) / in € million 21,702 16,745Market value of authorized shares 4 (at year-end) / in € million 6,451 4,9781 Share-price relevant figures relate to the closing price in XETRA ® trading on the Frankfurt Stock Exchange2 Based on the floor trading systems of all German exchanges and the regulated market on XETRA ®
3 Based on the theoretical number of shares (217.4 million)4 Based on the number of shares in free float (64.6 million)Source: Bloomberg
Identified investors by region 20121
2
3
4
65
1
1 United States 51%2 United Kingdom 21%3 Germany 10%4 France 3%5 Rest of Europe 11%6 Rest of World 4%
1 represents 85% of free float Source: King Worldwide (as of December 2012)
Identified investors by type 20121
2
3
4
5
11 GARP (Growth at reasonable price) 34%2 Value 31%3 Growth 13%4 Index 12%5 Other 10%
1 represents 85% of free float Source: King Worldwide (as of December 2012)
47Merck 2012Group Management Report
2012 was significantly marked by the euro crisis, which led to a recession in a number of eurozone countries. The U.S. economy grew, albeit at a lower rate than expected one year ago. As in 2011, growth impetus for the global economy mainly came from emerging economies and developing countries, whereby the dynamism slowed down here as well.
According to the International Monetary Fund (IMF), global gross domestic (GDP) increased by 3.3% in 2012. While the industrialized countries generated an increase of only 1.3%, the GDP of emerging econo-mies and developing countries grew by 5.3%. The GDP of the United States, the world’s largest economy, grew by 2.2% in 2012. For the eurozone, the International Monetary Fund noted a decline in gross domestic product of 0.4%. Merck operates in the pharmaceutical, chemical and life science sectors.
Pharmaceutical marketIMS Health, a provider of market analyses for the health care industry, points to an increase in sales in the prescription drugs segment of between 3% and 4% in 2012, the lowest market growth in years. The increase corresponds to global growth of US$ 30 billion worldwide to a market volume of nearly US$ 1 trillion in 2012.
The market for patented, prescription drugs (excluding generics), which is crucial to research-based pharmaceutical companies, declined. According to Evaluate Pharma, a further pharmaceutical market research firm, this market achieved a global market volume of US$ 709 billion, corresponding to a decline of 0.9% compared to 2011. According to a survey by this institute, R&D spending in 2012 by the global pharmaceutical and biotech industry was well over US$ 134 billion, which represents a decline of 0.3% compared to 2011.
The market researchers from Nicholas Hall reported a 4.2% increase in the global market for over-the-counter drugs to a volume of € 88 billion. In terms of market share, Europe dominates, followed by Asia (excluding Japan) and North America.
Chemical marketIn 2012, the dynamism of the chemical business abated worldwide; chemical industry output even declined in the European Union. According to data from various chemical industry associations (American Chemistry Council (ACC) / European Chemical Industry Council (CEFIC) global chemical production output grew by only 2% in 2012 after increasing by nearly 5% in 2011.
According to the German Chemical Industry Association (VCI), production in the German chemical industry declined by 3%. The debt crisis in Europe was the reason stated for this decline. CEFIC therefore also lowered its forecast for 2012. Chemical sales in Germany remained constant at € 184 billion.
Life science marketSubsequent to the acquisition of Millipore in 2010, Merck is well-positioned in the global life science market. The life science sector also includes laboratory products and services as well as products for research and pharmaceutical and biotech industry production offered by Merck Millipore.
The market for Merck products represents a segment accounting for a volume of around € 20 billion within the worldwide life science market, which has an estimated market volume of € 50 billion (Source: Bank of America). The markets in which Merck operates show growth rates of more than 5%.
Subdued growth in the pharmaceutical market
Overall Economic Situation
48 Merck 2012Group Management Report

Financial Position and Results of Operations
Highlights 2012
Sales grow to exceed the € 10 billion for the first time driven by solid organic growth rates of the three largest divisions as well as changes from foreign exchange rates Strong operational performance while substantially advancing with the transformation of the company Good profitability and strong working capital management lead to increased free cash flow Merck Serono generates solid top and bottom-line results while implementing major restructuring programs and efficiency initiatives across global administrative functions, R&D operations and country organizations Performance Materials delivers exceptional performance driven by liquid crystal materials, while the Pigments business remains sluggish Sales growth of Merck Millipore driven by all business units, predominantly through biotech manufacturing products in Process Solutions Net financial debt significantly lowered to below € 2 billion Proposal to increase dividend by 13% to € 1.70 demonstrates the current and future strength of the underlying business
Merck Group | Key figures
€ million 2012 2011Change
in %
Total revenues 11,172.9 10,276.4 8.7Sales 10,740.8 9,905.9 8.4Operating result (EBIT) 963.6 1,132.1 –14.9
Margin (% of sales) 9.0 11.4 –EBITDA 2,360.2 2,730.9 –13.6
Margin (% of sales) 22.0 27.6 –EBITDA pre one-time items 2,964.9 2,723.8 8.9
Margin (% of sales) 27.6 27.5 –EPS pre one-time items (in €) 7.61 6.79 12.1Free cash flow 2,039.9 1,436.4 42.0
49Merck 2012Group Management Report

In 2012, Merck delivered a strong business performance while significantly transforming the company. Total revenues of the Merck Group rose 8.7% to € 11,173 million (2011: € 10,276 million). This increase reflects 4.8% organic growth, a 3.6% benefit from changes in foreign exchange rates, and a 0.3% effect from acquisitions. At € 432 million (2011: € 370 million), royalty, license and commission income, which is disclosed as part of total revenues, was € 62 million higher than in 2011. This was primarily due to higher royalty income related to Humira ® and the stronger U.S. dollar.
Sales grew by 8.4% to € 10,741 million (2011: € 9,906 million) reflecting a 4.5% organic increase, 3.6% growth based on changes in foreign exchange rates and 0.3% growth due to acquisitions. On an absolute basis, Merck Serono was the strongest contributor to organic sales growth followed by Merck Millipore and Performance Materials.
Merck Group | Sales by region – 2012
€ million / in %
3
1
2
41 Europe 3,943 37%2 North America 2,128 20%3 Emerging Markets 3,712 34%4 Rest of World 958 9%
From a regional perspective, North America generated low double-digit organic sales growth, expanding its contribution to 20% of Group sales (2011: 18%). This resulted from strong organic sales growth of the Merck Serono prescription medicines portfolio, particularly the MS treatment Rebif ® and to a smaller extent recovering sales of Pigments & Cosmetics products in the Performance Materials division. The Emerging Markets region, consisting of Latin America and Asia (excluding Japan), also slightly increased its share of sales to 35% (2011: 33%). The region grew organically by a high single-digit rate to which all four divisions contributed. Europe reported a 1.6% decline in organic sales triggered by flat to declining organic sales in all divisions except for Merck Millipore. Accordingly, Europe’s contribution to Group sales decreased to 37% in 2012, representing a continuous decline from 46% three years ago. This development is primarily due to the Millipore acquisition which included a strong U.S. franchise, a revised U.S. marketing and pricing strategy of Merck Serono as well as softening economic conditions and pricing pressures in the eurozone. Sales in the Rest of World region, which comprises Japan, Africa, and Australia/Oceania, increased by 9.6%, generating an unchanged 9% of Group sales.
Sales growth driven by organic growth and foreign exchange rates
North America and Emerging Markets expand their share of total sales
50 Merck 2012Group Management Report
Financial position and results of operations

Merck Group | Sales growth components by region – 2012
€ million / change in % SalesOrganic growth
Exchange rate effects
Acquisitions/ divestments
Reported sales growth
Europe 3,942.7 –1.6 0.5 0.6 –0.4North America 2,128.3 10.3 8.3 0.3 19.0Emerging Markets 3,712.2 8.8 4.3 – 13.0Rest of World 957.6 3.5 5.7 0.3 9.6World in total 10,740.8 4.5 3.6 0.3 8.4
Gross profit increased by 7.0% to € 8,015 million (2011: € 7,491 million), or 74.6% as a percentage of sales (2011: 75.6%). Higher start-up costs for Merck Serono’s Large-Scale-Biotech (LSB) manufacturing site in Vevey (Switzerland) as well as idle costs in production and selected factory shut-downs as a result of initiatives to lower inventories in the Performance Materials and Merck Millipore divisions lowered the gross margin compared to 2011.
Group marketing and selling expenses increased moderately by 1.1% to € 2,411 million (2011: € 2,386 million) but at a significantly lower growth rate than sales, reflecting the first results of the ongoing restructuring initiatives and indicating more focused discretionary spending. Through this, the ratio of marketing and selling expenses to total sales declined from 24.1% to 22.4%.
Royalty, license and commission expenses increased by 15.8% to € 580 million (2011: € 500 million), reflecting the strong performance of Rebif ® as well as changes in foreign exchange rates, most notably the U.S. dollar.
Administration expenses rose by 3.1% to € 552 million (2011: € 536 million). This increase was primarily due to the fact that Merck Millipore is headquartered in the United States and the related translation effect stemming from the U.S. dollar. In addition, administration expenses in Corporate and Other increased due to higher bonus accruals.
Other operating income and expenses amounted to € –1,127 million (2011: € –417 million). Of this amount, € –664 million was classified as one-time items. Within the scope of its “Fit for 2018” efficiency program, the Group incurred € 504 million in restructuring costs (excluding impairments), incurred mainly in the Merck Serono division. In relation to in prior years discontinued businesses, reported under Corporate and Other, follow-up expenses of € 60 million were booked in 2012, in contrast to the previous year, when Merck reported a gain of € 152 which included the proceeds from the sale of the CropBioscience business. During 2012, impairments of € 59 million were classified as one-time items, with the majority related to site closures as a consequence of the restructuring. In 2011, asset impairments of € 332 million were recognized, including € 165 million for the LSB manufacturing site in Vevey.
At € 1,511 million, R&D spending remained roughly at last year’s level (2011: € 1,514 million). At 14.1%, the ratio of R&D expenses to total sales fell around one percentage point compared to 2011. Lower R&D expenses in the Merck Serono and Consumer Health divisions more than offset higher investments by Merck Millipore and Performance Materials.
Marketing and selling expenses grow less than sales, demonstrating first efficiency gains
Restructuring costs related to “Fit for 2018” lead to significant increase in other operating expenses
Stable R&D spending
51Merck 2012Group Management Report
Financial position and results of operations
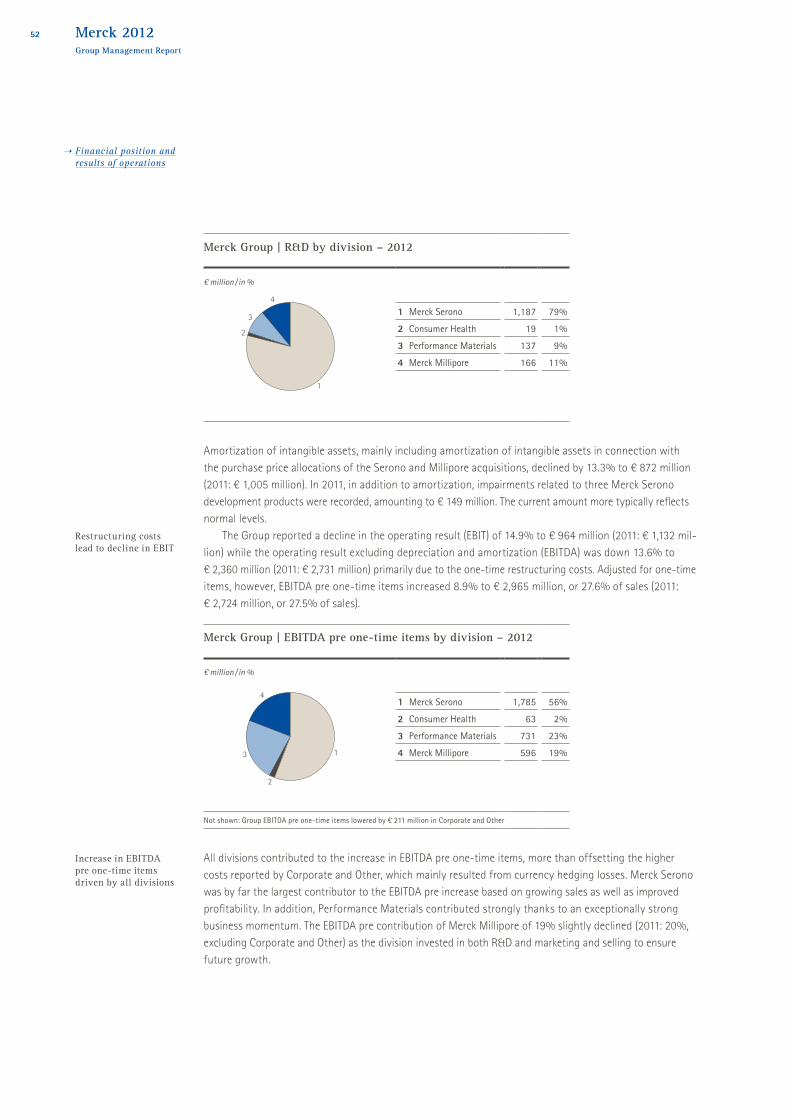
Merck Group | R&D by division – 2012
€ million / in %
3
1
2
41 Merck Serono 1,187 79%2 Consumer Health 19 1%3 Performance Materials 137 9%4 Merck Millipore 166 11%
Amortization of intangible assets, mainly including amortization of intangible assets in connection with the purchase price allocations of the Serono and Millipore acquisitions, declined by 13.3% to € 872 million (2011: € 1,005 million). In 2011, in addition to amortization, impairments related to three Merck Serono development products were recorded, amounting to € 149 million. The current amount more typically reflects normal levels.
The Group reported a decline in the operating result (EBIT) of 14.9% to € 964 million (2011: € 1,132 mil-lion) while the operating result excluding depreciation and amortization (EBITDA) was down 13.6% to € 2,360 million (2011: € 2,731 million) primarily due to the one-time restructuring costs. Adjusted for one-time items, however, EBITDA pre one-time items increased 8.9% to € 2,965 million, or 27.6% of sales (2011: € 2,724 million, or 27.5% of sales).
Merck Group | EBITDA pre one-time items by division – 2012
€ million / in %
3 1
2
41 Merck Serono 1,785 56%2 Consumer Health 63 2%3 Performance Materials 731 23%4 Merck Millipore 596 19%
Not shown: Group EBITDA pre one-time items lowered by € 211 million in Corporate and Other
All divisions contributed to the increase in EBITDA pre one-time items, more than offsetting the higher costs reported by Corporate and Other, which mainly resulted from currency hedging losses. Merck Serono was by far the largest contributor to the EBITDA pre increase based on growing sales as well as improved profitability. In addition, Performance Materials contributed strongly thanks to an exceptionally strong business momentum. The EBITDA pre contribution of Merck Millipore of 19% slightly declined (2011: 20%, excluding Corporate and Other) as the division invested in both R&D and marketing and selling to ensure future growth.
Restructuring costs lead to decline in EBIT
Increase in EBITDA pre one-time items driven by all divisions
52 Merck 2012Group Management Report
Financial position and results of operations

During 2012, the Group already realized around € 115 million in net savings as a result of the restructuring. The majority of savings were achieved in Merck Serono followed by Consumer Health, which delivered substantial savings relative to its size. Two-thirds of the restructuring costs incurred were reported in the Merck Serono division. The restructuring costs booked in Corporate and Other mainly related to several divisions at the same time and cannot be directly allocated.
The Group’s financial result improved by 13.2% to € –255 million (2011: –293 million). Lower interest expenses on debt following the repayment of € 500 million worth of bonds in March 2012 (followed by another € 500 million repaid in December 2012) as well as lower interest expenses on pension provisions more than offset reduced interest income due to low interest rate yields. In addition, gains related to the fair value of foreign exchange options benefited the financial result. Merck began using foreign exchange options as hedging instruments in the fourth quarter of 2011 and books fluctuations of corresponding fair values under the financial result. As a consequence, this line may continue to be impacted by the volatility of foreign exchange rates.
Income tax amounted to € –130 million (2011: € –221 million). One-time items substantially distorted the reported income tax ratio in 2012. The adjusted income tax ratio of 25.5% continues to be at the mid-point of the company’s underlying tax ratio of 25% to 26%.
Profit after tax amounted to € 579 million (2011: € 618 million), a decrease of 6.3% mainly due to the one-time items which were incurred in 2012. One-time items (including impairments) of € 664 million also weighed on reported net income (profit after tax attributable to Merck KGaA shareholders) of € 567 million (2011: € 607 million) or earnings per share (EPS) of € 2.61 (2011: € 2.79). However, adjusted for one-time items, EPS pre one-time items (EPS adjusted by net of tax effect of one-time items and amortization of purchased intangible assets) increased 12.1% to € 7.61 (2011: € 6.79).
We will propose to the Annual General Meeting on April 26, 2013 to raise the dividend from € 1.50 to € 1.70 per share.
Merck got off to a moderate start in 2012 since in the first quarter the Performance Materials division faced a difficult year-on-year comparison. In the first quarter of 2011, this division generated organic sales growth of 15% due to unusually high customer demand for its liquid crystal materials. Group organic sales growth in the first quarter of 2012 was entirely driven by Merck Serono and Merck Millipore. During the following quarters of 2012, Group sales grew consistently between 5% and 6% organically compared to the year-ago-quarter due to healthy demand in the Merck Serono, Performance Materials and Merck Millipore divisions. All regions contributed to growth with the exception of Europe, where organic sales declined between 1% and 2% each quarter compared to 2011 mainly due to weakening economic conditions.
As of the second quarter of 2012, Merck started to focus primarily on organizational changes and optimizing its cost structure across all businesses. While the full amount of savings will be realized during 2014, growth in EPS pre one-time items was already realized in 2012 based on improved top-line perfor-mance and tighter cost management.
Reduced financing costs mainly due to lower interest expenses on debt and pension provisions
Efficiency initiatives lead to good growth rates especially in the second half of 2012
53Merck 2012Group Management Report
Financial position and results of operations

Merck Group | Sales and organic growth by quarter 1
€ million / change in %0
Q1 1.2%
Q2 5.1%
Q3 5.9%
Q4 5.6%
0
1 Quarterly breakdown unaudited
2011 2012
2,4782,564
2,7432,470
2,4342,722
2,5252,712
Merck Group | EPS pre one-time items and growth by quarter 1
€ million / change in %0
Q1 –12.6%
Q2 20.0%
Q3 22.2%
Q4 23.5%
0
1 Quarterly breakdown unaudited
2011 2012
1.901.66
1.921.60
1.621.98
1.662.05
Total assets of the Merck Group amounted to € 21,643 million as of December 31, 2012 (December 31, 2011: € 22,122 million). This decrease was driven by the increased focus on working capital management and resulted in both lower trade accounts receivable and inventories. Non-current assets, mainly intangibles and property, plant and equipment, also decreased during the year.
Financial liabilities decreased during 2012 as bonds due for repayment totalling € 1 billion related to the 2010 acquisition of Millipore were repaid in March and December, respectively. On the other hand, provisions increased mainly as a result of the ongoing restructuring initiatives.
54 Merck 2012Group Management Report
Financial position and results of operations

Financial liabilities were reduced by a further € 1,086 million to € 4,453 million as of December 31, 2012 (December 31, 2011: € 5,539 million) primarily as a result of the aforementioned bond repayment. Net financial debt (financial liabilities minus cash and cash equivalents as well as short-term securities and financial assets) decreased to € 1,926 million as of December 31, 2012 (December 31, 2011: € 3,484 million). Moody’s, a corporate financial rating agency, upgraded Merck’s long-term issuer and senior unsecured ratings to ‘Baa1’ with stable outlook from ‘Baa2’ in December 2012, citing the substantial deleveraging underpinned by solid cash flow generation. Standard & Poor’s raised the long-term credit rating to ‘A-’ with stable outlook from ‘BBB+’ in November 2012, expecting significant free operating cash flow to increase gradually over the next few years, in line with increasing sales and profit margins on the back of the efficiency program. Both ratings ensure that Merck will be able to benefit from attractive financing terms in the future. The factor of net financial debt to net cash flow from operating activities lessened from 2.7x as of December 31, 2011 to below 1x as of December 31, 2012, driven by both the reduction of financial debt as well as a strong operating cash flow.
Merck Group | Working capital 1
million €
as of December 31,
2011
as of March 31,
2012
as of June 30,
2012
as of September 30,
2012
as of December 31,
2012
Change Dec 31, 2011 –
Dec 31, 2012
Trade accounts receivable 2,328.3 2,343.5 2,284.8 2,206.7 2,114.6Inventories 1,691.1 1,658.9 1,667.6 1,609.6 1,533.9Trade accounts payable –1,100.8 –1,112.8 –1,216.5 –1,297.9 –1,288.3Working capital 2,918.6 2,889.6 2,735.9 2,518.4 2,360.2 –19.1%
as % of sales (last 12 months) 29.5% 28.9% 26.7% 23.9% 22.0%1 Quarterly breakdown unaudited
The focus on improving working capital (trade accounts receivable plus inventories minus trade accounts payable) resulted in working capital declining to 22.0% (in % of sales) as of December 31, 2012 (29.5% as of December 31, 2011).
Investments in property, plant and equipment amounted to € 329 million in 2012 (2011: € 366 million). This included for example investments in the Merck Millipore GMP bioproduction facility in Martillac (France), which provides customers with access to single-use process technologies. Due to the 2012 focus on implementing efficiency and restructuring measures, investments in property, plant and equipment remained behind projections (€ 360 million to € 380 million).
The equity ratio was 48.1% as of December 31, 2012 (December 31, 2011: 47.4%).
Further reduction of net financial debt
Working capital declines
55Merck 2012Group Management Report
Financial position and results of operations

Merck’s strong operational performance in 2012 as well as effective working capital management gener-ated a record free cash flow of € 2,040 million (2011: € 1,436 million), up 42.0%.
Merck Group | Free cash flow
€ million 2012 2011 Change
Profit after tax 579.0 618.0 –39.0Depreciation / amortization / impairment losses / write-ups 1,396.6 1,597.4 –200.8Changes in working capital 525.6 –198.3 723.9Changes in provisions 378.6 –418.7 797.3Changes in other assets / liabilities –383.5 –150.0 –233.5Others 1 –24.1 –177.2 153.1Net cash flow from operating activities 2,472.2 1,271.2 1,201.0Investments in property, plant and equipment –329.1 –366.3 37.2Others 2 –103.2 531.5 –634.7Free cash flow 2,039.9 1,436.4 603.51 Neutralization of gain/loss on disposal of assets, other non-cash income and expenses2 Investments in intangible assets, acquisitions, investments in non-current financial assets, disposal of non-current assets, purchase/sale of marketable securities
EBITDA pre one-time items is the main profitability measure of ongoing operational performance used internally and externally. It excludes from the operating result depreciation and amortization in addition to one-time items largely related to restructuring measures. It allows for an understanding of the underlying operational performance of the Merck Group and the four divisions.
Merck Group | EBITDA pre one-time items and growth by quarter 1
€ million / change in %0
Q1 –8.3%
Q2 13.9%
Q3 15.6%
Q4 16.1%
0
1 Quarterly breakdown unaudited
2011 2012
736674
747655
653754
681790
Record level of free cash flow
56 Merck 2012Group Management Report
Financial position and results of operations

Apart from EBITDA pre, a new cash flow performance indicator was introduced in 2012 to be used as the second key indicator for internal target agreements and individual incentive plans. Broken down to the divisional level, it sums up EBITDA pre and main cash items such as investments in property, plant, equip-ment and software as well as changes in inventories and changes in trade accounts receivable, all of which are under full control of the individual businesses. Consequently, increases in inventory and trade accounts receivable have an adverse impact on individual incentive plans, while conversely decreases are positively incentivized. The introduction of this performance indicator has led to considerable improvements in cost awareness as well as reduced working capital requirements.
In February 2012, Merck announced its global efficiency program, which spans all regions and businesses. During the year, more than 100 individual initiatives were implemented in countries such as Spain, Italy, and the United Kingdom. For the German operations, which account for more than one-quarter of all Merck employees, an agreement was signed in September 2012 with the employee representatives aiming to eliminate around 1,100 of the 10,900 positions by the end of 2015. By making the reductions in a socially responsible manner, mainly through voluntary leaver and partial retirement programs across all divisions and functions, Merck will refrain from forced redundancies until the end of 2017, with the exception of possible site closures and transfers that are still being assessed. Further cost savings will be realized by a reduction in personnel costs as the result of a realignment of the compensation system. Merck plans to invest a total of at least € 250 million in Darmstadt and other sites within Germany during the next two years.
In conclusion, in 2012 total revenues grew to € 11,173 million, slightly exceeding the guidance of up to € 11 billion. Merck implemented its first Group-wide efficiency program and already realized first savings. EBITDA pre one-time items amounted to € 2,965 million, including around € 115 million in savings from the efficiency program. This was slightly above guidance of up to € 2.95 billion, including € 55 million in net savings. Merck generated record cash flow due to good profitability and strong working capital management. The Group was able to again reduce net financial debt, also evidenced by an improved credit rating (Baa1/A-).
The above tables as well as those in the divisional reviews may contain rounding differences.
Socially responsible job reductions and site closures being assessed
Solid business perfor-mance during a year of significant change
57Merck 2012Group Management Report
Financial position and results of operations

Merck Serono -i- Page 58Our business by region
2/5
I
ME
RC
K A
NN
UA
L R
EP
OR
T 20
12 –
TH
E R
OA
D T
O T
OM
OR
RO
W –
WW
W.M
ER
CK
GR
OU
P.C
OM
42%Europe
29%Emerging Markets
22%North America
7%Rest of World
Sales by region 2012
Merck Serono
58 Merck 2012Group Management Report

Strong franchises generate solid growth
In 2012, Merck Serono’s total revenues rose to € 6,405 million (2011: € 5,920 million). Sales increased 7.8% to € 5,996 million (2011: € 5,564 million). This absolute increase of more than € 400 million was driven by organic sales growth of 4.9% and positive exchange rate effects of 2.8%, primarily owing to a stronger U.S. dollar. The solid performance was based predominantly on our multiple sclerosis (MS) treatment Rebif ®, our fertility product Gonal-f ®, and our diabetes drug Glucophage ®. These key products delivered organic growth rates ranging from 8% to 15%. Royalty, license and commission income increased 15.2% to € 409 million (2011: € 356 million), mainly driven by higher income from the strong sales performance of Humira ® in addition to a positive impact from foreign exchange rates.
Merck Serono | Key figures
€ million 2012 2011Change
in %
Total revenues 6,405.2 5,920.0 8.2Sales 5,995.8 5,564.4 7.8Operating result (EBIT) 508.3 342.2 48.5
Margin (% of sales) 8.5 6.1 –EBITDA 1,440.6 1,526.9 –5.7
Margin (% of sales) 24.0 27.4 –EBITDA pre one-time items 1,785.3 1,569.0 13.8
Margin (% of sales) 29.8 28.2 –
Production costs rose 16.0% to € 1,193 million (2011: € 1,028 million) reflecting higher sales volumes as well as higher start-up costs for the Large-Scale Biotech production plant (LSB) in Vevey (Switzerland) in addition to one-time expenses related to the FDA warning letter. Gross profit increased 6.5% to € 5,212 million (2011: € 4,892 million), translating into a lower gross margin (in % of sales) of 86.9% (2011: 87.9%), reflecting the ongoing pricing pressure and growing volumes of our General Medicine portfolio.
Marketing and selling costs declined by 2.9% to € 1,371 million (2011: € 1,412 million) thanks to focused resource allocation. Royalty, license and commission expenses, however, rose 17.3% to € 562 million (2011: € 479 million) owing to the strong performance of Rebif ® in the United States compounded by positive foreign exchange rate effects, which resulted in higher commission payments to our co-marketing partner Pfizer.
Net other operating expenses and income increased by more than 75% to € –675 million (2011: € –382 million) due to restructuring charges amounting to € 339 million. These charges were related to the efficiency program, in particular to the preparations for the closure of the Merck Serono site in Geneva. In addition, impairments of € 46 million were incurred on site closures and obsolete software. In 2011, other operating expenses were especially impacted by the impairment loss of € 165 million on the LSB plant.
Rebif ®, Gonal-f ® and Glucophage ® sales grow significantly
Focused resource allocation in marketing and selling as well as in R&D
Merck Serono 1/4
59Merck 2012Group Management Report

R&D expenses decreased slightly to € 1,187 million (2011: € 1,225 million) representing 19.8% of sales (2011: 22.0%). This decline reflects initial structural savings achieved in connection with the Geneva site closure.
Amortization of intangible assets resulting mainly from the 2007 acquisition of Serono accounted for charges of € 659 million (2011: € 799 million). In 2011, impairments of € 149 million related to the discontinuation of three products in development were recognized in addition to amortization. Further-more, in the second quarter of 2011, the estimated remaining useful life of Rebif ® was shortened by two years, which led to higher amortization expenses of € 17 million in 2012 compared to the previous year.
The division’s EBIT was € 508 million compared to € 342 million in 2011. Adjusting for one-time items and adding back depreciation and amortization, divisional EBITDA pre one-time items increased 13.8% to € 1,785 million (2011: 1,569 million) reflecting a margin (in % of sales) of 29.8% (2011: 28.2%). This increase already includes savings related to the efficiency program.
Merck Serono | Sales by region – 2012
€ million / % of divisional sales
3 1
2
41 Europe 2,502 42%2 North America 1,335 22%3 Emerging Markets 1,737 29%4 Rest of World 422 7%
In 2012, the proportion of sales generated outside Europe grew to 58% (2011: 54%), largely driven by the strong sales growth in North America. Contributing to the 16.8% organic increase in sales were Rebif ®, benefiting from year-on-year price increases, as well as the products from the Fertility and Endocrinology franchises. Sales in the Emerging Markets region developed favorably and grew 6.8% organically, based on the continued strong performance of the General Medicine franchise as well as Fertility products. Challenging business conditions in Europe, the division’s biggest geographic market, where pressures on health care budgets led to continuous price cuts across the industry, resulted in a 2.1% decline in organic sales. This was primarily due to lower sales of General Medicine products. Sales in the Rest of World region grew 12.0%, mainly thanks to the good performance of Glucophage ® and Erbitux ®.
Merck Serono | Sales growth components by region – 2012
€ million / change in % SalesOrganic growth
Exchange rate effects
Acquisitions/ divestments
Reported sales growth
Europe 2,501.6 –2.1 0.4 – –1.7North America 1,334.8 16.8 8.8 – 25.6Emerging Markets 1,737.1 6.8 2.2 – 9.0Rest of World 422.3 12.0 4.7 – 16.6World in total 5,995.8 4.9 2.8 – 7.8
EBITDA pre one-time items amounts to 29.8% of sales
Organic growth in all regions except for Europe
60 Merck 2012Group Management Report
Merck Serono

Merck Serono’s largest single product, Rebif ® (interferon beta-1a), for the treatment of relapsing forms of MS grew 7.5% organically to € 1,893 million (2011: € 1,691 million). The main contributors were grow-ing sales in the United States, as a result of price increases made in January, May and November. North America remained the largest market for Rebif ®, accounting for 52% of sales. In Europe, where Rebif ® continues to be the most frequently prescribed MS treatment in major markets, sales declined slightly from the previous year’s level. Stable volumes could not offset continued pricing pressure. Sales in the Emerging Markets and Rest of World regions, which account for less than 10% of global sales, remained roughly at the previous year’s level.
Rebif ® is marketed by Merck Serono worldwide. In 2002, Serono entered into a co-promotion agreement with Pfizer for Rebif ® in the United States. The term of the agreement ends on December 31, 2013 unless extended. EMD Serono (a subsidiary of Merck KGaA) and Pfizer are in a dispute about the term of the agreement based on the parties’ interpretations of the provisions governing extension. During 2011, a lower court in the United States agreed with Pfizer and ruled that the Pfizer agreement extends through 2015. Subsequently, EMD Serono appealed this decision. The ruling from the appellate court is still pending. If EMD Serono prevails on appeal, this case will proceed before the lower court.
Erbitux ®, a monoclonal antibody targeting the epidermal growth factor receptor (EGFR), is approved for the treatment of metastatic colorectal cancer (mCRC) and squamous cell carcinoma of the head and neck (SCCHN). Sales grew 1.9% organically in 2012, amounting to € 887 million (2011: € 855 million). The majority of sales continue to be generated by use in first-line mCRC. In Europe, accounting for 56% of global sales, sales declined 1.5% organically due to increasing competition in the second-line mCRC segment as well as public budget constraints. Across the Emerging Markets region, sales grew 7.4% organically as a result of increasing patient numbers, mainly in mCRC. In Japan, which belongs to the Rest of World region and generates 13% of total sales, intensifying competitive pressure in the mCRC indication led to an organic sales decline of 6.5%.
Merck licensed the right to market Erbitux ® outside the United States and Canada from ImClone LLC, a wholly-owned subsidiary of Eli Lilly and Company, in 1998. In Japan, ImClone, Bristol-Myers Squibb Company and Merck jointly develop and commercialize Erbitux ®.
Merck Serono | Major products by region, organic growth rates – 2012
Total Europe North AmericaEmerging Markets Rest of World
Rebif ® € million 1,892.6 730.8 982.7 145.3 33.8org. growth in % 7.5 –2.1 18.1 –0.3 11.5% of sales 100 39 52 8 2
Erbitux ® € million 887.4 500.1 – 235.6 151.7org. growth in % 1.9 –1.5 – 7.4 5.7% of sales 100 56 – 27 17
Rebif ® sales increase to around € 1.9 billion
Increasing sales in Emerging Markets drive Erbitux ® growth
61Merck 2012Group Management Report
Merck Serono

Sales of Merck Serono’s medications to treat infertility amounted to € 817 million in 2012, corresponding to organic growth of 13.4%. The complete portfolio of gonadotropins consists of recombinant hormones for injection used at different stages from follicular development to early pregnancy. Gonal-f ® (follitropin alfa) inducing ovarian follicular growth and maturation, continued to perform strongly in all regions, growing by a total of 12.2% organically to € 612 million. In the United States, sales were further boosted by year-on-year price increases. The division continued the worldwide rollout of the pre-filled pen injectors for Gonal-f ® as well as Ovidrel ® and Luveris ® (family of pens) designed to facilitate easy daily administration during fertility treatment. Since 2009, Merck Serono has been sponsoring the Grant for Fertility Innovation dedicated to research projects focused on clinical research that can help to increase the take-home baby rate of patients undergoing fertility treatment. The program was expanded to € 4 million for 2012/2013.
The Endocrinology portfolio, comprising a range of products to treat endocrine and metabolic disorders, reported sales of € 399 million, increasing 11.9% organically with contributions coming from all regions. Sales of Saizen ® (somatropin for injection) indicated for the treatment of growth hormone deficiency, were up 7.4% organically, amounting to € 250 million. Supported by the Merck Serono injection devices, Saizen ® maintained its average market share despite broad-based competition. Particular growth drivers included higher volumes in Emerging Markets and price increases in the United States. Kuvan ® (sapropterin dihydro-chloride) is indicated for the treatment of hyperphenylalaninemia or a deficiency of tetrahydrobiopterin. Sales continue to grow rapidly. The rollout in Asia and Latin America is ongoing. Egrifta ® (tesamorelin for injection), which is used as a therapy for reducing excess abdominal fat in HIV patients with lipodystrophy, also contributed to growth. We market this product only in the United States.
The General Medicine business comprises drugs for treating diabetes, cardiovascular diseases and thyroid disorders, as well as other globally and regionally marketed products. In 2012, sales increased by € 69 million (3.8% organically) to € 1,886 million. Strong volume growth in the Emerging Markets region, which accounted for 56% of sales, was offset by pricing declines as well as lower volumes in Europe, especially in southern European markets and France.
Merck Serono | Key products, organic growth rates
€ million0
Gonal-f ® 12.2%
Concor ® –6.0%
Glucophage ® 14.7%
Saizen ® 7.4%
Euthyrox ® 17.3%
0
2011 2012
526
397
346
225
175
612
380
400
250
208
All regions report higher volumes for Gonal-f ®
Sales of the Endocrinology portfolio rise to around € 400 million
62 Merck 2012Group Management Report
Merck Serono

Globally, around 366 million people have diabetes, and the prevalence of this disease is rising. Glucophage ® (metformin) remains the drug of choice for first-line treatment of type 2 diabetes. Thanks to the strong performance of this oral antidiabetic franchise, it became the third-largest absolute growth contributor to Merck Serono’s 2012 top-line performance. Sales rose by 14.7% organically to € 400 million, supported by strong sales in the Emerging Markets region and Japan.
The branded Concor ® products such as Concor ® COR and Lodoz ®, which contain the active ingredient bisoprolol, achieved sales of € 380 million. This translates into an organic decline of 6.0%, which was primarily the result of price cuts in addition to lower volumes in France and southern European markets. By contrast, sales of Concor ® in Emerging Markets grew by around 10%.
Merck Serono is the world’s largest supplier of drugs to treat thyroid disorders. Globally, more than 300 million people suffer from hypothyroidism. Sales of products to treat thyroid disorders, including Euthyrox ®, posted double-digit sales growth, driven primarily by higher volumes in Emerging Markets.
On December 15, 2011, Merck received a Warning Letter from the United States Food and Drug Administration (FDA) related to inspections of production facilities in Tiburtina, Italy, and Aubonne and Vevey, Switzerland. These sites contribute to the production of Rebif ® and other products for distribution in the United States. The letter primarily addressed several processes related to the manufacturing of Rebif ®, which the FDA concluded were not in full compliance with good manufacturing practice standards. Merck is working closely with the FDA to address its observations. The agency completed its initial evaluation of the company’s responses. In its reply, the FDA stated that “We agree that your proposed corrective actions, if implemented appropriately, should adequately address the violations at issue.” Since that initial evaluation, all commit-ments to the corrective action plan submitted to the FDA have been completed on schedule and a final update was provided to the FDA in September, 2012. FDA re-inspections took place during the fourth quarter of 2012 and are expected to be completed in the first half of 2013 to confirm the complete implementation of the proposed corrective actions.
Research & Development strategy
During the year, the main operational focus was on implementing the new organizational structure of Merck Serono in R&D, which now comprises two major functions. The Global Research and Early Development function is responsible for projects in discovery and pre-clinical stages through to Proof of Confidence, when the available clinical data are judged sufficient to justify significant investment in large-scale clinical development. In this function teams are clustered around certain therapeutic areas as well as platform technologies. The Global Development and Medical function is responsible for the late-stage clinical development of products, managing their submissions to regulatory authorities and then overseeing the post-approval lifecycle management. The main disciplines included in this function are clinical development regulatory, safety, as well as medical and scientific affairs. It also includes the quality function which ensures compliance with state-of-the-art Good Practices (Laboratory, Clinical and Manufacturing).
Glucophage ® and other brands in the General Medicine portfolio grow especially in the Emerging Markets region
63Merck 2012Group Management Report
Merck Serono

1 PI3K/mTOR inhibitor (SAR245409) of Sanofi, conducted under the responsibility of Merck2 Sponsored by the National Cancer Institute (USA)3 Post approval request by the European Medicines Agency
More information on the ongoing clinical trials can be found at www.clinicaltrials.gov
S1P: Sphingosin-1-phosphateIFN: Interferon mAb: Monoclonal Antibody MEK: Mitogen Activated Protein Kinase PI3K: Phosphoinositide 3-Kinase EGFR: Epidermal Growth Factor Receptor PKU: Phenylketonuria
Merck Serono pipeline, as of January 2013
Therapeutic area Compound Indication Status
Neurodegenerative diseases
ONO-4641 (oral S1P receptor modulator) Multiple sclerosis Phase IIATX-MS-1467 (immune tolerazing agent) Multiple sclerosis Phase IPI-2301 (second generation peptide copolymer) Multiple sclerosis Phase I
Oncology Erbitux ® (cetuximab, anti-EGFR mAb) Head and neck cancer Filed in ChinaCilengitide (integrin inhibitor) Glioblastoma Phase IIICilengitide (integrin inhibitor) Non-small cell lung cancer Phase II
L-BLP25 (MUC1-antigen-specific cancer immunotherapy) Non-small cell lung cancer
Phase III (in Asia)
TH-302 (hypoxia targeted alkylating drug) Soft tissue sarcoma Phase IIITH-302 (hypoxia targeted alkylating drug) Pancreatic cancer Phase III
TH-302 (hypoxia targeted alkylating drug)Hematological malignancies and combination trials in solid tumors Phase I
DI17E6 (Anti-integrin mAb) Colorectal cancer Phase IIDI17E6 (Anti-integrin mAb) Prostate cancer Phase IIPimasertib (MEK inhibitor) Pancreatic cancer Phase IIPimasertib (MEK inhibitor) Cutaneous melanoma Phase IIPimasertib/PI3K inhibitor combination Solid tumors Phase I 1
C-Met kinase inhibitor Solid tumors Phase ISym004 (anti-EGRF Ab mixture) Head and neck cancer Phase IISym004 (anti-EGRF Ab mixture) Solid tumors Phase IMEK inhibitor 2 Solid tumors Phase INHS-IL 12 (cancer immunotherapy) Solid tumors Phase I 2
Immunology Atacicept (anti-Blys/anti-APRIL fusion protein) Systemic lupus erythematosus Phase IISprifermin (fibroblast growth factor 18) Cartilage injury repair Phase IISprifermin (fibroblast growth factor 18) Osteoarthritis Phase I
Endocrinology Kuvan ® (sapropterin dihydrochloride) PKU in pediatric patients < 4 years Phase III 3
64 Merck 2012Group Management Report
Merck Serono

Historically at Merck Serono, both the length and costs of all stages of clinical development were higher than industry average. In response to this, Merck Serono is striving to both speed up drug development and make it more cost efficient. In order to achieve this, the organization is in the process of simplifying its structure, reducing the number of decision-making bodies and outsourcing certain functions and tasks. A net decrease in R&D costs by € 120 million by 2014 is planned. Processes are underway to shift relative spending away from fixed costs towards mainly project-related expenditure in order to increase the value of the pipeline and its output.
In order to improve the interface with scientists, clinicians and regulators worldwide, the division is increasing its focus on North America and Asia by further developing the R&D hubs in Boston (United States), Beijing (China) and Tokyo (Japan). At our R&D headquarters in Darmstadt, Merck Serono will continue to build upon the legacy of strength in areas such as oncology and immunology. In North America, Merck Serono will build upon its current Boston footprint at EMD Serono in Rockland, Massachusetts as well as developing the new state-of-the-art research facility in Billerica, Massachusetts. The three global R&D hubs of the division will optimize the ability to deliver innovative science and medicines globally and importantly will enhance the ability to attract and grow biopharma talent for the future development of the Merck Serono division.
Research at Merck Serono is strongly committed to innovation. In the new structure, teams are given enhanced freedom to operate. The cost structure is being adapted in order to free up resources for projects. A Scientific Peer Review process has been put in place in the form boards of external advisors in order to discuss, challenge and thereby improve research projects and plans. To broaden its capabilities, Merck Serono will continue to expand its external networks beyond the many collaborations it already has in place.
Oncology remains the key pillar of Merck Serono’s research strategy, focusing on differentiated mol-ecules in selected clusters both in solid tumors and hematological malignancies. The division also aims to leverage novel-novel combinations and it will continue with its biomarker strategy in order to drive per-sonalized health care solutions. Immuno-Oncology has the potential to strengthen the existing oncology pillar by adding innovative treatment approaches like therapeutic cancer vaccines and immunomodulation. A medical consortium made up of world-class centers offering access to state-of-the-art clinical develop-ment in this field has been established.
Multiple sclerosis (MS) remains an important focus area in which Merck Serono has extensive develop-ment expertise; however, other neurological disorders are also being investigated depending on the unmet medical need they represent and their strategic fit. Merck Serono will continue to use innovative ideas whether internally or externally generated, through collaborations like Fast Forward™ (founded by the National Multiple Sclerosis Society, USA) with smaller biotech companies, as well as the recently announced Grant for MS Innovation with academia.
The goals of the “Fit for 2018” efficiency program in R&D
Focus and simplifying our global footprint
Research: creating an early-stage pipeline of clearly differentiated molecules
Oncology, Multiple Sclerosis and Immunology are key areas of focus
65Merck 2012Group Management Report
Merck Serono

Given its in-house expertise in the field of immunology and perceived scientific opportunities Merck Serono plans to establish the study of immune-mediated diseases as a significant new pillar of its research strategy.
In April 2012, Merck Serono launched the Entrepreneur Partnership Program (EPP) to support former employees in the creation of start-up companies focused on continuing activities and compounds that originated at Merck Serono. During 2012, more than eighty proposals were assessed. Four viable endeavors were approved, including small companies founded around pre-clinical work in Alzheimer’s and Parkinson’s disease. Selected investments will be managed by Merck Serono Ventures, which will be represented on each of the companies’ board of directors.
The Global Development and Medical function aims to become globally competitive on productivity, value, cost and speed in conducting clinical development. Merck Serono aims to attract and retain key talents to build up world class capabilities. Simplified processes are being put in place in compliance with highest quality standards in order to improve efficiency. Consolidated worldwide regulatory, safety, quality and clinical operation functions are being implemented and a lean and flexible organization well connected with all relevant external stakeholders is being built. Merck Serono aims to increase the value of its development pipeline and become more efficient and effective at developing new products.
Biosimilars, which according to IMS Health will represent a strongly growing market of US$ 11 billion to US$ 25 billion by 2020, aim to be similar to marketed biological drugs. In contrast to classic generic drugs, which are made from relatively easily duplicated chemical-based active ingredients, biosimilars are much more complex molecular structures and usually differing slightly from the original. As a result their development, manufacturing and approval processes are much more demanding and complex. Merck Serono aims to participate in this growing market, by taking advantage of its biopharmaceutical expertise in the area of development, regulatory and manufacturing. In 2012, Merck Serono and Dr. Reddy’s Laboratories announced that the two companies will collaborate to jointly develop and globally market follow-on biologics, with a primary focus on monoclonal antibodies. The strategic rationale of this collaboration is to leverage Merck Serono’s biopharma strengths with Dr. Reddy’s strong expertise in biosimilars.
Entrepreneur Partnership Program (EPP) leads to four start-ups
Development: Build a Biopharma culture of performance, execution and leadership
Merck Serono to develop biosimilars
66 Merck 2012Group Management Report
Merck Serono

Clinical pipeline update
The Merck Serono pipeline has a strong focus on oncology. Currently, 16 projects are in various phases of clinical development.
In late 2012, approval was obtained in Japan from the Ministry of Health, Labor and Welfare for the use of Erbitux ® in adult patients with head and neck cancer. The division also announced the decision to voluntarily withdraw the marketing authorization application to the European Medicines Agency (EMA) of a label extension for Erbitux ® in combination with standard first-line platinum-based chemotherapy in patients with advanced or metastatic non-small cell lung cancer (NSCLC) with high epidermal growth factor receptor (EGFR) expression. The decision to withdraw the application was based on feedback from the EMA, indicating that further clinical data would be required. Merck Serono reported a negative outcome of the EXPAND trial, which assessed Erbitux ® as a first-line treatment for patients with advanced gastric cancer, and the PETACC-8 trial, assessing Erbitux ® for the adjuvant treatment of stage III colon cancer. Merck will not pursue further development of Erbitux ® in the lung, gastric or adjuvant colon indications. These results do not alter the current utility of Erbitux ® in patients with KRAS wild-type mCRC and in patients with locally advanced or recurrent and/or metastatic SCCHN in those markets where Erbitux ® is currently registered in these indications.
The division continued to strengthen its early- and mid-stage pipeline via strategic transactions. Two oncology projects were in-licensed during 2012. A global agreement to license and co-develop TH-302, an investigational small molecule hypoxia-targeted drug, was followed by an exclusive worldwide license agreement for Sym004, potentially complementing and building upon Merck’s existing Erbitux ® franchise.
At the time of in-licensing, TH-302, a molecule designed to be activated under severe tumor hypoxic conditions was already being investigated in a Phase III in patients with soft tissue sarcoma (STS). Following the positive outcome in a Phase IIb trial in patients with advanced pancreatic cancer (PaCa), presented at the Association for Cancer Research meeting in April 2012, the decision was made later in the year to proceed to Phase III. For both indications (STS and PaCa), an agreement was reached with the FDA regarding a Special Protocol Assessment (SPA). The STS indication has also been assigned orphan drug status in the United States as well as in the EU. In addition, the use of TH-302 in other solid tumors and hematological malignancies is being evaluated in several Phase I trials.
Sym004 is an investigational product comprised of two antibodies that are designed to block ligand binding, receptor activation and downstream signaling as well as to elicit removal of EGFR from the cancer cell surface by inducing their internalization and degradation. Sym004 is currently being evaluated in a Phase I/II trial in patients with advanced KRAS wild-type mCRC. In addition, a single-arm, open-label Phase II trial is underway in patients with SCCHN who have failed anti-EGFR-based therapy.
Late-stage pipeline strengthened through the in-licensing of TH-302 and Sym004
67Merck 2012Group Management Report
Merck Serono

Pimasertib, Merck Serono’s MEK inhibitor, is an investigational small molecule inhibitor of MEK1/2, which is part of the MAPK signaling pathway. This pathway is up-regulated in various types of cancer. Pimasertib moved to Phase II in PaCa as well as in N-Ras mutated cutaneous melanoma. Around 25% of melanoma patients have N-Ras mutated tumors and have currently limited effective treatment options.
L-BLP25 (formerly known as Stimuvax) is an investigational MUC1 antigen-specific cancer immuno-therapy designed to stimulate the body’s immune system to identify and target cells expressing MUC1. MUC1 is expressed in many cancers, such as NSCLC. L-BLP25 was being investigated in the Phase III START trial and is currently being investigated in the Phase III INSPIRE trial, both for the treatment of unresectable stage III NSCLC. In late 2012, the START trial reported a negative outcome missing the primary endpoint of extending overall survival. Notable treatment effects were observed, however, in certain subgroups. Based on further analysis still to be done, Merck Serono will decide on the future of the L-BLP25 development program in 2013. The ongoing clinical program of L-BLP25, including INSPIRE, will continue pending discussion with relevant regulatory agencies.
Concerning cilengitide, Merck Serono’s investigational integrin inhibitor, the outcome of the pivotal, randomized Phase III CENTRIC trial is expected in the first half of 2013. The study follows a biomarker-guided approach focusing on newly diagnosed glioblastoma patients with methylated MGMT (methylguanine-DNA methyltransferase) gene promotor status since it is thought they might be more likely to benefit from combination treatment with temozolomide, radiotherapy and cilengitide. To ensure the availability of a qualified diagnostic, Merck Serono expanded its collaboration with MDxHealth, a diagnostic company, to support the development and regulatory activities for the MGMT test. During 2012, the development of cilengitide in SCCHN was stopped following negative Phase II results. The Phase II study combining cilengitide with Erbitux ® and chemotherapy for the treatment of NSCLC continues. Since Erbitux ® is not registered for NSCLC, the results of this study can serve only for further hypothesis generation.
In the field of MS, FDA approval of the Rebif ® Rebidose injector for patients with relapsing forms of MS was received early 2013. The device was evaluated in a 12-week Phase IIIb multicenter, open-label, single-arm study for the self-administration of Rebif ® with respect to ease of use, patient satisfaction and acceptability, and functional reliability.
Turning to ONO-4641, a sphingosine-1-phosphate receptor modulator, a positive outcome from the Phase II DreaMS study in patients with relapsing MS was presented at the American Academy of Neurology meeting in May 2012. Currently, further studies, both non-clinical and clinical, are being performed which will provide more information on efficacy, safety and the potential for differentiation of this agent to allow Merck Serono to make an informed decision about whether to advance this project to Phase III in 2013. An immune tolerizing agent (ATX-MS-1467) is close to delivering Phase I trial results.
Pimasertib moved to Phase II development
L-BLP25 misses primary endpoint in the START study; additional analysis ongoing
Phase III results for cilengitide expected in the first half of 2013
Decision regarding further development of ONO-4641 to be made during 2013
68 Merck 2012Group Management Report
Merck Serono

After careful evaluation of the available Phase I data, the division decided to end the development of long-acting interferons in the area of MS.
In the area of immunology, Merck Serono is currently analyzing data from the double-blind, placebo-controlled Phase II study (APRIL SLE) assessing the therapeutic value of atacicept in systemic lupus erythematosus (SLE). The trial initially investigated two doses of atacicept in patients who were stable following steroid taper, and measured the effect of the drug on new disease flares. The study recruited more than 450 patients. The complete clinical and biomarker data from this study are expected to be presented at a scientific conference in the first half of 2013.
Development of sprifermin (fibroblast growth factor 18), a recombinant protein, is ongoing in the treatment of knee cartilage injury in the context of a Phase II study. Two Phase I studies were completed in patients with osteoarthritis of the knee joint.
69Merck 2012Group Management Report
Merck Serono

Consumer Health -i- Page 70Our business by region
2/5
I
67%Europe
29%Emerging Markets
4%Rest of World
Sales by region 2012
Consumer Health
ME
RC
K A
NN
UA
L R
EP
OR
T 20
12 –
TH
E R
OA
D T
O T
OM
OR
RO
W –
WW
W.M
ER
CK
GR
OU
P.C
OM
70 Merck 2012Group Management Report

Rebuilding the division’s base
The Consumer Health division reported sales of € 473 million in 2012, compared to € 494 million in 2011. To fundamentally improve its operational profitability, Consumer Health began the process of restructuring its operations in 2012. This process, which is planned to be completed in 2013, involves refocusing investments on those core brands that hold leading positions in a number of important markets. The division is also in the process of restructuring its operating model towards greater market proximity and trimmed its resources in marketing and selling as well as R&D. The Seven Seas plant in Hull (United Kingdom) will be shut down given the continued low capacity utilization, high investments required to upgrade equipment, and the relatively high cost of operations. Related to this, the division stopped shipment of several products from the Seven Seas plant to remediate the registration dossiers. As a consequence of these interventions, sales declined organically by 6.2%, owing to softer sales of local and non-core brands and in some cases the complete exit from non-profitable markets and brands. Positive exchange rate effects of 1.8% were only partly able to compensate for the decline in organic sales. Despite this and as a result of tighter cost control, particularly in marketing and sales, the division’s EBITDA pre margin improved to 13.4% of sales (2011: 11.8%).
Consumer Health | Key figures
€ million 2012 2011Change
in %
Total revenues 475.2 496.2 –4.2Sales 472.6 494.2 –4.4Operating result (EBIT) 4.3 46.9 –90.8
Margin (% of sales) 0.9 9.5 –EBITDA 26.5 58.5 –54.8
Margin (% of sales) 5.6 11.8 –EBITDA pre one-time items 63.5 58.5 8.4
Margin (% of sales) 13.4 11.8 –
Cost of sales was nearly unchanged at € 158 million (2011: € 157 million). As a result of the lower annual sales level and costs related to brand reorientation and restructuring, gross profit decreased to € 317 million (2011: € 339 million) resulting in a lower gross margin (as % of sales) of 67.0% (2011: 68.6%).
Total selling, general and administration costs (SG&A, comprising marketing & selling, royalty, license and commission expenses, administration and other operating expenses/income) increased to € 289 million (2011: € 265 million) due to restructuring-related one-time items. Marketing and selling expenses, which are included in this item, decreased substantially, mainly as a result of more focused, lower spending.
Moreover, R&D costs declined to € 19 million (2011: € 23 million) or 4.1% of sales. This was achieved by improved prioritization of projects as well as structural cost savings.
Extensive restructuring initiatives implemented to increase profitability
Marketing and sell-ing expenses lowered through prioritization
Consumer Health 2/4
71Merck 2012Group Management Report

On a reported basis, EBIT declined to € 4 million (2011: € 47 million). Adjusted for restructuring charges of € 37 million (mainly due to the planned closure of the Seven Seas plant in Hull), and € 11 million in restructuring-related impairments and depreciation and amortization, EBITDA pre one-time items grew to € 63 million (2011: € 59 million). This increase includes structural net savings from the efficiency program. The EBITDA pre margin (as % of sales) climbed to 13.4% (2011: 11.8%).
Consumer Health | Sales by region – 2012
€ million / % of divisional sales
3
12
4
1 Europe 315 67%2 North America 1 0%3 Emerging Markets 139 29%4 Rest of World 17 4%
From a geographic perspective, Emerging Markets was the only region to generate organic growth in 2012, driven by Cebion ®, the Consumer Health vitamin C brand. In Europe, top-line sales were negatively affected by the refocus on strategic brands as well as restructuring efforts. In addition, the division faced declining over-the-counter medicines markets and strong competitive pressure in Central Europe. The sales decline in North America reflects the market exit of Consumer Health in Canada.
Consumer Health | Sales growth components by region – 2012
€ million / change in % SalesOrganic growth
Exchange rate effects
Acquisitions/ divestments
Reported sales growth
Europe 315.1 –8.5 1.0 – –7.5North America 1.2 –75.1 1.3 – –73.7Emerging Markets 139.4 2.2 4.3 – 6.5Rest of World 16.9 –4.9 –2.0 – –6.9World in total 472.5 –6.2 1.8 – –4.4
EBITDA pre one-time items improved to 13.4% of sales
72 Merck 2012Group Management Report
Consumer Health

The exit from unprofitable markets and brands as well as the impact of restructuring led to an organic sales decline ranging between 2% and 10% across all of the division’s health themes.
Consumer Health | Core brands
Bion®
Kytta®
femibion®
Sangobion®
Seven Seas®
Sedalmerck®
Cebion
Nasivin®
73Merck 2012Group Management Report
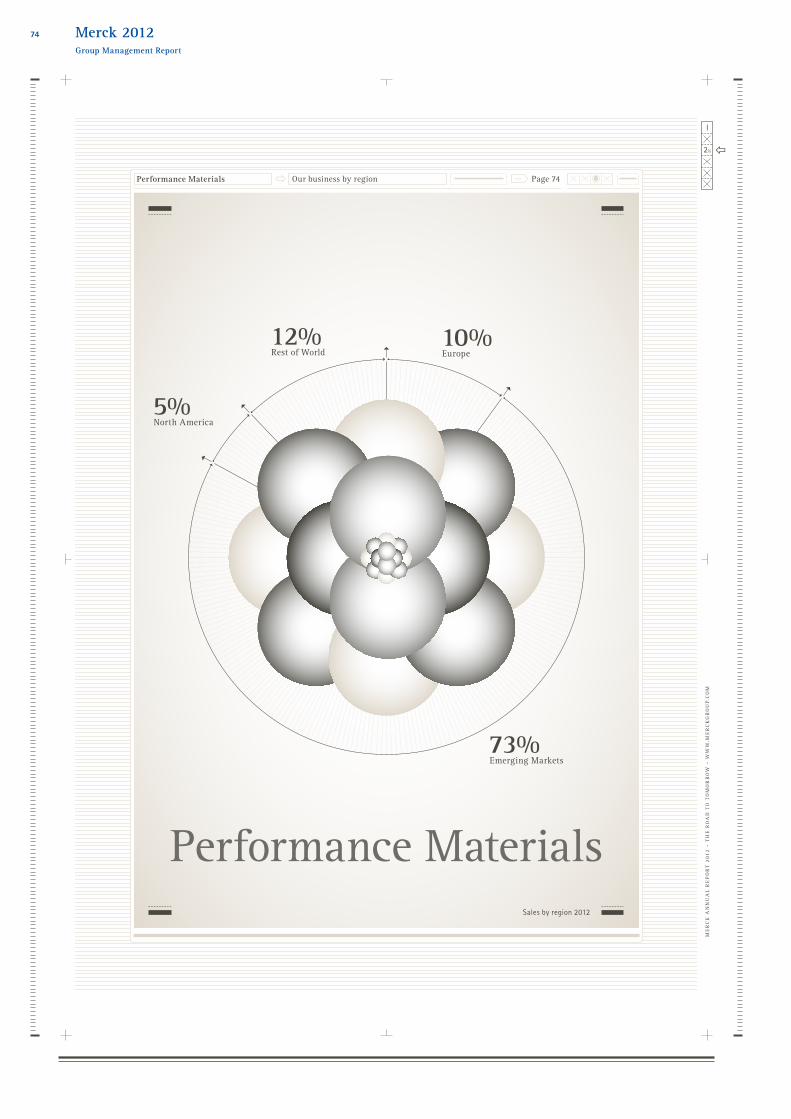
Performance Materials -i- Page 74Our business by region
2/5
I
10%Europe
73%Emerging Markets
5%North America
12%Rest of World
Performance MaterialsSales by region 2012
ME
RC
K A
NN
UA
L R
EP
OR
T 20
12 –
TH
E R
OA
D T
O T
OM
OR
RO
W –
WW
W.M
ER
CK
GR
OU
P.C
OM
74 Merck 2012Group Management Report
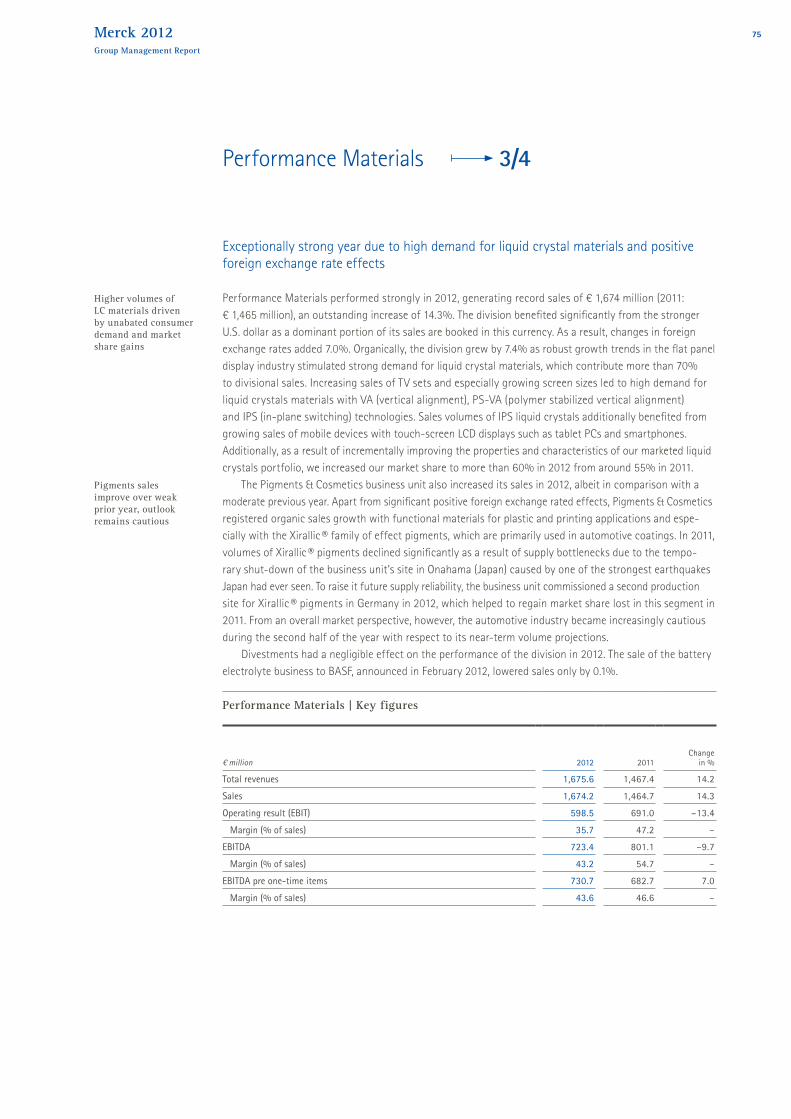
Exceptionally strong year due to high demand for liquid crystal materials and positive foreign exchange rate effects
Performance Materials performed strongly in 2012, generating record sales of € 1,674 million (2011: € 1,465 million), an outstanding increase of 14.3%. The division benefited significantly from the stronger U.S. dollar as a dominant portion of its sales are booked in this currency. As a result, changes in foreign exchange rates added 7.0%. Organically, the division grew by 7.4% as robust growth trends in the flat panel display industry stimulated strong demand for liquid crystal materials, which contribute more than 70% to divisional sales. Increasing sales of TV sets and especially growing screen sizes led to high demand for liquid crystals materials with VA (vertical alignment), PS-VA (polymer stabilized vertical alignment) and IPS (in-plane switching) technologies. Sales volumes of IPS liquid crystals additionally benefited from growing sales of mobile devices with touch-screen LCD displays such as tablet PCs and smartphones. Additionally, as a result of incrementally improving the properties and characteristics of our marketed liquid crystals portfolio, we increased our market share to more than 60% in 2012 from around 55% in 2011.
The Pigments & Cosmetics business unit also increased its sales in 2012, albeit in comparison with a moderate previous year. Apart from significant positive foreign exchange rated effects, Pigments & Cosmetics registered organic sales growth with functional materials for plastic and printing applications and espe-cially with the Xirallic ® family of effect pigments, which are primarily used in automotive coatings. In 2011, volumes of Xirallic ® pigments declined significantly as a result of supply bottlenecks due to the tempo-rary shut-down of the business unit’s site in Onahama (Japan) caused by one of the strongest earthquakes Japan had ever seen. To raise it future supply reliability, the business unit commissioned a second production site for Xirallic ® pigments in Germany in 2012, which helped to regain market share lost in this segment in 2011. From an overall market perspective, however, the automotive industry became increasingly cautious during the second half of the year with respect to its near-term volume projections.
Divestments had a negligible effect on the performance of the division in 2012. The sale of the battery electrolyte business to BASF, announced in February 2012, lowered sales only by 0.1%.
Performance Materials | Key figures
€ million 2012 2011Change
in %
Total revenues 1,675.6 1,467.4 14.2Sales 1,674.2 1,464.7 14.3Operating result (EBIT) 598.5 691.0 –13.4
Margin (% of sales) 35.7 47.2 –EBITDA 723.4 801.1 –9.7
Margin (% of sales) 43.2 54.7 –EBITDA pre one-time items 730.7 682.7 7.0
Margin (% of sales) 43.6 46.6 –
Higher volumes of LC materials driven by unabated consumer demand and market share gains
Pigments sales improve over weak prior year, outlook remains cautious
Performance Materials 3/4
75Merck 2012Group Management Report

In 2012, the division’s gross profit grew 9.6% to € 959 million (2011: € 875 million), at a lower rate than sales growth, which reduced gross margin to 57.3% (2011: 59.8%). Several factors were responsible for this development: Higher volumes in addition to underutilization of production capacity as a result of reducing inventory levels led to an increase in production costs of 21.0% to € 716 million (2011: € 592 million). Furthermore, price concessions as a result of higher volumes additionally weighed on the gross margin.
Total selling, general and administration costs (including also license and commission expenses, other operating expenses/income) increased more than fourfold by € 179 million to € 219 million (2011: € 40 million). This development is attributable to the very low levels in the prior year, which included other operating income of € 157 million from the sale of the CropBioscience business to Novozymes. Moreover, other operating expenses of € 26 million related to the efficiency program were booked for the first time in 2012. The division has set itself the goal of optimizing the existing production network in addition to streamlining its organizational structure. Overall, other operating expenses of € 39 million in 2012 compared with other operating income of € 127 million in the previous year. The 7.9% increase in marketing and selling expenses and 6.4% rise in administrative costs, however, remained significantly lower than sales growth.
The same applies to R&D investments, which rose 3.5% to € 137 million (2011: € 133 million). This ongoing high level of 8.2% of sales (2011: 9.1%) reflects the sustainable innovation strategy of the division, especially in Liquid Crystals. Merck intends to maintain its leading market position in liquid crystal materials by both continuously improving existing products and developing new ones.
The aforementioned one-time items also had a significant impact on the operating result of the division. EBIT fell by 13.4% to € 599 million (2011: € 691 million) and EBITDA by 9.7% to € 723 million (2011: € 801 million). Adjusted for one-time items, EBITDA pre rose by 7.0% to € 731 million (2011: € 683 million), representing 43.6% of sales (2011: 46.6%).
Performance Materials | Sales by region – 2012
€ million / % of divisional sales
3
12
41 Europe 160 10%2 North America 90 5%3 Emerging Markets 1,218 73%4 Rest of World 206 12%
Inventory optimization and softer pricing weighing on gross margin
R&D at an unchanged high level, displaying leadership claim for liquid crystal materials
76 Merck 2012Group Management Report
Performance Materials

From a geographic perspective, Emerging Markets generated sales of € 1,218 million in 2012 (2011: € 998 million), or 73% of the division’s sales, reflecting the high concentration of liquid crystals customers in Asia. Divisional sales in this region showed a strong 13.9% organic increase also as a result of strong demand from the emerging Chinese display industry. As a result, Merck’s liquid crystals sales to China more than doubled, elevating China to the number three single market in terms of sales – behind South Korea and Taiwan – overtaking Japan. The sales decline in Japan, which is part of the Rest of World region, was due to the difficult market environment faced by the Japanese display and electronic industry in 2012. As a result, sales of Performance Materials in the Rest of World region declined organically by 15.2% to € 206 million (2011: € 226 million), accounting for 12% of the division’s sales
In the regions of Europe and North America, Performance Materials generates sales almost exclusively with products from the Pigments & Cosmetics business unit. Sales in Europe declined 4.2% organically to € 160 million (2011: € 167 million), or 10% of divisional sales due to both slowing automotive production in this region as well as softer sales to customers in the cosmetics industry. In contrast, sales in North America recorded a high growth rate similar that of the Emerging Markets. Sales grew 13.7% organically to € 90 million (2011: € 74 million), driven primarily by sales of Xirallic ® pigments for automotive coatings as well as strong demand for the division’s active ingredients for cosmetics.
Performance Materials | Sales growth components by region – 2012
€ million / change in % SalesOrganic growth
Exchange rate effects
Acquisitions/ divestments
Reported sales growth
Europe 160.3 –4.2 0.3 – –3.9North America 89.5 13.7 8.7 –1.5 20.9Emerging Markets 1,218.3 13.9 8.2 – 22.1Rest of World 206.1 –15.2 6.3 – –8.9World in total 1,674,2 7.4 7.0 –0.1 14.3
In October 2012, Merck and Seiko Epson Corporation announced a cooperation and licensing agreement for inkjet inks used in the manufacture of OLED (organic light-emitting diode) displays. OLED is an alternative technology to LCD used to create flat-panel displays. Today, OLED is only used in small displays such as smart phones. According to the agreement, Epson will supply Merck with ink technology able to dissolve Merck’s OLED materials, providing the possibility to apply soluble OLED materials on display substrates using specifically designed printing heads. Today, mass production of OLED displays is based on insoluble OLED materials that are applied using complex chemical vapor deposition (CVD) and masking technologies, resulting in highly limited efficiencies of those production processes. Successful development of a printable OLED technology could pave the way for the cost-efficient production of large OLED displays, particularly for televisions.
China becoming third biggest sales contributor, Japan falling behind
Effect pigments business affected by difficult economic environment in Europe
Cooperation established with Epson for the devel-opment of cost-efficient manufacturing processes for OLED displays
77Merck 2012Group Management Report
Performance Materials

Merck Millipore -i- Page 78Our business by region
2/5
I
37%Europe
24%Emerging Markets
27%North America
12%Rest of World
Merck MilliporeSales by region 2012
ME
RC
K A
NN
UA
L R
EP
OR
T 20
12 –
TH
E R
OA
D T
O T
OM
OR
RO
W –
WW
W.M
ER
CK
GR
OU
P.C
OM
78 Merck 2012Group Management Report

Solid business performance continues as integration advances
2012 was again a successful year for the Merck Millipore division. Sales grew by 9.0% to € 2,598 million (2011: € 2,383 million), stemming from solid organic growth of 3.8% and positive exchange rate effects of 3.9% primarily related to the U.S. dollar and 1.4% from acquisitions in the areas of cell culture media, cell imaging and microbial testing. All three business units grew organically, driven by the division’s customers from the pharmaceutical industry, which benefited from higher drug volumes, including new drug launches. Consequently, the Process Solutions business unit, which supplies materials and services for drug produc-tion, saw the strongest sales increase. The Lab Solutions business unit performed well, driven by Lab Water and BioMonitoring products. The performance of the Bioscience business unit remained affected by softer spending by government and academic institutions, although this customer group only accounts for about 15% of divisional sales. During 2012, Merck Millipore recorded royalty, license and commission income of € 19 million (2011: € 10 million) primarily related to the Process Solutions business unit.
Merck Millipore | Key figures
€ million 2012 2011Change
in %
Total revenues 2,616.9 2,392.8 9.4Sales 2,598.2 2,382.6 9.0Operating result (EBIT) 233.2 235.4 –1.0
Margin (% of sales) 9.0 9.9 –EBITDA 542.4 522.4 3.8
Margin (% of sales) 20.9 21.9 –EBITDA pre one-time items 595.9 561.1 6.2
Margin (% of sales) 22.9 23.6 –
Cost of sales increased 8.2% to € 1,086 million in 2012 (2011: € 1,003 million), below reported sales growth. Accordingly, the division’s gross profit increased 10.2% to € 1,531 million (2011: € 1,390 million) or 58.9% of sales (2011: 58.3%). Higher idle costs as a result of the division’s initiative to reduce inventories were partially offset by stronger pricing.
In 2012, Merck Millipore continued to execute its growth strategy by investing in new product development and commercial operations. As a consequence, total selling, general and administration costs grew 11.9% to € 928 million (2011: € 829 million). Marketing and selling expenses, which are included in this item, increased 11.5% to € 676 million (2011: € 606 million). Part of this increase was also driven by the stronger U.S. dollar since the majority of Merck Millipore’s global marketing operations are located in the United States. In addition, the marketing and selling expenses of the recently acquired businesses were included for the first time. Both factors also contributed to the 9.0% increase in administration expenses to € 113 million (2011: € 104 million). Other operating expenses amounted to € 123 million (2011: € 103 million), corresponding to an increase of 19.3% and including € 28 million one-time items related to the Group’s efficiency program.
All business units grow organically, brisk demand from pharma customers
Higher spending driven by actions to fuel future growth
Merck Millipore 4/4
79Merck 2012Group Management Report

To further drive the development of innovative products, the division also increased its R&D spending by 24.5% to € 166 million (2011: € 133 million), representing 6.4% of divisional sales (2011: 5.6%). A significant portion of the increase was directed to Process Solutions, reflecting the division’s expectation that increasing volumes of biopharmaceuticals will remain an attractive growth opportunity. Once again, the strong U.S. dollar contributed to higher costs since the majority of Merck Millipore’s R&D activities are also located in the United States.
The division’s EBIT decreased slightly by 1.0% to € 233 million in 2012 (2011: € 235 million) as a con-sequence of higher strategic investments in the business as well as higher one-time items related to restructuring (including impairments), offsetting the improved gross profit. The decline also reflects a 7.7% increase in depreciation and amortization to € 309 million (2011: € 287 million), driven primarily by higher amortization of purchased intangible assets following recent acquisitions as well as an asset impairment related to the consolidation of the division’s production sites. Adding this back, however, EBITDA increased by 3.8% to € 542 million (2011: € 522 million), while EBITDA pre one-time items grew 6.2% to € 596 million (2011: € 561 million).
Merck Millipore | Sales by region – 2012
€ million / % of divisional sales
3
1
2
41 Europe 966 37%2 North America 703 27%3 Emerging Markets 617 24%4 Rest of World 312 12%
Compared to 2011, Merck Millipore’s geographic sales split remained nearly unchanged, although regional growth trends differed significantly in some cases. Europe remained the division’s largest regional market generating sales of € 966 million (2011: € 906 million) or 37% of divisional sales (2011: 38%), growing 3.1% organically. Organic sales growth was primarily driven by healthy demand from biopharmaceutical production customers for Process Solutions products. In North America, Merck Millipore’s organic sales were flat at € 703 million (2011: € 648 million), representing an unchanged 27% of the division’s sales. However, this development includes the impact of lost sales from an insulin supply contract that was discontinued in the third quarter of 2011 and that primarily affected sales in the United States. Excluding the insulin contract, the division’s organic growth in North America was in the low single digits, reflecting the significant presence of drug manufacturing customers in the United States that also posted increasing drug volumes.
EBIT slightly down due to restructuring costs, EBITDA pre one-time items increased
As the largest con-tributor to sales, Europe delivers solid growth, Emerging Markets and Rest of World show strong growth
80 Merck 2012Group Management Report
Merck Millipore

In the Emerging Markets region, sales grew 6.8% organically to € 617 million (2011: € 561 million), equivalent to an unchanged 24% of sales. All of the division’s business units posted solid growth in this region, delivering mid-single to low double-digit organic growth rates. Posting an 8.5% organic increase in sales to € 312 million (2011: € 268 million), the Rest of World region accounted for 12% of the division’s sales (2011: 11%) and showed growth trends similar to those seen in Emerging Markets.
Merck Millipore | Sales growth components by region – 2012
€ million / change in % SalesOrganic growth
Exchange rate effects
Acquisitions/ divestments
Reported sales growth
Europe 965.7 3.1 0.8 2.6 6.6North America 702.8 0.0 7.5 0.9 8.5Emerging Markets 617.4 6.8 3.1 0.2 10.1Rest of World 312.3 8.5 7.1 1.1 16.7World in total 2,598.2 3.8 3.9 1.4 9.0
The Bioscience business unit – which provides products and services to support life science research – continued to grow in line with the market, reporting an organic increase of 2.0% to sales of € 455 million in 2012 (2011: € 421 million). Growth was driven by Asian and Latin American markets offsetting softer conditions in North America and Europe. On a product level, reagents and kits were the main growth contributors, as well as newly launched products, including Muse™, a closed system of instrument and consumables providing quantitative information on cell health, cell death and cell cycle at the individual cell level. Also launched was the Direct Detect™ system that increases the simplicity and reliability of quantitative protein and peptide analysis. To strengthen the cell biology platform, the division acquired CellASIC in October 2012, a company offering a system allowing in-depth studies of living cells. In August 2011, the acquisition of Amnis extended the business units offering of cell imaging solutions.
Growth in Bioscience driven also by innovations
81Merck 2012Group Management Report
Merck Millipore

The Lab Solutions business unit generated € 1,097 million in sales (2011: € 1,006 million). This perfor-mance reflects an organic growth of 3.1% as a result of solid demand for laboratory water products and biomonitoring solutions primarily used for sample preparation and analytical purposes, respectively. Geographically, all regions contributed to organic growth with the Emerging Markets being the strongest growth contributor. Lab Solutions’ reported sales also saw a 3.1% growth impetus from acquisitions, primarily Heipha and Hycon in March 2011.
Sales of the Process Solutions business unit totaled € 1,046 million in 2012 (2011: € 956 million). This represents an organic growth of 5.3% driven by double-digit growth rates in Emerging Markets and Rest of World countries in addition to a solid mid-single digit growth rate in Europe. Organic sales growth in North America was slightly negative; however, adjusted for the above mentioned non-renewal of a supply contract for insulin, organic growth for the total business unit was in the high mid-single digit area. The busi-ness mainly benefited from higher volumes of biologically manufactured drugs, seeing strong demand for biosafety solutions, process systems hardware and single-use manufacturing technologies. In Novem-ber 2012, the business unit’s product portfolio in the area of cell culture media was strengthened with the takeover of Biochrom.
Merck Millipore | Sales growth components by business unit – 2012
€ million / change in % SalesOrganic growth
Exchange rate effects
Acquisitions/ divestments
Reported sales growth
Bioscience 454.6 2.0 5.5 0.6 8.0Lab Solutions 1,097.2 3.1 3.0 3.1 9.1Process Solutions 1,046.3 5.3 4.1 0.1 9.4
Acquisitions also contribute to growing sales in Lab Solutions
Process Solutions strongest growth driver of the division
82 Merck 2012Group Management Report
Merck Millipore

Corporate and Other
Corporate and Other comprises Group administration expenses for Group functions such as Finance and Accounting, Tax, Procurement, Communications, Investor Relations and Human Resources that cannot be directly allocated to the divisions. Corporate costs also include expenses for central, non-allocated IT functions and corporate IT projects related to the expansion and harmonization of IT systems within the Merck Group. As a result, Corporate and Other has no sales to report. Gains or losses on currency hedging also are reported in Corporate and Other.
Corporate and Other | Key figures
€ million 2012 2011 Change
Operating result (EBIT) –380.7 –183.4 –197.3EBITDA –372.7 –178.0 –194.7
Restructuring costs 74.3 – 74.3Integration / IT related costs 8.7 – 8.7Costs from discontinued businesses 79.1 30.5 48.6
EBITDA pre one-time items –210.5 –147.5 –63.0
During 2012, administration expenses of Corporate and Other increased 7.1% to € 130 million (2011: € 122 million) primarily due to higher bonus accruals. Other operating expenses totaled € 243 million (2011: € 54 million). This increase was mainly driven by expenses classified as one-time items. They include costs of € 79 million related to discontinued businesses, € 9 million in Integration/IT related costs and € 74 million related to restructuring initiatives. These restructuring costs can relate to Group functions or are linked to mixed legal entities. Accordingly, the increase in other operating expenses lowered EBIT and EBITDA to € –381 million (2011: € –183 million) and € –373 million (2011: € –178 million), respectively. Adjusted for one-time items, EBITDA pre one-time items was € –211 million (2011: € –148 million). This change of € –63 million was almost fully attributable to the net losses from currency hedging. Merck started to book the result of currency hedging under Corporate and Other as of January 1, 2012. Until end of 2011, this result was recorded under the respective divisions.
EBITDA pre one-time items lowered by currency hedging losses
83Merck 2012Group Management Report

Risk Report
Risks are inherent to entrepreneurial activity. We have put systems in place to identify risks at an early stage and minimize them by taking appropriate action. Currently no risks can be identified that could jeopardize the continued existence of the Merck Group.
Risk and opportunity management
Merck is part of a complex, global business world and is therefore exposed to a multitude of external and internal influences. Every business decision is therefore based on the associated risks and opportunities. Through our risk management activities, we recognize, assess and manage risks early on and implement appropriate measures to minimize them. Opportunity management is conducted in the operating units on the basis of the corporate strategy. More information can be found in the Report on Expected Develop-ments starting on page 91.
Within the context of the Group-wide risk management process, the division heads, managing directors and CFOs of Merck subsidiaries, and the heads of Group functions are specified as employees with responsibility for risks. Every six months, these executives assess their active risk status and report their entire risk portfolio to Risk Management. Risks are assessed based on their potential impact on EBIT and cash flow, and the likelihood of their occurrence. Significant changes in the assessment of already known risks as well as new, significant risks are reported at all times and communicated to the corporate bodies on an ad hoc basis. For the standard process, a lower limit for risk reporting is set at a value of € 5 million, and for the ad hoc process at a value of € 25 million. Risks below these limits are steered independently in the units. Within the scope of audits, Group Internal Auditing reviews, among other things, the performance of risk management processes within the units and, at the same time, the communication of relevant risks to Group Risk Management. In addition to the aforementioned bottom-up processes, Risk Management addresses potential risks and risk areas top-down. This process is based on independent analyses of both internal and external information. Moreover, assessing the effectiveness of risk-minimizing measures gained further importance in 2012. Key measures are monitored by Risk Management with regard to the planned implementation timeframe and the assumed risk-minimizing effect. Risk Management uses this information to determine the current risk portfolio for the Merck Group, reporting this to the Executive Board, the Supervisory Board and the Finance Committee twice a year.
Internal control system for the consolidated accounting process
The objective of the internal control system for accounting is to implement controls that provide assurance that the financial statements are prepared in compliance with the relevant accounting laws and standards. It covers measures designed to ensure the complete, correct and timely transfer and presentation of information that is relevant for the preparation of the consolidated financial statements and the manage-ment report of the Merck Group.
The control system is subject to continuous further development and is an integral component of the accounting and financial reporting processes in all relevant local units and Merck Group functions. With respect to the accounting process, the internal control system measures are intended to minimize the risk of material false statements in the consolidated accounting process of the Merck Group.
Group Internal Auditing conducts regular reviews
84 Merck 2012Group Management Report
Key toolsThe internal control system is geared to ensuring the accuracy of the consolidated accounting process and the preparation of compliant financial statements. The Group function Accounting & Subsidiaries centrally steers the preparation of the consolidated financial statements of Merck KGaA as the parent company of the Merck Group. This Group function defines the reporting requirements that all the Merck subsidiaries must meet as a minimum requirement. At the same time, this function steers and monitors the scheduling and process-related requirements of the consolidated financial statements. The Group-wide accounting guidelines form the basis for the preparation of the statutory financial statements of the parent company as well as of the German and foreign subsidiaries; the guidelines are adapted to reflect changes in the financial regulatory environment and are updated in accordance with internal reporting requirements. One of the requirements of the Group-wide guidelines is to present Group-internal business processes as the basis for proper settlement of intercompany balances. Additional controls have been implemented in the consolidation process.
Accounting & Subsidiaries also ensures the timely central management of changes to the equity holding structure and correspondingly adapts the Merck Group’s scope of consolidation. The individual companies have a local internal control system. Where finance processes are handled by a Shared Service Center, the internal control system of the Shared Service Center is additionally applied. They ensure that accounting complies with IFRS (International Financial Reporting Standards) and with the Merck Group accounting guidelines.
Accounting & Subsidiaries provides support to the local contacts and ensures a consistently high quality of reporting throughout the entire reporting process.
The accounting process is designed at all levels to ensure a clearly defined segregation of duties and assignment of responsibilities to the units involved in the accounting process at all times within the scope of continuous dual control.
For the assessment of balance sheet items, Accounting & Subsidiaries closely cooperates with Group Risk Management in order to correctly reflect potential balance sheet risks. For special issues, such as the evaluation of intangible assets and pension obligations, external experts are additionally involved where necessary. For the Group accounting process, Merck uses in most countries a standard SAP software tool. Via a detailed authorization concept to limit user rights on a need-to-have basis, the system contains both single entity reporting and the consolidated financial statements.
The effectiveness of Merck’s internal control system with regard to accounting and the compliance of financial reporting of the individual companies is confirmed by both the local managing director and the Chief Financial Officer by signing the single entity reporting. All the structures and processes described are subject to constant review by Group Internal Auditing based on an annual audit plan specified by the Executive Board. The results of these audits are dealt with by the Executive Board, the Supervisory Board and the Finance Committee.
The internal control system at Merck makes it possible to lower the risk of materially false accounting statements to a minimum. However, no internal control system – regardless of its design – can prevent a residual risk.
85Merck 2012Group Management Report
Risk Report

Business-related risks
Merck integrates its risk management system into the ongoing business planning processes. Potential negative developments, for example changes in customer demand or new political framework conditions, are identified, described and evaluated within the scope of the internal risk management process. We can, therefore, take countermeasures in a timely manner if any events lead to deviations from the business plan. Risks in connection with investment decisions are minimized by the use of detailed guidelines.
Total revenues and the economic success of the Merck Group depend on a large number of pharmaceutical and chemical products for various industries. This diversification lowers risk since the markets differ in their structure and economic cycles. This is also an expression of the Merck strategy to remain an integrated pharmaceutical, chemical and life science company.
Political and regulatory risksAs a global company, Merck faces political and regulatory changes in many countries and markets. In 2012, increasingly restrictive requirements were imposed in the pharmaceutical environment in terms of drug pricing, reimbursement and approval, a trend that can be seen in many countries. These requirements can negatively impact the profitability of our products and jeopardize the success of market launches and new approvals. Close communication with health and regulatory agencies serves as a preventive measure to avert risks. The destabilization of political systems, possible erection of trade barriers and monetary policy changes can lead to declines in sales in certain countries and regions. Diversification in terms of products, industries and regions serves to mitigate potential negative effects.
Research and development risksFor Merck, innovation is a major element of the Group strategy. Research and development projects can experience delays, expected budgets can be exceeded or targets remain unmet. Research and development are of special importance to the pharmaceutical business. Therefore, research and development projects are constantly monitored by a portfolio management system. In the course of portfolio management, we regularly evaluate and, if necessary, refocus research areas and all R&D pipeline projects. Sometimes development projects are discontinued after high levels of investment at a late phase of clinical development. Decisions – such as those relating to the transition to the next clinical phase – are taken with a view to minimizing risk. Furthermore, there is a risk that the regulatory authorities either do not grant or delay approval, which can have an impact on earnings. Additionally, there is the danger that undesirable side effects of a pharmaceutical product could remain undetected until after approval or registration, which could result in a restriction of approval or withdrawal from the market.
Product quality and availability risksMerck is exposed to product liability risks. These include complying with the highest quality standards in the production of pharmaceuticals (Good Manufacturing Practices) which is monitored by the regulatory authorities. Quality controls along the entire value chain minimize these risks. This starts with the qualification of our suppliers. Quality controls also include comprehensive quality requirements for raw materials, purchased semifinished products and plants, as well as long-term strategic alliances in the case of supply- and price- critical precursor products.
Merck minimizes business risks through its diversified product portfolio
86 Merck 2012Group Management Report
Risk Report

Financial risks
As a company that operates internationally and due to its presence in the capital market, Merck is exposed to various financial risks. These are primarily liquidity, default, and market-price risks; fluctuations in the valuation of pension obligations; and risks of changing fair values of tangible and intangible assets.
In order to ensure its continued existence, a company must be able to fulfill its commitments from operating and financial activities at all times. Merck therefore has a central Group-wide liquidity management process to reduce potential liquidity risks.
In addition, we have a € 2 billion syndicated multicurrency credit facility, which expires in 2014. This ensures Merck’s continuing solvency in case any liquidity bottlenecks occur despite the Group’s positive operating cash flow. As our loan agreements do not contain any financial covenants, these agreed lines of credit can be accessed even if Merck’s credit rating should deteriorate. In fiscal 2009, Merck set up a debt issuance program that forms the contractual basis for the issue of bonds. In 2010, the volume of this program was increased from € 5 billion to € 10 billion.
Default risks arise in connection with financial investments, loans and financing commitments as well as receivables in operating business. Due to the impact of the financial crisis in the eurozone, an increased default risk continues to exist. Merck has therefore reviewed all its positions with trading partners in the respective countries and has adjusted its default risks as necessary. Merck minimizes these risks by spreading its financial positions and by the associated active management of its trading partners. Significant financial transactions involving credit risk are only entered into with banks and industrial companies that have a good credit rating. In addition, Merck’s large banking syndicate – the existing credit line of € 2 billion was syndicated by 17 banks – reduces possible losses in the event of default. Nevertheless, the default of individual trading partners cannot be fundamentally excluded, even if they have an excellent credit rating.
Companies with international business operations in different currency and interest rate regions are inevitably exposed to currency and interest risks. Merck is also affected by these market price risks owing to its global group structure and the associated financial transactions, receivables and liabilities in operating business, as well as expected future cash flows from sales and costs in foreign currency. Merck therefore uses derivative financial instruments to minimize currency risks and financing costs caused by exchange rate or interest rate fluctuations. The exchange rate for financial transactions and for operating receivables and liabilities recognized in foreign currency is generally hedged. In certain cases, the company also hedges the exchange rate for anticipated sales and future costs recognized in foreign currency for a period of up to three years. (More information can be found starting on page 184 in the Notes to the Consolidated Financial Statements).
The values of individual items in the balance sheet are exposed to the risk of changing market and business circumstances and thus also to changes in fair values. The need for write-downs could significantly impact profit and lead to changes in balance sheet ratios. This applies in particular to the high level of intangible assets including goodwill, which have become significantly more important in the consolidated financial statements due to the acquisitions of Serono in 2007 and Millipore in 2010, as well as the related purchase price allocations. (More information can be found starting on page 160 under Intangible assets).
Merck has commitments in connection with pension obligations. The present value of these obligations can be significantly influenced by changes in the relevant valuation parameters, e.g. the interest rate or death probabilities. Pension obligations are regularly evaluated by preparing annual actuarial valuations. Part of these obligations is covered by the pension provisions disclosed in the balance sheet, while the other obligations are
87Merck 2012Group Management Report
Risk Report
externally funded. (More information can be found starting on page 171 in the Notes to the Consolidated Financial Statements). As far as pension obligations are covered by plan assets consisting of interest-bearing securities, shares, real estate, and other financial assets, decreasing or negative returns on these assets can adversely impact the value of the plan assets and thus result in further additions to pension provisions. We reduce the risk of fluctuations in the fair value of plan assets by a diversified investment strategy.
Assessments by independent rating agenciesThe capital market makes use of the assessments published by rating agencies in order to assist lenders in evaluating the risks of a financial instrument. Merck is currently rated by the agencies Standard & Poor’s and Moody’s, who raised their credit ratings for Merck in 2012. While Standard & Poor’s issued Merck an A-long-term credit rating with a stable outlook, Moody’s issued it a Baa1 rating with a stable outlook.
Legal risks
Merck is exposed to litigation risks. These include in particular risks in the areas of product liability, competition and antitrust law, pharmaceutical law, patent law, tax law, and environmental protection. As a research-based company, Merck has a valuable portfolio of industrial property rights, such as patents and brand names. These can become the target of attacks and infringements.
We are engaged in legal proceedings and government investigations, the outcome of which is currently not certain. We also continue to bear the risks from certain proceedings against companies of the Generics group that we sold to Mylan in 2007. Therefore, in this connection, Merck continues to be responsible for risks arising from cases concerning drug pricing in the United States. In connection with the divested Generics business, the European Commission opened administrative fine proceedings against Merck. It is alleged that Merck engaged in anticompetitive behavior in connection with the market launch of the product citalopram. In Germany, Merck is involved in antitrust proceedings concerning its exclusive distribution agreement with the laboratory wholesale distributor VWR International. Owing to a decision by the German Federal Antitrust Office, Merck is obliged to supply a number of products from its Laboratory business to other laboratory wholesale distributors in Germany. In the United States and Israel, certain risks exist with respect to patent rights and the related licenses and agreements. These cases could have a considerable impact on the financial and earnings position.
The company has taken all possible measures to protect its own legal position. To the extent we deemed it necessary in individual cases, we have set up provisions for risks in the event of an unfavorable outcome of judicial proceedings and government investigations. Further information on legal proceedings can be found in the notes to the consolidated financial statements. Generally, Merck strives to minimize and manage its legal risks. We have taken the necessary precautions to identify threats and defend our rights where necessary.
A compliance program applies for our employees worldwide, which enjoins them to comply with laws and guidelines, as well as provides them with the relevant training and support. The core of the program is the Merck Code of Conduct, which defines ethical behavior guidelines.
Insofar as possible and practical, the company limits liability and damage risks through insurance cov-erage, the type and scope of which is continually adjusted to current requirements.
Credit ratings raised in 2012
88 Merck 2012Group Management Report
Risk Report
Human resources risks
Merck’s future growth is highly dependent on its innovativeness. Therefore, the expertise and engagement of employees in all sectors in which Merck operates are crucial to the success of the company.
The markets relevant to Merck are characterized by intensive competition for qualified specialists and by demographic challenges. Therefore sourcing, recruiting and retaining specialists and talent at Merck is one of the key priorities for the company.
We address these challenges, among other things, by globally implementing integrated processes, such as the talent process, in which we have been investing for a number of years. As part of the global Talent & Succession Management process, Merck analyzes for example current and future capability gaps for the business. Merck’s sourcing strategy is aligned with the outcomes of the Talent & Succession Management process. Another example of aligning the HR strategy to the needs of the business is the Total Rewards Policy, through which we ensure that we offer competitive compensation in all relevant markets.
In addition, Merck is investing in a global employer brand, which communicates the Merck Values and the unique employer value proposition that Merck provides to its current and future employees.
Merck regularly measures the engagement of its employees. The results of the employee survey give managers and employees important indications of current challenges for Human Resources. In this way, Merck can develop improvements that will motivate employees and help to retain them.
Information technology risks
Merck uses a diversity of IT systems and processes in order to optimally focus and adequately support its globalization. This involves a number of potential risks.
Risks resulting from the complexity of internal and external requirementsIT risks with an impact on business results occur when information is not available in time, or is erroneous or unintentionally disclosed, or when the mapped processes have been implemented in IT systems in a way that is too inflexible, too complex or even illegal. Security gaps in IT solutions and insufficient contingency planning measures can quickly become incidents that affect the entire company.
Data protection violations owing to incorrect authorizations can create a negative external impression. The growing connectivity of IT landscapes and the increasing dependency on IT make it necessary for companies to invest heavily in maintenance and enhancement. In conjunction with constantly new legal requirements, data processing represents an increasingly time-consuming and costly activity. As the complexity of the IT landscape increases, so do the potential risks.
89Merck 2012Group Management Report
Risk Report
Risks resulting from external threatsWorldwide, external threats are becoming increasingly professional in nature, with the trend moving toward targeted industrial espionage and sabotage. In addition, cyberattacks are being used as a means of gaining attention and of protest. This is resulting in risk scenarios for Merck such as the failure of central IT systems, the disclosure of confidential research and business development data, the manipulation of IT systems in chemical process control, an increased burden or adverse impact on IT systems as a result of virus attacks, the temporary hijacking of exposed systems by computer hackers, and the resulting potential revocation of drug registrations due to deficient validation of the relevant IT systems.
Risk minimization strategyMerck has been generally addressing and minimizing these risks for several years by means of a certified information protection management system based on ISO 27001. This comprises redundant structures of technical components, networks and sites, as well as suitable, tested contingency measures. Thus Merck ensures the necessary availability of business-critical application systems and access to business-relevant data. Globally valid security guidelines are in place for the entire Merck Group. They include appropriate organizational and technical precautions for access control, access rights, virus protection and data protection. The efficacy of these measures is continuously monitored in connection with the information protection management system and reviewed by Group Internal Auditing as well as external auditors. A further process ensures that IT risks are evaluated and appropriate measures taken. Based on the measures taken, we assume that the likelihood of a serious IT risk occurring is low.
Environmental and safety risks
Merck is a company with global production operations and is exposed to risks of possible damage to people, goods and its image. We minimize the risks to people and the environment by means of auditing, advising and training in matters of environmental protection as well as occupational health and safety. In order to ensure the continuity of plant and equipment, Merck monitors these risks both at our own sites as well as at suppliers and contract manufacturers. By adhering to high technical standards, our rules of conduct, and all legal requirements in environmental protection and occupational health and safety, Merck ensures the preservation of its goods and assets.
Management assessment of the overall risk situation
Currently no risks can be identified that could jeopardize the continued existence of the Merck Group. This is the finding of this Risk Report, which was prepared in accordance with German Accounting Standard 5.
Global IT security guidelines
90 Merck 2012Group Management Report
Risk Report

Report on Expected Developments
Forecast for overall global economic developmentThe Organization for Economic Cooperation and Development (OECD) assumes that the GDP for its 34 member countries will grow by 1.4% in 2013 followed by a 2.3% increase the year after. The eurozone is forecast to remain nearly flat at –0.1% in 2013 and to grow by 1.3% in 2014. For the United States, the OECD predicts a 2.0% GDP increase in 2013 and another 2.8% rise in 2014.
For Brazil, the OECD expects GDP to grow 4.0% in 2013 and 4.1% a year later. China is forecast to show GDP growth of 8.5% in 2013 and a further 8.9% in 2014 and for India the experts assume a GDP increase of 5.9% in 2013 and 7.0% the year after.
On the other hand, the OECD cites a significant drop in confidence for its outlook. This lack of confidence largely reflects insufficient or ineffective policy responses to reach consensus on measures to address the global economic crisis. The OECD also states that the eurozone still poses the greatest threats to the world economy. The crisis in the eurozone is being sustained by three negative feedback loops: solvency fears for banks, break-up fears for the monetary union and worries surrounding government debt. Progress towards a fully fledged banking union is essential to complete the architecture of the eurozone, the OECD says. This would involve supervision at eurozone level and effective cross-border crisis resolution procedures.
For the United States, the OECD sees current policies appropriate as the employment outlook is improving and inflation expectations are well anchored.
If serious downside risks were to materialize, further policy support would be essential. These downside risks include the eurozone crisis as the largest one and excessive budgetary tightening in the United States (the “fiscal cliff”) as well as geopolitical risks.
The International Monetary Fund (IMF) considers downside risks to be higher than previously. A key question in its forecast is whether the global economy is just hitting another bout of turbulence or whether the current slowdown has a more lasting component. Its forecast is based on European and U.S. policymakers dealing proactively with their major short-term economic challenges. Thus, global activity is projected to re-accelerate. For the medium term the IMF notes that important questions remain about how the global economy will operate in a world of high government debt and whether emerging market economies can maintain their strong expansion while shifting further from external to domestic sources of growth.
General forecast for the pharmaceutical sectorThe pharmaceutical market research firm IMS Institute expects worldwide growth of pharmaceuticals to be between US$ 220 billion to US$ 250 billion from 2012 to 2016. Growth will be driven by emerging markets primarily due to increased access to medicines. These markets will nearly double in size and contribute US$ 150 billion to US$ 165 billion to worldwide pharmaceutical growth in spending.
On the contrary mature markets such as the United States, the top five markets in Europe and Japan will not contribute as much to the overall growth. However, as a consequence of the healthcare reforms by the Obama administration, an increase in spending in the healthcare sector is expected in 2013 and 2014. The U.S. market is forecast to grow by 1% to 4% or US$ 35 billion to US$ 45 billion through 2016.
The top five European markets will continue to suffer from austerity measures and only grow by 1% to 2% through 2016. Japan is expected to see growth rates between 1% and 4% until 2016.
According to the IMS Institute, the United States is set to remain the leading market worldwide by 2016, followed by China, which is expected to replace Japan in second place. Brazil is forecast to move up from sixth to fourth place in 2016, followed by Germany, which currently ranks fourth.
Slight global economic growth expected
91Merck 2012Group Management Report
Evaluate Pharma, another pharmaceutical industry market research firm, forecasts worldwide prescription drug sales to grow by nearly 3% CAGR (compound annual growth rate) through 2018 to reach a volume of US$ 885 billion. The experts assume that the worldwide market will grow by 3.3% to US$ 732 billion in 2013 and another 3.7% to US$ 760 billion in 2014.
The IMS Institute expects the number of drugs to be approved for marketing to increase to an average between 32 and 37 each year through 2016.
General forecast for the chemical industryIn a recent publication, the German Chemical Industry Association VCI (Verband der Chemischen Industrie) expects world chemical output to increase by 3.5% in 2013. According to this publication Europe’s chemicals industry is forecasted to increase production by 1.0%, whereas the United States is expected to increase its chemicals output by 1.5%, Japan by 1.5%, South Korea by 3.0%, India by 4.5% and China by 9.5%.
The European Chemical Industry Council Cefic (Conseil Européen de l’Industrie Chimique ) forecasts a slight expansion of 0.5% in European chemicals output in 2013. This outlook for the overall chemical sector, excluding pharmaceuticals, is based on an optimistic assumption of modest growth in every quarter. Consumer products, excluding pharmaceuticals, will show a growth rate of only 1.0% in 2013.
The VCI assumes that the German chemical production (excluding pharmaceuticals) is set to rise 1.5% in 2013. Output of fine and specialty chemicals is expected to increase in 2013 by 1.5%, the production of pharmaceuticals by German companies is forecast to increase by 2.5%, according to the VCI. Sales in 2013 should increase by 2.0% to € 188 billion (including pharmaceuticals). China, which currently ranks 11th in terms of German chemical industry exports, is expected to increase its importance continuously, the industry body says.
Forecast for sales and operating result of the Merck GroupOverall our forecast assumes a moderate increase in energy and raw material prices, as well as increas-ing personnel costs. Since we produce specialty chemicals, the volatility of oil prices does not have a direct impact on our business. As a company that operates globally, Merck is exposed to a variety of foreign exchange risks, arising especially from the U.S. dollar. Targeted hedging measures are taken to offset these risks to a certain degree.
Against the background of expected and the aforementioned overall economic developments, the Executive Board assumes that sales of the Merck Group will show moderate organic growth in 2013 and 2014. We do expect, however, that as in the last two years, all our businesses operating in the European Union will be exposed to pricing pressure as a result of structural problems such as pressure on public funding deficits, governmental indebtedness and increased competition. In Performance Materials, some erosion of the high market share in the Liquid Crystals (LC) business cannot be excluded. All of this could have a negative impact on our sales. With regard to our main performance indicator, EBITDA pre, the Executive Board expects that the Merck Group will again be able to post an increase in 2013 and 2014 resulting from net savings achieved via the “Fit for 2018” efficiency program. Reported EBITDA will increase markedly in 2013 since the vast majority of one-time costs of the efficiency program were already incurred in 2012. We continue to expect a tax ratio of around 25% in both 2013 and 2014.
Growth in the pharma-ceutical and chemical industry driven by emerging markets
Moderate sales increase expected for the Merck Group, EBITDA pre to improve thanks to the effects from the efficiency program
92 Merck 2012Group Management Report
Report on Expected Developments
We expect that free cash flow will again be high in 2013 and 2014. The majority of the cash payments for the efficiency program will be due in 2013, which will lead to around € 300 million in additional cash payments in comparison to 2012. The financial liabilities of the Merck Group should further decrease in the coming years, also as a result of our high free cash flow generation. Capital spending on property, plant and equipment is expected to increase to around € 450 million in 2013 and among others includes capital investments in our efficiency prgram. In 2014, the investments should remain at the same level. We expect the equity ratio to increase slightly and to remain at a high level in both 2013 and 2014.
Apart from Europe, Merck considers Brazil, China, India, Japan, Mexico, South Korea, and the United States to be strategically important. Details on the respective business forecasts and expected developments for these countries can be found in the forecasts for the divisions.
Forecast for the Merck Serono divisionCancer and multiple sclerosis are of particular importance to the Merck Serono division as they are diseases for which we offer patients therapeutic options. In the diabetes field, our product Glucophage ® is the drug of choice for first-line treatment of type II diabetes. The IMS Institute states that biologics will continue to gain in importance. It is forecast that seven of the top ten medicines will be of biologic origin by 2016. The Merck Serono products in the fields of oncology and multiple sclerosis are biologics and account for large proportion of the division’s sales. Evaluate Pharma expects biologic drugs to attain a market share of 21% in the coming year and 22% in 2014. The research firm also estimates that oncology drugs will remain by far the number-one therapeutic area in its forecast for 2018. The market researchers state a 7.1% CAGR (compound annual growth rate) to a volume of US$ 104.1 billion from US$ 64.6 billion in 2011 for oncology. The second biggest therapeutic area is forecast to remain anti-diabetes drugs with 7.8% CAGR and a total volume of US$ 58.2 billion by 2018.
Therapies to treat multiple sclerosis are said to rank twelfth with a volume of US$ 15.1 billion and a growth rate of 2.6% (CAGR).
The IMS Institute reinforces the aforementioned forecasts. They predict oncology drugs to reach a volume of US$ 83 billion to US$ 88 billion by 2016 and by this be the leading therapeutic area followed by antidiabetics. This market is expected to reach a volume of US$ 48 billion to US$ 53 billion by 2016. Drugs for patients suffering from multiple sclerosis are expected to rank thirteenth and reach a market volume of US$ 14 billion to US$ 16 billion by 2016.
For the Merck Serono division, we expect a slight, organic sales increase in 2013 and 2014, however, slower than in 2012. We currently assume no major new product launch in our forecast.
The efficiency program should lead to further cost savings and thus enable further EBITDA pre improve-ment in both years. In 2013 and 2014 we still expect one-time costs related to our efficiency program which will be lower compared to 2012. Around € 150 million are expected to be incurred in 2013, decreasing to around € 50 million in 2014. Free cash flow will be negatively affected by the cash payments in relation to the efficiency program, although in 2013 it may not reach the levels of 2012. As the cash payments for the efficiency program are expected to decrease in 2014, cash flow should improve again in 2014.
93Merck 2012Group Management Report
Report on Expected Developments

Divisional EBIT includes the amortization of intangible assets with definite useful lives that were measured at fair value within the scope of the Serono acquisition. Amortization is expected to amount to around € 600 million in 2013 and to decline to around € 570 million in 2014 owing to the expiration of the useful lives of several assets. Marketing and selling expenses, administration expenses and R&D costs should slightly decrease in 2013 and 2014 as a result of the efficiency program. Total annual net savings of € 300 million should be achieved by the end of 2014. R&D spending is contingent upon the investment that will be made in the Biosimilars area.
Merck Serono assumes that sales of Rebif ®, its top-selling product, will stagnate in 2013 and start to decline in 2014 as a result of increased competitive pressure. Sales of the oncology drug Erbitux ® will only slightly improve or even stagnate in 2013 and 2014, also due to increased competition. For the other franchises such as Fertility, Endocrinology and CardioMetabolic Care, we also expect to see slight growth in both 2013 and 2014. The markets of Asia and Latin America will remain our geographic growth drivers in the coming years. Opportunities in Europe and the United States, Merck Serono’s main sales markets today, will result from life cycle management as well as the development of new dosage forms. Royalty income will decline to around € 180 million to € 200 million by 2014.
Ongoing high levels of national debt in some countries and the associated potential reductions in health care spending could lead to declines in sales of some products. Moreover, litigation has been wide-spread in the pharmaceutical industry for years and this has also adversely impacted Merck Serono in the past. We cannot rule out the possibility of this also being the case in the coming years.
Forecast for the Consumer Health divisionOur Consumer Health division is committed to enhancing the quality of people’s lives around the world with innovative over-the-counter health care solutions. According to the market research firm Nicholas Hall, the global volume of the over-the-counter drugs market is expected to rise by 4.6% to a volume of nearly US$ 92 billion worldwide in 2013. For the year thereafter, further growth of 5.1% is expected to yield a market volume of approximately US$ 97 billion.
Asia-Pacific (excluding Japan) is forecast to be the biggest growth contributor with a growth rate of 7.7% in 2013 and 7.5% in 2014. Good growth is also expected in Latin America with an increase of 6.4% in 2013 and about 6.8% in 2014. The market researchers forecast a growth rate for Europe of 3.6% in 2013 and 4.1% in 2014. The market for over-the-counter drugs in North America is projected to increase by 2.6% in 2013 and by a further 4.1% the following year.
Merck assumes that the sales of its Consumer Health division will be stable in 2013 and return to growth in 2014. The sales development reflects Merck’s decision to deprioritize brands, stock keeping units (SKUs) and markets with low or negative profitability and the announced closure of its UK manufacturing site, as well as the discontinuation of a portion of its UK-sourced portfolio of products. This lowers the sales base of the business especially in Europe – which over time will be rebuilt with growth of strategic brands in top markets. In both 2013 and 2014, the focus will continue to be on raising profitability of the division. Therefore, EBITDA pre is expected to slightly increase in 2013 and 2014 and the business expects an improved EBITDA pre margin (as % of sales) of 15% – 17%. This will be achieved by strict cost control in all operating areas as well as by focusing on the growth of profitable elements of the portfolio of brands and markets. Most of the related one-time costs were already taken in 2012, approximately € 10 million to € 15 million should still be incurred in 2013. In parallel to the increase in EBITDA pre, free cash flow is expected to develop positively in 2013 and 2014.
Consumer Health focusing on profitable products to improve its EBITDA pre
94 Merck 2012Group Management Report
Report on Expected Developments

In 2013 and 2014, the opportunities and risks of the Consumer Health division will be closely linked to the successful marketing of the existing product portfolio and a strengthening of faster growing geographies. The focus here will be placed equally on the strategic brands that have a global and regional presence, as well as some strong local brands. Increasing the profitability of existing products and the overall portfolio remains one of the main priorities. Geographically, Consumer Health remains committed to Europe – its core market – while allocating more resources towards strengthening its presence in growth markets in Asia, Latin America and eastern Europe. In doing this, the Consumer Health division faces risks especially from changes in health care policy framework for food supplements, risks associated with key emerging markets like Venezuela, Mexico and Brazil and consumer purchasing behavior, factors that could negatively impact the business.
Forecast for the Performance Materials divisionMerck is the world’s leading manufacturer of liquid crystals for liquid crystal displays. Display Search, a market research firm for the display sector, forecasts that the size of liquid crystal displays continues to increase by 7% in 2013 and 8% in 2014. The main growth will be driven by an increase in average TV display size and the tablet computer market.
One major market of our effect pigments business within the Performance Materials division is auto-motive coatings. The German automobile industry association VDA (Verband der Automobilindustrie) expects the world market for automobiles to grow by 3% to 70 million units in 2013. Growth is expected in the United States and China. For the United States, the VDA expects a 5% increase, while China is seen to increase demand by 6% On the other hand, the automotive marked in western Europe and Japan are predicted to decline by 3% each.
After a very strong 2012 in the Performance Materials division, we expect a slight organic sales decline in 2013. For 2014 we expect a moderate organic increase again.
In 2013, EBITDA pre will still remain high, but at best is expected to be slightly below the very strong level of 2012. Due to the more volatile nature of the business, it is difficult to provide guidance on the longer term momentum. Should we be able to launch new technologies in the following years, the division strives to develop EBITDA pre accordingly. Should this not materialize, 2014 might not reach a higher EBITDA pre level compared to 2013 and our mid-term guidance remains unchanged.
The division assumes that the Liquid Crystals business unit will maintain its market leadership position in LC mixtures in the coming years, but might face increasing competitive pressure compared to the extraordinary position it held in 2012.
Price pressure on LC mixtures is however expected to continue, driven by competition. Further growth should come from new LC mixtures for innovative LCD technologies, but we assume no major new technolo-gies to be introduced in either 2013 or 2014. To maintain our leadership in innovative LC technologies, R&D activities will continue at a high level. This also applies to promising future businesses with reactive mesogens, OLEDs and LED materials, which will account for an above-average share of the growth achieved by the Performance Materials division. We are prepared for the dynamic growth of the Chinese display market and have invested locally to participate in it.
In addition, the Performance Materials division expects that the Pigments & Cosmetics business unit will grow only slightly, but will be able to increase its profitability due to the continued focus on cost management.
Free cash flow in 2013 and 2014 will remain at the elevated levels of the previous years. This will be ensured by carefully managing capital spending and working capital.
Liquid Crystals to maintain its leading market position
95Merck 2012Group Management Report
Report on Expected Developments

Forecast for the Merck Millipore divisionMerck Millipore is a leading supplier to the life science industry. Its products and services are used for customers in the research, development and production of biotech and pharmaceutical drugs as well as general laboratory applications.
Evaluate Pharma forecasts that the research and development spending in the pharmaceutical industry, which encompasses the main customer base of Merck Millipore, will grow by an average of 1.5% per year from 2011 to 2018. The firm predicts R&D costs will total US$ 136 billion in 2013 and US$ 138 billion in the year after.
In addition to the overall growth of the pharmaceutical industry, Evaluate Pharma also states that biotechnology products will lead the growth with an expected CAGR of 6.2% to 2018. The aforementioned area is a field where Merck Millipore markets products and services to accompany its customers across the entire product development process from drug discovery to production and thus will benefit from the above market growth rates. Small molecule drugs, an area where Merck Millipore offers products to enable research and development, still account for the largest proportion of pharmaceutical drugs and are set to grow 1.0% CAGR until 2018.
Besides the development of the spending in the pharmaceutical industry, the future development of Merck Millipore is dependent on the demand for laboratory chemicals. Market researchers from Frost & Sullivan expect the market volume of laboratory products to grow by 3.5% in 2013.
The Merck Executive Board expects that the Merck Millipore division will achieve moderate organic sales growth in 2013 and 2014. EBITDA pre will continue to grow in line with sales in both years. The division’s EBIT includes amortization of intangible assets that were measured at fair value in connection with the Millipore acquisition. These are expected to amount to around € 190 million in 2013 and 2014. Innovations and new product launches will be an area of focus for the division’s future growth. For this reason, R&D costs are expected to rise further in 2013 and 2014. We will incur one-time costs related to efficiency measures in both 2013 and 2014, primarily affecting production and logistics. Despite higher capital spending on property, plant and equipment in 2013 and 2014 to support growth, free cash flow will grow in the coming years driven by close monitoring of inventories.
The Bioscience business unit of Merck Millipore develops products that help scientists to better under-stand complex biological systems and to discover and develop new therapies. The extensive product portfolio of this business unit is well positioned to grow in the dynamic market, where the innovation and launch of new products is a key component of the development of sales. Parts of the Bioscience business will continue to face challenges due to the slowdown in global economic growth in conjunction with cuts in government research budgets which is currently causing the life science market to soften. We see potential risks associated with the ongoing consolidation and restructuring of the pharmaceutical industry.
The Lab Solutions business unit supplies a broad portfolio of innovative, reliable, high-quality products for general laboratory applications, including water systems, and is expected to grow modestly.
The opportunities for the Process Solutions business unit, which supplies consumables and services for major pharmaceutical and biotech manufacturing companies, lie in a comprehensive product and service portfolio and a geographic presence in future growth markets. A potential volume increase could stem from demand for new products and new service offerings.
Moderate growth in sales and EBITDA pre expected for Merck Millipore
96 Merck 2012Group Management Report
Report on Expected Developments

Apart from the established markets of Europe and North America, the geographic growth drivers of the Merck Millipore division will be China and India, as well as markets in Latin America.
Risks for the division could also arise from the cost pressure which dominates the life science, biotech and pharmaceutical industry. Overall, we aim to achieve further earnings growth in an uncertain market environment by offering a broad product portfolio, aligning our business globally, continuing to bring innovative products and solutions in the market and leveraging our regional strengths.
SummaryIn view of the aforementioned expected economic developments, overall the Executive Board predicts a more stable economic environment and a slightly positive outlook on the world economy.
Sales of the Merck Group are expected to grow organically at a moderate pace in both 2013 and 2014. Merck assumes neither any major technology shifts in its chemical businesses nor any major new product launches in the pharmaceutical business in either year. On a reported basis, a stronger euro may lead to negative currency effects in comparison to 2012.
At Group level, EBITDA pre one-time items (EBITDA pre) will increase faster than sales as a result of net savings realized from the Group-wide efficiency program.
At net income level, the comparably higher EBITDA pre and lower one-time costs should lead to a significant increase in 2013 and 2014.
For fiscal 2012, we intend to maintain our existing, long-term dividend policy and will propose to the Annual General Meeting the increased payment of a dividend of € 1.70 per share.
Merck has an extensive risk and opportunity management system, which is described in the Risk Report (page 84 et seq.). Relative to the forecast period of two years published here, we mainly see business-related opportunities and risks. Owing to Merck’s diversification and broad product portfolio, a very different spectrum of important opportunities and risks results for each individual division. The relevant explanations are given for the respective divisions in the Management Report.
Our forecasts for Merck take into account the company’s weighing up of risks and opportunities in accordance with our operational plans and medium-term assumptions. However, possible acquisitions, divestments and other exceptional items are not included.
Significant increase of net income for the Merck Group expected
97Merck 2012Group Management Report
Report on Expected Developments

The following information is provided in accordance with Section 315 (4) of the German Commercial Code and the explanatory report pursuant to Section 176 (1) sentence 1 of the German Stock Corporation Act (AktG).
As of the balance sheet date, the company’s subscribed capital is divided into 64,621,125 no-par value bearer shares plus one registered share. Each share therefore corresponds to € 2.60 of the share capital. The holder of the registered share is E. Merck Beteiligungen KG. It is entitled and obliged to appoint one-third of the members of the Supervisory Board representing the limited liability shareholders. If the holder of the registered share is a general partner, he or she has no such right of appointment. The transfer of the registered share requires the company’s approval. The approval is granted at the sole discretion of the personally liable general partner with an equity interest, namely E. Merck KG.
On December 31, 2012, the following shareholders owned direct or indirect investments exceeding more than 10% of the voting rights: BlackRock HoldCo 2, Inc., Wilmington, DE, USA and BlackRock Financial Management, Inc., New York, NY USA.
According to the Articles of Association of Merck, the general partners not holding an equity interest who form the Executive Board are admitted by E. Merck KG with the consent of a simply majority of the other general partners. A person may only be a general partner not holding an equity interest if he or she is also a general partner of E. Merck KG. In addition, at the proposal of E. Merck and with the approval of all general partners not holding an equity interest, further persons who are not general partners not holding an equity interest may be appointed to the Executive Board. The Articles of Association can be amended by a resolution of the General Meeting that requires the approval of the general partners. The resolutions of the General Meeting are, notwithstanding any mandatory statutory provisions to the contrary, adopted by a simple majority of the votes cast. Where the law requires a capital majority in addition to the voting majority, resolutions are adopted by a simple majority of the share capital represented in the vote. The Articles of Association specify the authorized share capital. The Executive Board is authorized, with the approval of the Supervisory Board and of E. Merck KG, to increase the share capital on one or several occasions until April 3, 2014 by up to a total of € 56,521,124.19 by issuing new shares against cash or contributions in kind. The Executive Board is authorized, where the authorized capital is utilized with the approval of the Supervisory Board, to exclude the limited liability shareholders’ subscription rights in the case of a capital increase of up to 10% of the share capital by way of the issue of new shares against cash contributions if the issue price of the new shares is not materially lower than the stock market price. In addition, with the approval of the Supervisory Board, the subscription right of the shareholders can be excluded in order to enable E. Merck KG to exercise its right pursuant to Article 32 (3) of the Articles of Association to participate in a capital increase by issuing shares or freely transferable share subscription rights. Lastly, with the approval of the Supervisory Board, the subscription can also be excluded in order to enable E. Merck KG to exercise its right pursuant to Article 33 of the Articles of Association to convert its equity interest into share capital. The Articles of Association also encompass contingent capital. Accord-ingly, the share capital is contingently increased by up to € 66,406,298.40 divided into 25,540,884 shares. The contingent capital increase serves to grant exchange rights to E. Merck KG in accordance with Article 33 of the Articles of Association to enable the conversion of its equity interest. The company is not author-ized to acquire its own shares.
The company has not entered into any material agreements subject to a change of control pursuant to a takeover offer nor has it concluded any compensation agreements with the members of the Executive Board or employees in the event of a takeover offer.
Subsequent EventsSubsequent to the balance sheet date, no further events of special importance occurred that could have a material impact on the financial position and results of operations of the Merck Group.
Report in accordance with Section 315 (4) of the German Commercial Code (HGB)
98 Merck 2012Group Management Report

126
099
# 03 Corporate Governance
101➝ Statement on Corporate Governance121➝ Report of the Supervisory Board 124➝ Objectives of the Supervisory Board with respect to its composition
Merck 2012
Corp
orat
e Go
vern
ance
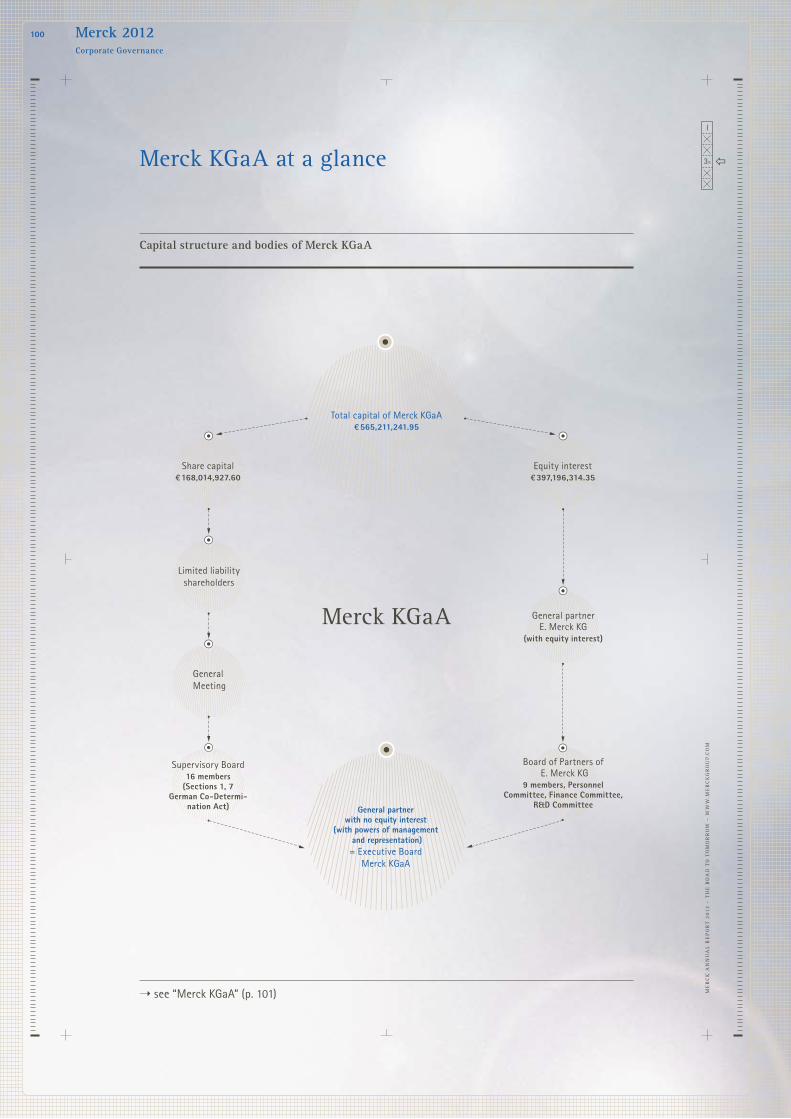
3/5
I
Merck KGaA at a glance
Capital structure and bodies of Merck KGaA
General partner E. Merck KG
(with equity interest)
Board of Partners of E. Merck KG
9 members, PersonnelCommittee, Finance Committee,
R&D Committee
Total capital of Merck KGaA€ 565,211,241.95
Share capital€ 168,014,927.60
Equity interest€ 397,196,314.35
Limited liability shareholders
General Meeting
Supervisory Board16 members
(Sections 1, 7 German Co-Determi-
nation Act) General partner with no equity interest
(with powers of management and representation)= Executive Board
Merck KGaA
Merck KGaA
➝ see “Merck KGaA” (p. 101) ME
RC
K A
NN
UA
L R
Ep
oR
t 20
12 –
th
E R
oA
d t
o t
oM
oR
Ro
w –
ww
w.M
ER
CK
gR
oU
p.C
oM
100 Merck 2012Corporate Governance
Corp
orat
e Go
vern
ance

The Statement on Corporate Governance contains the Statement of Compliance, relevant information on practices within the company as well as a description of the procedures of the corporate bodies.
Joint Report of the Executive Board and the Supervisory Board according to section 3.10 of the German Corporate Governance Code including Statement of Compliance
The German Corporate Governance Code is geared exclusively toward the conditions found in a German stock corporation (Aktiengesellschaft) and not toward a corporation with general partners (Kommanditgesellschaft auf Aktien) such as Merck KGaA. Merck KGaA has resolved to apply the Code logically to serve the interests of its shareholders. In order to enable shareholders to compare the situation at other companies more easily, we base corporate governance on the conduct recommendations made by the Code Commission relating to management and supervision (governance) and forego having our own, equally permissible, code. The recommendations of the Code, the intent and meaning of which are applied, were complied with in the period between the last Statement of Compliance and June 14, 2012, i.e. during the period of validity of the version of the Code dated May 26, 2010, with one exception, and since the change in the Code announced on June 15, 2012 with two exceptions. In the future, the recommendations of the Code will again be complied with, subject to the approval of the General Meeting. Further details can be found on page 103.
For a clearer understanding, the following gives a general explanation of the Kommanditgesellschaft auf Aktien (KGaA) company form. The specific situation at Merck is then described and additional references are made to the General Meeting and shareholder rights.
Corporation with general partnersThe corporation with general partners is a company that constitutes a separate legal entity in which at least one partner has unlimited liability with regard to the creditors of the company (general partner) and in which the other shareholders are not personally liable for the obligations of the company (limited shareholders) (section 278 (1) of the German Stock Corporation Act – hereinafter referred to as “AktG”). It is therefore a hybrid of an Aktiengesellschaft (German stock corporation) and a Kommanditgesellschaft (limited partnership) with a focus on German stock corporation law. Distinctive differences to the Aktiengesellschaft include the presence of general partners, who essentially also manage the company’s business activities, the absence of a management board, and the restriction of rights and obligations of the supervisory board (see page 116 for a description of the supervisory board procedures). This legal form also involves special features with regard to the General Meeting. For example, many of the resolutions made require the consent of the general partners (section 285 (2) AktG), particularly also the adoption of the annual financial statements (section 286 (1) AktG). A large number of the conduct recommendations contained in the Code, which is geared toward Aktiengesellschaften, can therefore only be applied to a KGaA as appropriate.
Merck KGaAThe general partner E. Merck KG holds around 70% of the total capital of Merck KGaA (equity interest); the shareholders hold the remainder, which is divided into shares (share capital). E. Merck KG is excluded from the management of business activities. The general partners with no equity interest (Executive Board) manage the business activities. Nevertheless, due to its substantial capital investment and unlimited personal liability, E. Merck KG has a strong interest in the businesses of Merck KGaA operating efficiently and
See diagram on page 100
Statement on Corporate Governance
101Merck 2012Corporate Governance

in compliance with procedures, and exercises its influence accordingly. Merck KGaA’s participation in the profit/loss of E. Merck KG in accordance with Articles 26 et seq. of the Articles of Association further harmonizes the interests of the shareholders and of E. Merck KG.
E. Merck KG appoints and dismisses the Executive Board. In addition, E. Merck KG has created bodies – complementing the expertise and activities of the Supervisory Board – to monitor and advise the Executive Board. This task applies primarily to the Board of Partners of E. Merck KG. Based on the provisions of the German Stock Corporation Act, the Articles of Association of Merck KGaA and the rules of procedure of the various committees, Merck KGaA has a set of rules for the Executive Board and its supervision that meet the requirements of the Code. The investors, who bear the entrepreneurial risk, are protected as provided for by the Code.
The General Meeting of Merck KGaAThe seventeenth General Meeting of Merck KGaA was held in Frankfurt am Main, Germany, on April 20, 2012. At 63.5%, the proportion of share capital represented at the meeting was stable, significantly exceeding the proportion of 56.6% in 2011.
In particular, the Annual General Meeting passes resolutions concerning the approval of the annual finan cial statements, the appropriation of net retained profit, the approval of the actions of the Executive Board members and the Supervisory Board members, as well as the choice of the auditor. At the same time, the General Meeting has the power to pass resolutions concerning changes to the Articles of Association.
The shareholders of Merck KGaA exercise their rights at the General Meeting. They may exercise their voting rights personally, through an authorized representative, or through a proxy appointed by the company. All the documents and information concerning upcoming General Meetings (including a summary explanation of shareholder rights) are posted on our website. Moreover, the General Meeting is webcast live on the Internet from its commencement until the end of the speech by the Chairman of the Executive Board. The introductory speeches by the Chairman of the Executive Board and the Chairman of the Supervisory Board are recorded in order to make them available to interested members of the public at any time after the meeting. In this way, we are satisfying the high transparency requirements of the Merck Group.
102
Statement on Corporate Governance
Merck 2012Corporate Governance

Statement of ComplianceThe Executive Board and the Supervisory Board issued, in accordance with section 161 AktG, the following statement of compliance with the recommendations of the Government Commission German Corporate Governance Code:
“Declaration of the Executive Board and the Supervisory Board of Merck KGaA on the recommendations of the Government Commission German Corporate Governance Code pursuant to section 161 AktG.
Since the last statement of compliance on February 24, 2012, the Merck Group has complied with the recommendations of the Government Commission German Corporate Governance Code in the version dated May 26, 2010 and published in the official section of the German Federal Gazette during its period of validity with the following exception:
Contrary to section 5.4.1 sentence 2 of the Code, an age limit is not taken into account when proposing candidates for election to the Supervisory Board pursuant to the published objectives of the Supervisory Board. The age of Supervisory Board members is not a criterion for their qualifications and competence. Moreover, we do not wish to forgo the many years of experience of Super visory Board members.
During the period from June 15, 2012 to the issuance of this Statement of Compliance, the recommendations of the Government Commission German Corporate Governance Code in the version dated May 15, 2012 and announced by the German Federal Ministry of Justice on June 15, 2012 in the official section of the German Federal Gazette were complied with apart from the aforementioned exception and the following deviations:
Since the announcement of the amendment to section 5.4.6 para 2 of the German Corporate Governance Code on June 15, 2012, the compensation of the Supervisory Board of the company, which up until that date complied with the Code, no longer corresponds to the current recommendations to the extent that the apart from reimbursement for expenses and fixed compensation, performance-related compensation is granted based on the dividend of the current fiscal year. Owing to the latest change to section 5.4.6 para 2 of the German Corporate Governance Code, the recommendation was introduced that performancerelated compensation should be oriented toward the sustainable growth of the company. The aforementioned measurement basis for the current variable compensation paid to the company’s Supervisory Board members does not meet these preconditions since it is only oriented toward the dividend of a year. A new compensation system that conforms to the new recommendations of the German Corporate Governance Code and only provides for fixed compensation will be proposed to the 2013 General Meeting.
The Government Commission German Corporate Governance Code amended the latest version of section 5.4.1 para 2 of the Code by adding the recommendation that the Supervisory Board shall also define the number of independent Supervisory Board members in the future. Subsequent to discussions of this matter and adoption by the Supervisory Board on March 6, 2013, this recommendation has been complied with since this date.
In view of future compliance with the current recommendations of the Government Commission German Corporate Governance Code, the Executive Board and the Supervisory Board declare the following: With the exception of the aforementioned deviation from section 5.4.1 sentence 2 (age limit) and subject to the approval of the General Meeting on the amendment of Supervisory Board compensation effective April 27, 2013, the company will comply with the recommendations of the Code in the version dated May 15, 2012.”
Darmstadt, March 6, 2013For the Executive Board For the Supervisory Board
s. Karl-Ludwig Kley s. Rolf Krebs
103
Statement on Corporate Governance
Merck 2012Corporate Governance

Compensation report
(Sections 4.2.5 and 5.4.6 of the German Corporate Governance Code) The compensation report is part of the audited Notes to the Group accounts.
Compensation of members of the Executive Board of Merck KGaAContrary to management board members of German stock corporations, the members of the Executive Board of Merck KGaA are not employed officers of the company. Rather, they are personally liable general partners of both Merck KGaA and the general partner E. Merck KG, and in this capacity they receive profit -based compensation from E. Merck KG. Therefore, the obligation to individually publish the compensation of management board members of publicly listed German stock corporations does not apply to the Executive Board of Merck KGaA. The following presentation of individual compensation is therefore being made on a voluntary basis.
Contrary to publicly listed German stock corporations, at Merck KGaA it is not the Supervisory Board, but the Board of Partners of E. Merck KG that decides on the amount and composition of compensation. E. Merck KG has transferred the execution of this right to its Personnel Committee. Among other things, the Personnel Committee is responsible for the following decisions: contents of contracts with Executive Board members, granting of loans and advance salary payments, approval for taking on honorary offices, board positions and other sideline activities, as well as the division of responsibilities within the Executive Board of Merck KGaA. The compensation system defined by the Personnel Committee for Executive Board members takes into account various compensation relevant aspects, including the responsibility of the individual Executive Board members, their individual performance, the performance of the company, as well as the amount of compensation paid to executive board and management board members of comparable companies. The Personnel Committee regularly commissions an independent compensation consultant to review the appropriateness of compensation.
Features of the compensation systemThe compensation paid to the Executive Board members of Merck KGaA in fiscal 2012 comprises fixed components, variable compensation components and additions to pension provisions. Benefits in kind and other benefits are additionally granted.
Fixed compensationFixed compensation is paid in the form of 12 equivalent monthly installments. The table on page 106 provides an overview of the amount of the fixed compensation paid in 2011 and 2012.
Variable compensationVariable compensation is based on the three-year rolling average of profit after tax of the E. Merck Group. Exceptional factors that amount to more than 10% of the Group profit and for which the Executive Board member is not responsible are eliminated. The members of the Executive Board receive an individually fixed per mille rate of the Group profit calculated in this manner.
Additionally, in exceptional cases the Personnel Committee of E. Merck, which is responsible for the compensation of the Executive Board, may grant onetime payments voluntarily and at its own discretion. In such cases, the Personnel Committee ensures that the onetime payments do not exceed the respectie total compensation of the individual Executive Board member composed of fixed and variable compensation (excluding the onetime payment).
104
Statement on Corporate Governance
Merck 2012Corporate Governance

Additional variable compensation (Merck Long-Term Incentive Plan)In 2012, a longterm variable compensation component known as the Merck LongTerm Incentive Plan was added to the variable compensation of the members of the Executive Board. It aims to enhance the sustainability of the compensation system and to align it not only with target achievement based on key performance indicators, but above all with a sustainable performance of Merck shares.
Subject to the resolution of the Personnel Committee each year, under the Merck Long Term Incentive Plan the members of the Executive Board could be eligible to receive a certain number of virtual shares – Merck Share Units (MSUs) – at the end of a threeyear performance cycle. The number of MSUs that could be received depends on the total value defined for the respective person and the average closing price of Merck shares in Xetra trading during the last 60 trading days prior to January 1 of the respective fiscal year (reference price). In order to participate in the Plan, members of the Executive Board must personally own an investment in Merck shares equivalent to 10% of their respective fixed annual compensation, taking into account the equity interest held in E. Merck KG as a personally liable general partner. It is not permitted to sell these shares during the performance cycle. After termination of the three year performance cycle, the number of MSUs to be granted then is determined based on the development of two key performance indicators (KPIs). These are:
a) the performance of the Merck share price compared to the DAX ® with a weighting of 70%, andb) the development of the EBITDA pre margin, during the performance cycle as a proportion of a
defined target value with a weighting of 30%.Depending on the development of the KPIs, at the end of the respective performance cycle the members
of the Executive Board are granted between 0% and 150% of the MSUs they could be eligible to receive. Based on the number of MSUs granted, the members of the Executive Board receive a cash payment at a defined point in time in the year following the expiration of the three-year performance cycle. The value of an MSU corresponds to the average closing price of Merck shares in Xetra trading during the last 60 trading days prior to January 1 after the performance cycle. The payment amount is limited to three times the reference price. The net amount after taking tax into account is invested in Merck shares by the members of the Executive Board. One third of these shares may be sold at the earliest one year after termination of the performance cycle, another third after two years, and another third after three years.
In fiscal 2012, the following total values were specified for members of the Executive Board, which resulted in the respective number of MSUs they were eligible to receive based upon the definitive reference price of Merck shares (60 trading days preceding January 1, 2012) of € 69.57: KarlLudwig Kley € 1.5 million (21,562 MSUs), Kai Beckmann € 1.0 million (14,375 MSUs), Stefan Oschmann € 1.0 million (14,375 MSUs), Bernd Reckmann € 1.0 million (14,375 MSUs), and Matthias Zachert € 1.0 million (14,375 MSUs).
For fiscal 2013, the Personnel Committee authorized the Chairman of the Personnel Committee to assign potential numbers of MSUs to the Executive Board members for a performance cycle from January 1, 2013 to December 31, 2015. The following total values were defined as the initial basis: Karl- Ludwig Kley € 1.5 million, Kai Beckmann € 1.0 milion, Stefan Oschmann € 1.0 milion, Bernd Reckmann € 1.0 million and Matthias Zachert € 1.0 million.
Additional benefitsThe members of the Executive Board also receive certain additional benefits, mainly contributions to insurance policies as well as a company car, which they are entitled to use privately. The members of the Executive Board must declare these benefits in their tax returns. Overall, the value of other additional benefits totaled € 122 thousand in 2012 (2011: € 121 thousand). Of this amount, in 2012 € 28 thousand was attributable to
105
Statement on Corporate Governance
Merck 2012Corporate Governance

KarlLudwig Kley (2011: € 28 thousand), € 23 thousand to Kai Beckmann (2011: € 14 thousand), € 21 thousand to Stefan Oschmann (2011: € 15 thousand), € 26 thousand to Bernd Reckmann (2011: € 25 thousand) and € 24 thousand to Matthias Zachert (2011: € 14 thousand).
Total compensationAccordingly, the following total compensation results for the members of the Executive Board of Merck KGaA broken down by performanceindependent and performancerelated components:
Performance-independent components
Performance-related components Total
Share-based com-
pensation expensed in the period 4
without a long-term incentive
effect with a long-term incentive
effect
Fixed com-pensation
Additional benefits
Variable compensa-
tion1Merck
Long-Term Incentive Plan
(€ thousand) (€ thousand) (€ thousand)
Number of MSUs 2
(units)Fair value 3
(€ thousand) (€ thousand) (€ thousand)
Current membersKarl-Ludwig Kley 2012 1,100 28 2,795 21,562 1,626 5,549 857
2011 1,100 28 3,100 n/a n/a 4,228 n/aKai Beckmann 7 2012 800 23 1,746 14,375 1,084 3,653 571
2011 600 14 1,188 n/a n/a 1,802 n/aStefan Oschmann 2012 1,000 21 2,295 14,375 1,084 4,400 571
2011 1,000 15 2,100 n/a n/a 3,115 n/aBernd Reckmann 2012 1,000 26 2,295 14,375 1,084 4,405 571
2011 1,000 25 3,300 n/a n/a 4,325 n/aMatthias Zachert 8 2012 1,000 24 2,045 14,375 1,084 4,153 571
2011 583 14 1,079 n/a n/a 1,676 n/aTotal 20125 4,900 122 11,176 79,062 5,962 22,160 3,141
20116 5,533 121 13,891 n/a n/a 19,545 n/a1 The variable compensation for 2012 is based on an extrapolation since the consolidated result of the E. Merck Group was not yet available when this information was prepared. For the same reasons the variable compensation stated for 2011 above deviates in some cases slightly from the amounts actually reported in 2012. The one-time payments made in 2011 to Karl-Ludwig Kley, Michael Becker and Bernd Reckmann for the achievement of targets in connection with the Millipore transaction are included in the variable compensation component reported for 2011.
2 Number of the potential MSUs subject to target achievement. For details on the calculation thereof, see page 105. The actual number of MSUs to be granted after the expiration of the three-year performance cycle may deviate from this.
3 Fair value on the date of the grant (date of the legally binding entitlement). The amount of a payment is not predefined. Payment is subject to target achievement and is only made on a specified date after the expiration of a three-year performance cycle. The fair value of the obligations was calculated using a Monte Carlo simulation based on the previously described KPIs. The expected volatilities are based on the implicit volatility of Merck shares and the DAX ® index in accordance with the remaining term of the LTIP tranche. The dividend payments incorporated into the valuation model orient towards medium-term dividend expectations.
4 In accordance with IFRS.5 In 2012, no compensation was paid to former members.6 Including compensation for former members (basic compensation € 1,250 thousand, additional benefits € 25 thousand, variable compensation € 3,124 thousand – total € 4,399 thousand).
7 Kai Beckmann has been a Member of the Executive Board since April 1, 2011.8 Matthias Zachert has been a Member of the Executive Board since June 1, 2011.
106
Statement on Corporate Governance
Merck 2012Corporate Governance

Pension provisionsThe individual contractual pension obligations grant the members of the Executive Board entitlement to a lifelong old age pension or surviving dependents’ pension in the event of reaching the individual contractually agreed age limit, permanent disability, or death.
The amount of the old age pension is determined by a percentage share of pensionable compensation defined by the Personnel Committee.
The individual values are presented in the following table:
Pensionable compensation
(€ thousand)Percentage entitlement
Karl-Ludwig Kley 790 70Kai Beckmann 300 43Stefan Oschmann 500 45Bernd Reckmann 500 58Matthias Zachert 400 42The percentage entitlement increases up until retirement by 2 percentage points per year of service up to 70% for Kai Beckmann, Bernd Reckmann and Matthias Zachert. Their pension entitlements were correspondingly increased in fiscal 2012.
The following amounts were added to pension provisions in 2012:
Additions to pension provisions
Amount of pension provi-
sions as of Dec. 31, 2012€ thousand 2012 2011
Karl-Ludwig Kley 2,023 –1,699 7,290Kai Beckmann 653 1,053 2,478Stefan Oschmann 156 498 654Bernd Reckmann 1,446 693 5,755Matthias Zachert 195 153 348Total 4,473 698 16,525
The surviving dependents’ pension grants the spouse a lifelong surviving dependents’ pension amounting to 60% of the pension entitlement, dependent children either a half orphan’s or an orphan’s pension maximally until the age of 25.
As an alternative to an old-age pension, upon reaching the age limit specified in their individual contracts, the members of the Executive Board have the possibility to receive their pension entitlement in the form of a onetime lumpsum payment calculated in accordance with actuarial principles.
107
Statement on Corporate Governance
Merck 2012Corporate Governance
Benefits in the event of termination of the duties as an Executive Board memberThe employment contracts of Karl-Ludwig Kley, Kai Beckmann, Stefan Oschmann and Bernd Reckmann each contain a postcontractual noncompetition clause. An amount equal to 50% of the average contractual benefits paid to the respective Executive Board Member within the past 12 months prior to leaving the company shall be provided as compensation for each year of the twoyear noncompetition period. During the period of the noncompetition clause, other employment income as well as pension payments will be credited toward this compensation. Within certain time limits, E. Merck KG has the possibility to dispense with adherence to the noncompetition clause with the consequence that the obligation to make the compensation payments shall cease to apply.
Above and beyond existing pension obligations, no further obligations additionally exist in the event of the termination of the contractual relationships of the Executive Board members.
MiscellaneousThe members of the Executive Board do not receive additional compensation for serving on the boards of Group companies.
Should members of the Executive Board be held liable for financial losses while executing their duties, under certain circumstances this liability risk is covered by a D&O insurance policy from Merck KGaA. The D&O insurance policy has a deductible in accordance with the legal requirements and the recommendations of the German Corporate Governance Code.
Payments to former Executive Board members and their surviving dependentsPension payments to former members of the Executive Board or their surviving dependents amounted to € 10,478 thousand in 2012 (2011: € 9,734 thousand). Pension provisions totaling € 108,473 thousand exist for pension entitlements of this group of persons (2011: € 89,204 thousand).
Compensation of the Supervisory Board members of Merck KGaAThe compensation of the Supervisory Board members is defined by Article 20 of the Articles of Associationof Merck KGaA. However, a new compensation system will be proposed to the General Meeting to reflect the changes in the German Corporate Governance Code announced on June 15, 2012. The rules that still apply at the present time provide for the following:
Apart from reimbursement of their expenses, the members of the Supervisory Board receive fixed and variable compensation.
The fixed compensation amounts to € 7,000 per year. The Chairman receives double this amount and the Vice Chairman receives one and a half times this amount.
The members of the Supervisory Board also receive € 550 for each percent of the dividend resolved by the General Meeting in excess of 6% of the share capital, with a corresponding portion for fractions of a percent. The Chairman receives double this amount and the Vice Chairman receives one and a half times this amount.
Supervisory Board members who have only been in office for part of the fiscal year receive lower compensation in proportion to their term of office. The company reimburses the value- added tax levied on the compensation.
108
Statement on Corporate Governance
Merck 2012Corporate Governance

The individual values are presented in the following table:
Compensation of the Supervisory Board members of Merck KGaA
Fixed compensation Variable compensation Total compensation
€ 2012 2011 2012 2011 2012 2011
Rolf Krebs 1 (Chairman) 14,000 14,000 65,318 56,859 79,318 70,859Heiner Wilhelm (Vice Chairman) 10,500 10,500 48,988 42,644 59,488 53,144Crocifissa Attardo 7,000 7,000 32,659 28,429 39,659 35,429Mechthild Auge 7,000 7,000 32,659 28,429 39,659 35,429Johannes Baillou 2 7,000 7,000 32,659 28,429 39,659 35,429Frank Binder 3 7,000 7,000 32,659 28,429 39,659 35,429Wolfgang Büchele 2 7,000 7,000 32,659 28,429 39,659 35,429Michael Fletterich 7,000 7,000 32,659 28,429 39,659 35,429Edeltraud Glänzer 7,000 7,000 32,659 28,429 39,659 35,429Jürgen Glaser 5 4,686 – 21,862 – 26,548 –Michaela Freifrau von Glenck 4 7,000 7,000 32,659 28,429 39,659 35,429
Frieder Kaufmann 6 2,505 7,000 11,689 28,429 14,194 35,429Hans-Jürgen Leuchs 2 7,000 7,000 32,659 28,429 39,659 35,429Albrecht Merck 3 7,000 7,000 32,659 28,429 39,659 35,429Karl-Heinz Scheider 7,000 7,000 32,659 28,429 39,659 35,429Theo Siegert 1 7,000 7,000 32,659 28,429 39,659 35,429Osman Ulusoy 7 2,314 7,000 10,797 28,429 13,111 35,429Berthold Wagner 8 4,495 – 20,969 – 25,464 –Total 122,500 122,500 571,531 497,509 694,031 620,0091 As members of corporate bodies of E. Merck KG, these Supervisory Board members each received an additional payment of € 150,000 for performing this
function in 2012 (2011: € 150,000).2 As members of corporate bodies of E. Merck KG, these Supervisory Board members each received an additional payment of € 140,000 for performing this
function in 2012 (2011: € 140,000).3 As members of corporate bodies of E. Merck KG, these Supervisory Board members each received an additional payment of € 120,000 for performing this
function in 2012 (2011: € 120,000).4 As members of corporate bodies of E. Merck KG, these Supervisory Board members each received an additional payment of € 80,000 for performing this
function in 2012 (20110: € 80,000).5 Member of the Supervisory Board since May 1, 20126 Member of the Supervisory Board until May 10, 20127 Member of the Supervisory Board until April 30, 20128 Member of the Supervisory Board since May 11, 2012
By contrast, the new compensation system to be proposed to the 2013 General Meeting in conformity with the new recommendations of the German Corporate Governance Code provides exclusively for fixed compensation. To this extent, annual fixed compensation of € 47,000 (the Chairman receives twice this amount, the Vice Chairman one and a half times this amount) as well as additional compensation of € 750 per meeting will be proposed.
109
Statement on Corporate Governance
Merck 2012Corporate Governance

Ownership, purchase or sale of shares in the company by members of the Executive Board and of theSupervisory BoardAs of December 31, 2012, the members of the Executive Board and of the Supervisory Board either directly or indirectly held 14,316 shares of Merck KGaA. Their total ownership represents less than 1% of the issued shares of Merck KGaA. Transactions executed by members of the Executive Board and of the Supervisory Board are disclosed on the Merck website at www.merckgroup.com/investors Corporate Governance
Directors’ Dealings.
Information on Corporate Governance Practices
ReportingIt is Merck KGaA’s objective to provide the latest information to all shareholders, media, financial analysts and interested members of the public, while creating the greatest possible transparency. For this reason, Merck uses a wide range of communication platforms to engage in a timely dialogue with all interested parties about the situation of the company and business changes. Merck’s principles include providing factually correct, comprehensive and fair information.
Information subject to disclosure requirements, as well as information that is not, can be accessed worldwide on the Merck KGaA website (www.merckgroup.com), which is the company’s most important publication platform. Apart from a detailed financial calendar, quarterly and half- year financial reports covering the past three years are available here in German and English. In addition, in line with the legal requirements, ad hoc announcements are published on the website. These contain information on circum stances that could impact the Merck share price.
Regular press conferences, investor meetings on the occasion of investor conferences as well as road shows offer another platform for dialogue. The company presentations prepared for this purpose are also available on the Merck KGaA website. In addition, the Investor Relations team is always available to private and institutional investors who wish to receive further information.
To ensure the greatest possible transparency, all documents concerning the General Meeting are available on the company website. Additionally, some parts of the General Meeting are webcast live on the Internet.
Dealing with insider informationDealing properly with insider information is very important to us. Our insider committee examines the existence of insider information, ensures compliance with legal obligations, and prepares any necessary measures. The members of the insider committee are appointed by the Executive Board; at least two members work in Group Legal & Compliance. The insider committee meets at regular intervals, yet also meets when circumstances require. The Chief Financial Officer is vested with the authority to make the final decision on handling potential insider information.
Section 6.6 of the German Corporate Governance Code
110
Statement on Corporate Governance
Merck 2012Corporate Governance

In order to ensure a high level of protection for insider information, in 2011 the Executive Board issued an internal insider guideline applicable throughout the Merck Group worldwide. This guideline informs employees about their responsibilities under insider trading laws and gives clear instructions for compliant behavior.
In addition, it describes the function of the insider committee in detail. Moreover, our Code of Conduct, which is binding on all employees, also contains an explicit, detailed reference to the ban on using insider informa tion. Within the scope of obligatory training courses on the Code of Conduct, all employees are instructed on the subject of insider trading.
Accounting and audits of financial statementsMerck KGaA prepares its consolidated financial statements and Group management report in accordance with International Financial Reporting Standards (IFRS), as applicable in the EU, as well as the supplementary rules applicable under section 315a (1) of the German Commercial Code (HGB) and as stipulated by our Articles of Association. The Group financial statements and the Group management report are prepared by the Executive Board and examined by an auditor, taking into account the generally accepted standards for the audit of financial statements promulgated by the Institut der Wirtschaftsprüfer (IDW).
The Supervisory Board commissioned KPMG AG Wirtschaftsprüfungsgesellschaft, Berlin, to audit the Group financial statements and the Group management report for 2012. Neither party identified any conflicts of interest. Moreover, the Supervisory Board agreed with KPMG AG that the auditor shall inform the Supervisory Board without delay of any grounds for bias or disqualification occurring during the audit if these cannot be immediately rectified. Additionally, the auditor must immediately report to the Supervisory Board any findings and issues which emerge during the audit that have a direct bearing upon the tasks of the Supervisory Board. The auditor shall inform the Supervisory Board or note in the audit report any circumstances determined during the audit that would render inaccurate the Statement of Compliance made by the Executive Board and the Supervisory Board. It has also been agreed with the auditor that in order to assess whether the Executive Board has fulfilled its obligations in accordance with section 91 (2) AktG, the audit will also cover the company’s early warning risk identification system. Moreover, the auditor is required to examine and evaluate the accounting relevant internal control system insofar as this is necessary and appropriate for assessing the accuracy of financial reporting.
Values and complianceBased on a corporate culture that places the fundamental company values – courage, achievement, responsibility, respect, integrity and transparency – at the center of our entrepreneurial actions, the Code of Conduct helps those involved in the business process to imple ment the values when dealing with one another on a daily basis.
Merck has created the Code of Conduct as a set of rules and regulations intended to help Merck employ ees to act responsibly and to make the right decisions in their daily work. The Code of Conduct explains the principles for dealings with business associates, general partners, colleagues, and employees, as well as the communities in which we operate. Thus, it supports all employees in acting ethically – not only in their dealings with one another, but also outside the company. The Code of Conduct is thus the main set of rules of our compliance program.
The Code of Conduct can be found on the Merck website at: www.merckgroup.com ➝ Publications ➝ Code of Conduct
111
Statement on Corporate Governance
Merck 2012Corporate Governance

To Merck, compliance means observing legal and company internal regulations and the basic ethical principles anchored in the company values. With the Code of Conduct and the various unit -specific compliance rules, the values are integrated into daily work and business practice. The Code of Conduct is binding on all employees, both at headquarters as well as the legal entities abroad. The Compliance Office monitors observance of the Code of Conduct with support from corresponding auditing and training programs throughout the Group. All employees are called upon to report compliance violations to their supervisor, Legal, HR or other relevant departments. Merck created the position of Group Compliance Officer (GCO) in 2002. This employee is responsible for setting up, maintaining and further developing our global compliance program. By taking appropriate measures, the GCO and his team, including regional compliance officers, help to lower the risk of serious legal violations of, for instance, antitrust law or anticorruption rules. The role of the Group Compliance Officer is reflected in the legal entities by the approximately 80 local compliance officers, who ensure that compliance measures are implemented in the legal entities in the countries. Regular regional and global compliance meetings are held to promote the exchange of information within the network. Newcomer training seminars were introduced in 2010 for newly appointed compliance officers. These seminars serve to build up compliance expertise and strengthen cooperation within the compliance organization. This Groupwide network is used to steer the global compliance program.
Within the scope of this program, a high degree of importance is attached to regular compliance seminars of the Merck Compliance Training Plan, which are conducted as web based training courses and onsite events. By presenting various training topics, particularly on the Code of Conduct, corruption, antitrust and competition law as well as health care compliance, they serve to sensitize employees and management to the consequences of compliance violations and to show ways of avoiding them. By setting up a central SpeakUp line, employees can report compliance violations by telephone or via a web based application in their respective national language. The SpeakUp line is available 24 hours a day, free of charge. Case numbers enable anonymous, two way communication. The reports received are individually reviewed. If a compliance violation exists, corresponding corrective action is taken based on concrete action plans. If necessary, disciplinary measures are taken. These can range from a simple warning up to the dismissal of the employee who violated a compliance rule. In 2010, Merck set up a compliance committee to guide these processes. The Compliance Committee consists of members from various Group functions; they are involved in reviewing compliance violations and introducing countermeasures. The joint work in the Compliance Committee enables processes between the various Group functions to be optimized. Further significant elements of the Compliance program include requirements on locally identifying and assessing risks and reporting these, both within the subsidiary and to the Group functions. Group Compliance regularly reviews and assesses the implementation status of the Compliance program at the subsidiaries.
In cooperation with Group Internal Auditing, the Compliance Office regularly reviews the implementation of Groupwide compliance measures at the legal entities abroad. The audits regularly focus on the local compliance structure, the compliance measures taken, as well as the existence of corresponding compliance guidelines and processes.
The Compliance department reports regularly to the Executive Board, informing it of the status of compliance activities (including training status), compliance risks as well as serious compliance violations. The Executive Board informs the supervisory bodies at least once a year about the key compliance issues.
The SpeakUp line is available 24 hours a day
112
Statement on Corporate Governance
Merck 2012Corporate Governance

Risk and opportunity managementThe Executive Board, the Supervisory Board and the Finance Committee are regularly informed about the current risk portfolio of the Group and the individual companies. More detailed information can be found in the Risk Report on page 84 et seq.
Avoidance of conflicts of interestWithin the framework of their work, all Executive Board and Supervisory Board members of Merck KGaA are exclusively committed to the interests of the company and pursue neither personal interests nor grant unjustified advantages to third parties.
Before an Executive Board member takes on honorary offices, board positions or other sideline activities, this must be approved by the Personnel Committee of the Board of Partners of E. Merck KG.
The Chairman of the Executive Board, Karl-Ludwig Kley, and the Chief Financial Officer, Matthias Zachert, are both members of the Executive Board of E. Merck KG. This does not, however, lead to conflicts of interest. In its report to the General Meeting, the Supervisory Board discloses any conflicts of interest involving its members and how they were dealt with. Consultancy agreements as well other service and work contracts of a Supervisory Board member with Merck require the approval of the Supervisory Board. In fiscal 2012, there were neither conflicts of interest nor consultancy agreements or other service or work contracts with Merck KGaA involving Supervisory Board members.
Adherence to environmental and safety standardsAt Merck, closedloop thinking guides the way in which we address environmental concerns and environmental protection issues. To this end, we integrate precautionary measures into our planning processes. Our Environment, Health and Safety Policy with its principles and strategies implements the guidelines formulated by the national and international associations of the chemical industry in the Responsible Care guidelines. The Responsible Care Global Charter developed by the International Council of Chemical Associations (ICCA) in 2006 puts even more emphasis than before on overall responsibility for products, supply chains and the community. Merck signed this expanded version of Responsible Care for the entire Group in February 2007.
Many guidelines specify how the sites and employees of the Merck Group are to observe the principles in their daily work. The Group function Environment, Health, Safety, Security & Quality steers these global activities and ensures compliance with regulatory requirements, standards and business needs throughout the entire Group. In this way, Groupwide risks are minimized and continuous improvement is promoted in the areas of Environment, Health, Safety, Security, and Quality. Corporate Responsibility reports are also published at regular intervals.
113
Statement on Corporate Governance
Merck 2012Corporate Governance

Procedures of the Executive Board, Supervisory Board, Board of Partners and its Committees
Members of the Executive Board of Merck KGaANotes on memberships of statutory supervisory boards and comparable German and foreign supervisory bodies (section 285 No. 10 HGB in conjunction with section 125 (1) sentence 5 AktG)
Member
Memberships of(a) statutory supervisory boards and (b) comparable German and foreign supervisory bodies
of corporations
Karl-Ludwig KleyDarmstadt Chairman
(a) – Bertelsmann AG/Bertelsmann SE & Co. KGaA1, Gütersloh – Bertelsmann Management SE, Gütersloh (since May 4, 2012) – BMW AG, Munich (Vice Chairman) – 1. FC Köln GmbH & Co. KGaA, Cologne (Chairman)
Kai BeckmannGriesheim, Head of Group Human Resources no board positions
Stefan Oschmann Munich, Responsible for the Merck Seronoand Consumer Health divisions
(b) – Merck Serono S.A., Coinsins, Switzerland (Chairman) (until April 18, 2012)
Bernd ReckmannSeeheim-Jugenheim, Responsible for the Performance Materials and Merck Millipore divisions no board positions
Matthias ZachertBonn, Chief Financial Officer no board positions1 Pursuant to the Commercial Registry entry dated August 20, 2012, Bertelsmann AG was transformed into Bertelsmann SE & Co. KGaA on August 20, 2012 by means of a change in legal form.
The general partners with no equity interest (Executive Board) manage the business activities in accordance with the laws, the Articles of Association and the rules of procedure. They are appointed by E. Merck KG with the consent of a simple majority of the other general partners. The members of the Executive Board are jointly responsible for the entire management of the company. Certain tasks are assigned to individual Executive Board members based on a responsibility distribution plan. Each Executive Board member promptly informs the other members of any important actions or operations in his respective business area. The Executive Board is responsible for preparing the annual financial statements of Merck KGaA and of the Group as well as for approving the quarterly and half- year financial statements of the Merck Group. In addition, the Executive Board ensures that all legal provisions, official regulations and the company’s internal policies are abided by, and works to achieve compliance with them by all the companies of the Merck Group. A Group-wide guideline defines in detail which transactions require prior Executive Board approval.
The Executive Board provides the Supervisory Board with regular, uptodate and comprehensive reports about all companyrelevant issues concerning strategy, planning, business developments, the risk situation, risk management and compliance. The rules of procedure of the Executive Board and of the Supervisory Board as well as a Supervisory Board resolution regulate further details on the information and reporting duties of the Executive Board visàvis the Supervisory Board.
114
Statement on Corporate Governance
Merck 2012Corporate Governance

The Executive Board informs the Board of Partners and the Supervisory Board at least quarterly of the progress of business and the situation of the company. In addition, the Executive Board informs the stated boards at least annually of the company’s annual plans and strategic considerations.
The Executive Board passes its resolutions in meetings that are normally held twice a month.
Supervisory Board
Member
Memberships of(a) other statutory supervisory boards and (b) comparable German and foreign supervisory bodies
of corporations
Rolf KrebsMainz, Physician,Chairman
(a) – Epigenomics AG, Berlin (Chairman) (until April 2012) – Ganymed Pharmaceuticals AG, Mainz (Chairman) – Merz GmbH & Co. KGaA, Frankfurt – Merz Pharmaceuticals GmbH, Frankfurt – Senator GmbH & Co KGaA, Frankfurt (until June 2012)
(b) – E. Merck KG, Darmstadt 1 – Air Liquide S.A., Paris (until May 10, 2012)
Heiner WilhelmReinheim, Chairman of the Works Council of the Darmstadt site of Merck KGaA, Vice Chairman no board positions
Crocifissa AttardoDarmstadt, Full-time member of the WorksCouncil of the Darmstadt site of Merck KGaA no board positions
Mechthild AugeWehrheim, Full-time member of the WorksCouncil of the Darmstadt site of Merck KGaA no board positions
Johannes BaillouVienna, Austria, Managing Partner of BondiImmobilien-Consulting GmbH, Vienna
(b) – E. Merck KG, Darmstadt 1 (Vice Chairman)
Frank BinderZurich, Switzerland, Chief Executive Officer ofNovarca Deutschland GmbH, Frankfurt/Main
(a) – Landbell AG für Rückhol-Systeme, Mainz (Chairman)(b) – E. Merck KG, Darmstadt 1
– BMR-Yachting AG, Zurich (Chairman) – Lloyd Yachts SAM, Monaco (Chairman) (since March 14, 2012)
Wolfgang BücheleMannheim, Member of the Board of Directorsof Kemira Oyj, Finland
(b) – E. Merck KG, Darmstadt 1 – Kemira Oyj, Helsinki, Finland
Michael FletterichGernsheim, Chairman of the WorksCouncil of the Gernsheim site of Merck KGaA no board positions
Edeltraud GlänzerWiesbaden, Member of the ManagingBoard of Industriegewerkschaft Bergbau,Chemie, Energie (IG BCE)
(a) – B. Braun Melsungen AG, Melsungen – Solvay Deutschland GmbH, Hannover
(Vice Chairman)
115
Statement on Corporate Governance
Merck 2012Corporate Governance

Member
Memberships of(a) other statutory supervisory boards and (b) comparable German and foreign supervisory bodies
of corporations
Jürgen Glaser (since May 1, 2012)Bingen, Regional Director of the Industrie-gewerkschaft Bergbau, Chemie, Energie (IG BCE) Darmstadt no board positions
Michaela Freifrau von Glenck 2Zurich, SwitzerlandTeacher no board positions
Frieder Kaufmann (until May 10, 2012)Rossdorf, Full-time member of the WorksCouncil of the Darmstadt site of Merck KGaA no board positions
Hans-Jürgen Leuchs Ingelheim, Graduate chemist
(b) – E. Merck KG, Darmstadt 1 – Zeton B.V., Enschede, Netherlands – Zeton International Inc., Burlington, ONT, Canada
Albrecht Merck 2 Schriesheim, Commercial Director of the CastelPeter winery, Bad Dürkheim (b) – E. Merck KG, Darmstadt 1
Karl-Heinz ScheiderGross-Zimmern, Head of ContractManufacturing Chemicals, Merck KGaA no board positions
Theo SiegertDüsseldorf, Managing Partner ofde Haen Carstanjen & Söhne, Düsseldorf
(a) �– Deutsche Bank AG, Frankfurt (until May 2012) – E.ON AG, Düsseldorf – Henkel AG & Co KGaA, Düsseldorf
(b) – E. Merck KG, Darmstadt 1 – DKSH Holding Ltd., Zurich, Switzerland
Berthold Wagner (since May 11, 2012)Frankfurt, Member of the Works Council of the Darmstadt site of Merck KGaA no board positions
Osman Ulusoy (until April 30, 2012) Wiesbaden, Vice Regional Director(Hesse-Thuringia) of IndustriegewerkschaftBergbau, Chemie, Energie (IG BCE) no board positions1 Internal board position2 Members appointed by E. Merck KG according to Article 6 (5) of the Articles of Association
The Supervisory Board performs a monitoring function. It supervises the management of the company by the Executive Board. In comparison with the supervisory board of a German stock corporation, the role of the supervisory board of a corporation with general partners (KGaA) is limited. This is due to the fact that the members of the Executive Board are personally liable partners and therefore are themselves responsible
Tasks of the Supervisory Board of Merck KGaA
116
Statement on Corporate Governance
Merck 2012Corporate Governance

for the management of the company. In particular, the Supervisory Board is not responsible for appointing and dismissing general partners or for regulating the terms and conditions of their contracts. This is the responsibility of E. Merck KG. Nor does the Supervisory Board have the authority to issue rules of procedure for the Executive Board or a catalog of business transactions requiring approval. This authority likewise belongs to E. Merck KG (Article 13 (3) sentence 1 and (4) sentence 1 of the Articles of Association). However, the fact that the Supervisory Board has no possibilities to directly influence the Executive Board restricts neither its information rights nor audit duties. The Supervisory Board must monitor the Executive Board in terms of legality, regularity, usefulness, and economic efficiency. In particular, the Supervisory Board has the duty to examine the reports provided by the Executive Board. This includes regular reports on the intended business policy, as well as other fundamental issues pertaining to corporate planning,especially financial, investment and HR planning; the profitability of the Merck Group; the progress of business; the risk situation; risk management (including compliance), and the internal auditing system. In addition, by means of consultation with the Executive Board, it creates the basis for supervision of the management of the company by the Supervisory Board according to section 111 (1) of the German Stock Corporation Act (AktG).
The Supervisory Board examines the annual financial statements and management report of Merck KGaA, as well as the Group financial statements and the Group management report, taking into account in each case the reports of the auditor. Moreover, the Supervisory Board also examines the quarterly reports and the half-year financial report, taking into account in the latter case the report of the auditor on the audit review of the abridged financial statements and the interim management report of the Group. The adoption of the annual financial statements is not the responsibility of the Supervisory Board, but of the General Meeting. The Supervisory Board normally meets four times a year. Further meetings may be convened if demanded by a member of either the Supervisory Board or the Executive Board. As a rule, resolutions of the Supervisory Board are passed at meetings. At the instruction of the chairman, in exceptional cases a resolution may be passed by other means, details of which are given in the rules of procedure.
The members of the Board of Partners of E. Merck KG and of the Supervisory Board may be convened to a joint meeting if so agreed by the chairmen of the two boards.
The rules of procedure prescribe that the Supervisory Board may form committees as and when necessary. Owing to the aforementioned limited authority, and since a corresponding need has not yet arisen, the Supervisory Board currently has no committees.
The German Stock Corporation Act (Aktiengesetz) prescribes that the Supervisory Board of a publicly listed company must have at least one independent member on its Supervisory Board who has professional expertise in accounting or auditing. Theo Siegert satisfies these requirements and is furthermore the Chairman of the Finance Committee of the Board of Partners of E. Merck KG.
No restriction of information rights or audit duties
117
Statement on Corporate Governance
Merck 2012Corporate Governance

Board of Partners of E. Merck KGSome of the responsibilities that lie with the supervisory board of a German stock corporation are fulfilled at Merck by E. Merck KG. This applies primarily to the Board of Partners of E. Merck KG. Therefore, the Board of Partners and the composition and procedures of its committees are described in the following.
The Board of Partners has nine members.
Member
Memberships of(a) statutory supervisory boards and (b) comparable German and foreign supervisory bodies
of corporations
Frank Stangenberg-HaverkampDarmstadt, Vice Chairman of the Executive Board and General Partner of E. Merck KG, Chairman
(a) – Fortas AG, Rösrath (Chairman) – M.A.X. Automation AG, Düsseldorf
(b) – Oras Invest. Ltd., Helsinki, Finland (member of the Board of Directors) (since March 29, 2012)
Johannes BaillouVienna, Austria, Managing Partner of Bondi Immobilien-Consulting GmbH, Vienna (a) – Merck KGaA, Darmstadt
Jon BaumhauerMunich, Chairman of the Executive Board andGeneral Partner of E. Merck KG no board positions
Frank BinderZurich, SwitzerlandManaging Director of Novarca DeutschlandGmbH, Frankfurt/Main
(a) – Merck KGaA, Darmstadt – Landbell AG für Rückhol-Systeme, Mainz
(Chairman)(b) – BMR–Yachting AG, Zurich (Chairman)
– Lloyd Yachts, SAM, Monaco (Chairman) (since March 14, 2012)
Wolfgang BücheleMannheim, Member of the Board of Directors of Kemira Oyj, Finland
(a) – Merck KGaA, Darmstadt(b) – Kemira Oyj, Helsinki, Finnland
Rolf KrebsMainz, Physician
(a) – Merck KGaA, Darmstadt – Epigenomics AG, Berlin (Chairman) (until April 2012) – Ganymed Pharmaceuticals AG, Mainz (Chairman) – Merz GmbH & Co. KGaA, Frankfurt – Merz Pharmaceuticals GmbH, Frankfurt – Senator GmbH & Co KGaA, Frankfurt (until June 2012)
(b) – Air Liquide S.A., Paris (until May 10, 2012)
Hans-Jürgen LeuchsIngelheim,Graduate chemist
(a) – Merck KGaA, Darmstadt(b) – Zeton B.V., Enschede, Netherlands
– Zeton International Inc., Burlington ONT, Canada
Albrecht MerckSchriesheim, Commercial Director of the Castel Peter winery, Bad Dürkheim (a) – Merck KGaA, Darmstadt
Theo SiegertDüsseldorf, Managing Partner ofHaen Carstanjen & Söhne, Düsseldorf
(a) – Merck KGaA, Darmstadt – Deutsche Bank AG, Frankfurt (until May 2012) – E.ON AG, Düsseldorf – Henkel AG & Co KGaA, Düsseldorf
(b) – DKSH Holding Ltd., Zurich, Switzerland
118
Statement on Corporate Governance
Merck 2012Corporate Governance

The Board of Partners supervises the Executive Board in its management of the company. It informs itself about the business matters of Merck KGaA, and may inspect and examine the company’s accounts and other business documents, and the assets for this purpose. According to Article 13 (4) of the Articles of Association of Merck KGaA, the Executive Board requires the approval of E. Merck KG for transactions that are beyond the scope of the Group’s ordinary business activities. For such transactions to be approved, approval must first be obtained from the Board of Partners of E. Merck KG. The Board of Partners convenes as and when necessary; however, it meets at least four times a year. The members of the Executive Boardof Merck KGaA are invited to all meetings of the Board of Partners, unless the Board of Partners resolves otherwise in individual cases. The members of the Board of Partners may convene a joint meeting with the Supervisory Board of Merck KGaA if so agreed by the chairmen of the two boards.
The Board of Partners may confer the responsibility for individual duties to committees. Currently the Board of Partners has three committees in place: the Personnel Committee, the Finance Committee, and the Research and Development Committee.
Personnel CommitteeThe Personnel Committee has four members: Frank Stangenberg Haverkamp (Chairman), Jon Baumhauer, Rolf Krebs, and Theo Siegert.
The Personnel Committee meets at least twice a year. Further meetings are convened as and when necessary. Meetings of the Personnel Committee are attended by the Chairman of the Executive Board of Merck KGaA unless the Committee decides otherwise.
The Personnel Committee is responsible for, among other things, the following decisions concerning members and former members of the Executive Board: contents of and entry into employment contracts and pension contracts, granting of loans and advance payments, changes to the compensation structure and adaptation of compensation, approval for taking on honorary offices, board positions and other sideline activities, as well as division of responsibilities within the Executive Board of Merck KGaA. The Personnel Committee passes its resolutions by a simple majority – in matters concerning the Chairman of the Executive Board unanimity is required. The Chairman of the Committee regularly informs the Board of Partners of its activities.
Finance CommitteeThe Finance Committee has four members: Theo Siegert (Chairman), Johannes Baillou, Wolfgang Büchele, and Frank Stangenberg Haverkamp.
The Finance Committee holds at least four meetings a year, at least one of which is a joint meeting with the auditor of Merck KGaA. Further meetings are convened as and when necessary. Meetings of the Finance Committee are attended by the Chief Financial Officer of Merck KGaA. Other members of the Executive Board of Merck KGaA may attend the meetings upon request by the Committee. These meetings regularly include the Chairman of the Executive Board. The Finance Committee is responsible for, among other things, analyzing and discussing the annual financial statements and the respective report of the auditor of the annual financial statements and management report as well as the half- year financial report
119
Statement on Corporate Governance
Merck 2012Corporate Governance

(including the report of the auditors for the audit review of the abridged financial statements and interim management report contained in the halfyear report) and the quarterly reports. Furthermore, the Finance Committee recommends to the Chairman of the Supervisory Board annual audit focuses for the auditors. It also recommends an auditor for the annual financial statements and management report as well as auditors for the audit review of the abridged financial statements and interim management report contained in the half-year financial report for the Supervisory Board’s corresponding suggestion to the General Meeting. In addition, the Finance Committee is concerned with the financial position, results of operations and liquidity of Merck, as well as accounting, internal auditing, risk management and compliance issues. Upon request of the Board of Partners, the Finance Committee examines capital spending projects that must be approved by the Board of Partners and provides recommendations pertaining thereto.
Research and Development CommitteeThe Research and Development Committee has three members: Rolf Krebs (Chairman), Hans -Jürgen Leuchs and Frank Stangenberg Haverkamp.
The Research and Development Committee is convened as and when necessary, but holds meetings at least twice a year. Meetings of the Research and Development Committee are attended by members of the Executive Board of Merck KGaA upon request of the Committee. These meetings regularly include the Chairman of the Executive Board as well as the members of the Executive Board responsible for the Pharmaceuticals and Chemicals divisions. The Chairman of the Research and Development Committee is responsible, among other things, for analyzing and discussing the research activities of Pharmaceutical and Chemicals. The Pharmaceuticals and Chemicals divisions present the status of their respective research to the Research and Development Committee in special meetings. The Committee deals thoroughly with the pharmaceutical research progress report and with developments of new medicines in Phases II and III of clinical research. The Chairman of the Committee reports to the Board of Partners on the insights gained from the meetings held.
120
Statement on Corporate Governance
Merck 2012Corporate Governance

Report of the Supervisory Board
The Supervisory Board again properly executed its duties in 2012 in accordance with the law as well as the company’s Articles of Association and rules of procedure. In particular, the Supervisory Board monitored the work of the Executive Board diligently and regularly.
Cooperation with the Executive BoardThe cooperation with the Executive Board was characterized by intensive, trustworthy exchange. During fiscal 2012, the Executive Board provided the Supervisory Board with regular written and verbal reports on the business development of Merck KGaA and the Merck Group. In particular, the Supervisory Board was informed about the market and sales situation of the company against the background of the macroeconomic development, the financial position of the company and its subsidiaries along with their earnings develop ment, as well as corporate planning. Within the scope of quarterly reporting, the sales and operating results were presented for the Merck Group as a whole, and broken down by division. Aside from the Supervisory Board meetings, the Chairman of the Supervisory Board also maintained and continues to maintain a regular exchange of information with the Chairman of the Executive Board.
Key topics of the Supervisory Board meetingsFive Supervisory Board meetings were held in fiscal 2012. At these meetings, the Supervisory Board discussed the reports of the Executive Board in detail and discussed company developments and strategic issues together with the Executive Board.
At the meeting held on February 24, 2012, the Supervisory Board dealt mainly with the annual financial statements and consolidated financial statements for 2011 as well as the corresponding management reports. The Executive Board reported on business developments in 2011 and the key information contained in the 2011 annual financial statements. In addition, the auditor reported on the examination of the financial statements. The Supervisory Board approved the proposals to be made to the Annual General Meeting and adopted the statement on corporate governance including the Statement of Compliance with the German Corporate Governance Code in a joint report of the Executive Board and Supervisory Board. Lastly, the risk report, planning and the “Fit for 2018” program were topics of this meeting.
The meeting held on May 3, 2012 focused on current business developments in the first quarter of 2012. In addition, the Supervisory Board closely examined the internal auditing system. Furthermore, the head of Group Internal Auditing submitted her report on the audits conducted in 2011 and the results thereof. She also provided an outlook on the areas of focus of Group Internal Auditing in 2012. The meeting also focused on reporting as well as a discussion on the work of the Research and Development Committee of the Board of Partners of E. Merck KG. Moreover, the Compliance Report for 2011 was explained and discussed. Lastly, a discussion with the Executive Board on the status of the “Fit for 2018” program took place.
On May 15, 2012, an extraordinary Supervisory Board meeting was held at which the contents and presentations of Capital Market Day, which was also held on May 15, 2012, were discussed. The meeting focused on medium-term financial targets and the planned cost efficiencies.
At its meeting on July 24, 2012, the Supervisory Board discussed not only business developments in the first half of 2012 but also the report of KPMG on the audit review of the abridged financial statements and the interim management report of the Group as of June 30, 2012. The company’s risk management was a further topic of focus. For this purpose, the company risk manager presented his annual report to the Supervisory Board. Apart from the individual risks that had been identified as well as the approach to handling them, he presented the current risk assessment criteria. No risks that threaten the continued existence of the company were identified. The Executive Board then gave a report on the current status of the “Fit for 2018” program, which was followed by a discussion.
121Merck 2012Corporate Governance
At the fifth Supervisory Board meeting on November 1, 2012, the Supervisory Board dealt with the report of the Executive Board on the third quarter of 2012. Here, the Executive Board also reported on the progress of the “Fit for 2018” program. In addition, the head of Group Legal & Compliance presented the compliance report for 2012. In addition, the report of Group Internal Auditing on the first half of 2012 was discussed.
Annual financial statementsThe annual financial statements of Merck KGaA, the consolidated financial statements of the Merck Group, and the management reports for Merck KGaA and the Merck Group, including the accounts, were audited by KPMG AG Wirtschaftsprüfungsgesellschaft, Berlin. The auditors issued an unqualified audit opinion on the annual financial statements and management report for Merck KGaA in accordance with German Auditing Standards. For the consolidated financial statements prepared in accordance with International Financial Reporting Standards, the auditors issued the auditor’s report, reproduced in the Annual Report of the Merck Group. In addition, the auditors audited the calculation of Merck KGaA’s participation in the profits of E. Merck KG in accordance with Article 27 (2) of the Articles of Association. The annual financial statements of Merck KGaA, the consolidated financial statements of the Merck Group, the management reports for Merck KGaA and the Merck Group, and the proposal by the Executive Board for the appropriation of the net retained profit were presented and distributed to the Supervisory Board, together with the auditor’s reports.
In accordance with Article 14 (2) of the Articles of Association, the Supervisory Board also examined the annual financial statements of Merck KGaA and the management report for Merck KGaA, the proposal for the appropriation of the net retained profit and the auditor’s report presented in accordance with Article 27 (2) of the Articles of Association. It also examined the consolidated financial statements of the Merck Group as well as the management report for the Merck Group, and took note of the auditor’s report of KPMG AG Wirtschaftsprüfungsgesellschaft, Berlin.
The discussion of the relevant agenda item at the Supervisory Board’s meeting on March 6, 2013 to approve the financial statements was also attended by the auditors who sign the audit opinion on the annual financial statements of Merck KGaA and the consolidated financial statements of the Merck Group, and who reported on their audit. The Supervisory Board took note of and approved the results of the audit. On completion of its examination, the Supervisory Board raised no objections and thus approves the annual financial statements and management report for Merck KGaA, the consolidated financial statements of the Merck Group and the management report for the Merck Group prepared by the Executive Board, as well as the report presented by the auditors in accordance with Article 27 (2) of the Articles of Association. Following its own examination of the situation, the Supervisory Board gave its consent to the proposal for the appropriation of the net retained profit.
Corporate governance and Statement of ComplianceCorporate governance is a topic of high importance to the Supervisory Board. In its own estimation, the Supervisory Board has an adequate number of independent members. There were no conflicts of interest, as defined by the German Corporate Governance Code, involving Supervisory Board members during 2012. After addressing corporate governance topics in detail, the Executive Board and Supervisory Board resolved to adopt the updated Statement of Compliance on February 20, 2013 (Executive Board) and on March 6, 2013 (Supervisory Board) and jointly issued it on March 6, 2013 in accordance with section 161 AktG. The statement is permanently available on the website of Merck KGaA (www.merckgroup.com Investors
Corporate Governance). More information on corporate governance at Merck KGaA, including the
122
Report of the Supervisory Board
Merck 2012Corporate Governance

compensation of the Executive Board and Supervisory Board, is given in the Statement of Compliance on pages 101 et seq. of the Annual Report.
CommitteesThe Supervisory Board of Merck KGaA currently has no committees on account of the special features that apply to the Supervisory Board of a corporation with general partners (KGaA) under German company law and because a corresponding need for this has not emerged to date. Therefore, no report is given on the work of committees.
Personnel mattersNo member of the Supervisory Board participated in less than half of the Supervisory Board meetings in fiscal 2012. The following changes in the composition of the Supervisory Board took place in 2012: Effective April 30, 2012, Mr. Osman Ulusoy retired from the Supervisory Board. Mr. Jürgen Glaser was appointed by the court as a new member of the Supervisory Board as of May 1, 2012. Mr. Frieder Kaufmann retired from the Supervisory Board on May 10, 2012. Effective May 11, 2012, Mr. Berthold Wagner, previously replacement member for Mr. Frieder Kaufmann, became a member of the Supervisory Board and retired from the Supervisory Board as of December 31, 2012. Mr. Jens Frank was appointed by the court as a new member of the Supervisory Board effective January 31, 2013. There were no new elections, new appointments to bodies or formations of new bodies beyond those described in the foregoing.
Darmstadt, March 6, 2013
The Supervisory Board of Merck KGaA
Rolf KrebsChairman
123
Report of the Supervisory Board
Merck 2012Corporate Governance

Objectives of the Supervisory Board with respect to its composition
Initial situationAccording to section 5.4.1 (2) and (3) of the German Corporate Governance Code, the Supervisory Board shall specify concrete objectives regarding its composition which, while considering the specifics of the enterprise, take into account the international activities of the enterprise, potential conflicts of interest, the number of independent Supervisory Board members, an age limit to be specified for the members of the Supervisory Board, and diversity.
General notes on the composition of the Supervisory BoardThe Supervisory Board of Merck KGaA currently consists of 16 members, eight of whom represent the shareholders and a further eight who represent the employees. The eight employee representative members are elected by employee delegates pursuant to the provisions of the German Codetermination Act (Mitbestimmungsgesetz “MitbestG”). These consist of six company employees, including a senior executive, as well as two union representatives. The Supervisory Board has no statutory proposal right with respect to electing the delegates or employee representatives. Owing to a delegation right of E. Merck Beteiligungen KG, two of the eight shareholder representatives are specified. The Supervisory Board likewise has no statutory proposal right with respect to exercising this delegation right. The remaining six shareholder representatives are elected by the General Meeting. In accordance with section 124 (3) sentence 1 AktG, the Supervisory Board shall propose to the General Meeting Supervisory Board members for election. These proposals require a majority of the votes of the shareholder representative members of the Supervisory Board. The next scheduled election to the Supervisory Board shall take place at the upcoming 2013 General Meeting. The General Meeting is not required to follow the election proposals. The appointment objectives that the Supervisory Board sets forth below therefore do not represent requirements to be met by those eligible to elect or to delegate members. Instead, they are intended to express the objectives pursued by the Supervisory Board in office with regard to its advisory and monitoring functions.
Objectives of the Supervisory Board with respect to its compositionIn accordance with section 5.4.1 (2) of the German Corporate Governance Code, the Supervisory Board has specified the following objectives with respect to its composition and reports on the status of their implementation below. As recommended in the latest version of the German Corporate Governance Code dated May 15, 2012, an objective regarding the number of independent Supervisory Board members has been added.
Expertise and diversityProfessional qualifications and personal expertise are the two most important prerequisites for appointments to seats on the Supervisory Board. When proposing Supervisory Board candidates for election or delegation, the Supervisory Board will always give top priority to these prerequisites, which are essential for fulfilling its legal duties.
Overall, the Supervisory Board’s policy is to optimally meet its monitoring and advisory duties by having a diversity of members. Diversity includes, in particular, internationality as well as different experience backgrounds and career paths. The proportion of women on the Supervisory Board is also considered to be an aspect of diversity. When preparing proposals for election or delegation, due consideration shall be given in individual cases to the extent to which different, yet complementary professional profiles, career and life experiences as well as appropriate representation of both genders can benefit the work of the Supervisory Board. Additionally, the Supervisory Board shall support the Executive Board in its efforts to increase diversity within the company.
124 Merck 2012Corporate Governance

In-depth knowledge of the fields relevant to the companyThe Supervisory Board shall have at least four members with in-depth knowledge and experience of fields that are important to the company, including at least one expert in pharmaceuticals and one in chemicals.
Merck is currently meeting this objective for the composition of the Supervisory Board. At present, the Supervisory Board has more than four members who have indepth knowledge and experience of the pharmaceutical and chemical industries. More than four Supervisory Board members also have executive experience in companies that operate specifically in the pharmaceutical and/or chemical sectors.
Management experienceThe Supervisory Board shall have at least three members who have experience in managing or supervising a medium or large sized company.
The Supervisory Board has more than three members who have the corresponding experience. This includes both Supervisory Board members who were or still are management board members or directors in such companies, as well as Supervisory Board members who have gained experience in supervisory bodies of German and/or foreign companies of this size.
Family companyThe Supervisory Board shall have at least one member who has experience in managing medium or large sized family owned companies.
The Supervisory Board currently has multiple members who have the appropriate management experience in family owned companies of this size.
InternationalityThe Supervisory Board shall have at least three members with business experience in the main sales markets of Merck KGaA. Currently, the main sales markets of Merck KGaA are Europe, North and Latin America, and Asia-Pacific.
The present composition of the Supervisory Board satisfies this objective. More than three Supervisory Board members have entrepreneurial experience in Europe, covering a wide range of countries. More than three Supervisory Board members have experience in management positions in companies that oper ate globally. Two of these members worked in the United States, one in the United Kingdom, and one was responsible for the Asian region.
Women on the Supervisory BoardFour women are currently members of the Supervisory Board of Merck KGaA. This corresponds to 25% of the Supervisory Board. When nominating candidates for election to the Supervisory Board or making proposals for delegation, the Supervisory Board shall examine whether the percentage of women can be increased by suitable candidates.
The Supervisory Board currently consists of 25% women, which it considers a satisfactory percentage. This is based on both the percentage of women in management positions at Merck, as well as the fact that the supervisory boards of other companies have a comparable percentage of women.
125
Objectives of the Supervisory Board with respect to its composition
Merck 2012Corporate Governance

Number of independent members/no material conflicts of interestThe Supervisory Board is to have an adequate number of independent members. Assuming that the status of being an employee representative per se does not justify doubts of the independence criteria within the meaning of section 5.4.2 of the German Corporate Governance Code, normally all employee representatives should be independent within the meaning of the Code. In any case, at least four of the shareholder representatives on the Supervisory Board should be independent. According to the Articles of Association of Merck KGaA, six members representing the shareholders are to be elected by the General Meeting and two members are to be delegated. Taking this into account, the Supervisory Board considers four shareholder representatives to be an appropriate number of independent members. In the Supervisory Board’s estimation, the objectives concerning independent members are currently met. In particular, the Supervisory Board does not believe that membership of the Board of Partners of E. Merck KG conflicts with independence. The Board of Partners exists complementary to the competencies and the activities of the Supervisory Board. It is not to be expected that this will lead to material and not merely temporary conflicts of interest. It should also be taken into account that due to its substantial capital investment and unlimited personal liability, E. Merck KG has a strong interest in the businesses of Merck KGaA operating efficiently and in compliance with procedures, counteracting from the outset conflicts of interest between E. Merck KG and Merck KGaA and thus also corresponding conflicts of interst between the members of the respective corporate bodies.
Moreover, no one shall be proposed for election to the Supervisory Board who simultaneously serves on a body of or advises a major competitor of the company, or owing to another function, e.g. advisor to major contract partners of the company, could potentially become involved in a conflict of interest. No Supervisory Board member serves on a body of or advises a major competitor, or provides consul tancy services thereto. No Supervisory Board member performs a function that could lead to a lasting conflict of interest.
No age limitAn age limit for Supervisory Board members is not specified since age is not a criterion for qualifications and expertise. Moreover, we do not wish to forgo the many years of experience of Supervisory Board members.
The achievement of the aforementioned objectives shall be pursued initially until 2015, taking into account applicable law within the scope of elections and reelections, delegations as well as court appointments of replacement members if these become necessary. All Supervisory Board members will correspondingly influence those eligible to elect or delegate. Taking into consideration the aforementioned criteria and in accordance with its duties under German stock corporation law, the Supervisory Board proposes to the General Meeting the candidates it believes to be best suited in each case and will continue to do so in the future.
Every year, the Supervisory Board will provide information in the Annual Report on the status of implementing its objectives.
126
Objectives of the Supervisory Board with respect to its composition
Merck 2012Corporate Governance

206
127
# 04
MerckConsolidated Financial Statementsfor 2012
127 Consolidated Financial Statements128➝ Consolidated Income Statement129➝ Consolidated Statement of Comprehensive Income130➝ Consolidated Balance Sheet131➝ Consolidated Cash Flow Statement132➝ Consolidated Statement of Changes in Net Equity
134 Notes to the Group accounts134➝ General135➝ Scope of consolidation138➝ Accounting policies149➝ Notes to the Consolidated Income Statement156➝ Notes to the Consolidated Balance Sheet178➝ Segment reporting181➝ Notes to the Consolidated Cash Flow Statement184➝ Other disclosures
Merck 2012
Cons
olid
ated
Fin
anci
al S
tate
men
ts

4/5
IMerck Consolidated Income Statement
€ million Note 2012 2011
Sales 22 10,740.8 9,905.9Royalty, license and commission income 23 432.1 370.5Total revenues 11,172.9 10,276.4
Cost of sales 24 –3,157.7 –2,785.61
Gross margin 8,015.2 7,490.81
Marketing and selling expenses 25 –2,410.8 –2,385.71
Royalty, license and commission expenses 26 –579.8 –500.5Administration expenses 27 –552.2 –535.61
Other operating expenses and income 28 –1,126.5 –417.21
Research and development 30 –1,511.3 –1,514.01
Amortization of intangible assets 31 –871.6 –1,004.7Investment result 32 0.6 –1.0Operating result 963.6 1,132.11
Financial result 33 –254.6 –293.31
Profit before income tax 709.0 838.81
Income tax 34 –130.0 –220.81
Profit after tax 579.0 618.01
of which attributable to Merck KGaA shareholders (net income) 566.7 606.51
of which attributable to non-controlling interest 35 12.3 11.5
Earnings per share (in €) 36
basic 2.61 2.791
diluted 2.61 2.791
1 Previous year’s figures have been adjusted, see Note [5]
ME
RC
K A
NN
UA
L R
Ep
oR
t 20
12 –
th
E R
oA
d t
o t
oM
oR
Ro
w –
ww
w.M
ER
CK
gR
oU
p.C
oM
128 Merck 2012Consolidated Financial Statements
Cons
olid
ated
Fin
anci
al S
tate
men
ts
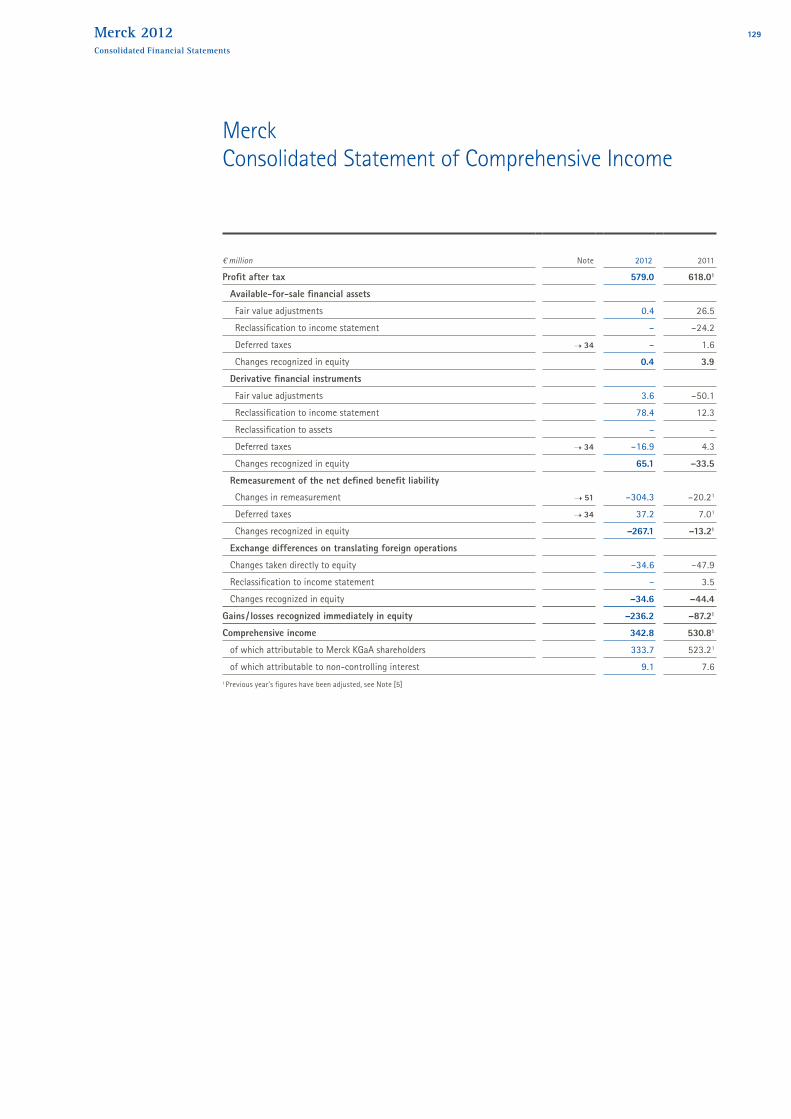
Merck Consolidated Statement of Comprehensive Income
€ million Note 2012 2011
Profit after tax 579.0 618.01
Available-for-sale financial assets Fair value adjustments 0.4 26.5 Reclassification to income statement – –24.2 Deferred taxes 34 – 1.6 Changes recognized in equity 0.4 3.9Derivative financial instruments Fair value adjustments 3.6 –50.1 Reclassification to income statement 78.4 12.3 Reclassification to assets – – Deferred taxes 34 –16.9 4.3 Changes recognized in equity 65.1 –33.5Remeasurement of the net defined benefit liability Changes in remeasurement 51 –304.3 –20.21
Deferred taxes 34 37.2 7.01
Changes recognized in equity –267.1 –13.21
Exchange differences on translating foreign operationsChanges taken directly to equity –34.6 –47.9Reclassification to income statement – 3.5Changes recognized in equity –34.6 –44.4
Gains / losses recognized immediately in equity –236.2 –87.21
Comprehensive income 342.8 530.81
of which attributable to Merck KGaA shareholders 333.7 523.21
of which attributable to non-controlling interest 9.1 7.61 Previous year’s figures have been adjusted, see Note [5]
129Merck 2012Consolidated Financial Statements
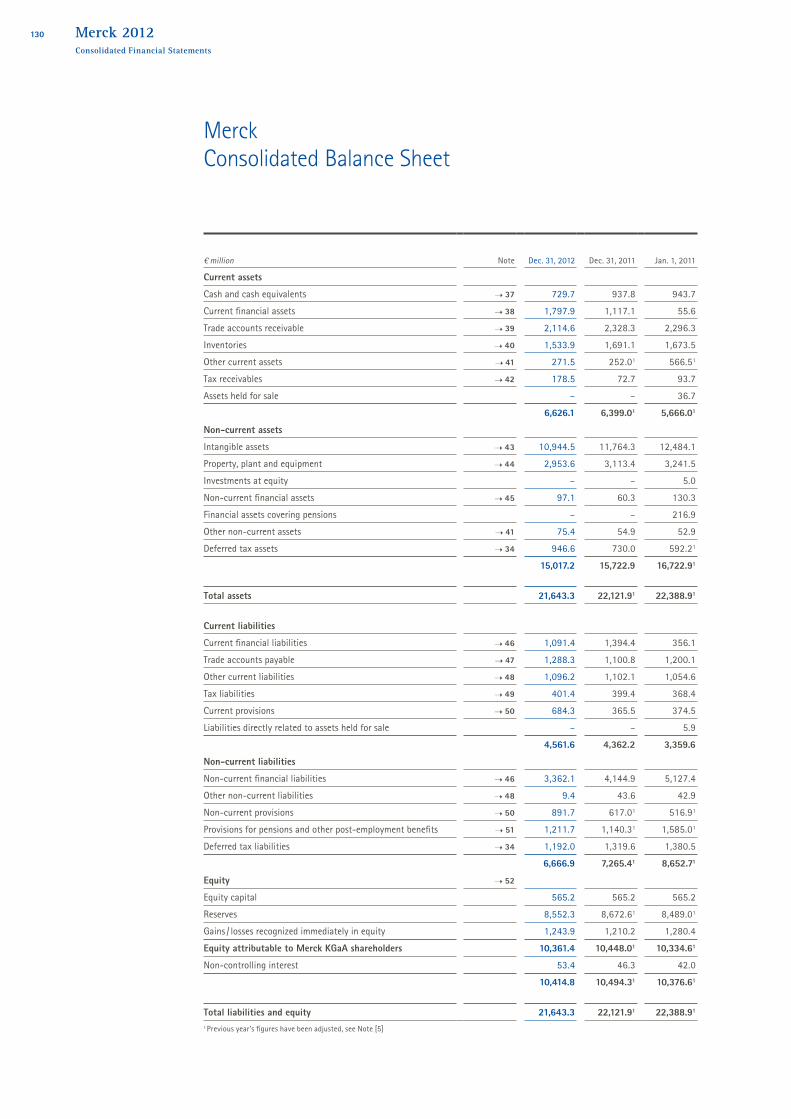
Merck Consolidated Balance Sheet
€ million Note Dec. 31, 2012 Dec. 31, 2011 Jan. 1, 2011
Current assets
Cash and cash equivalents 37 729.7 937.8 943.7Current financial assets 38 1,797.9 1,117.1 55.6Trade accounts receivable 39 2,114.6 2,328.3 2,296.3Inventories 40 1,533.9 1,691.1 1,673.5Other current assets 41 271.5 252.01 566.51
Tax receivables 42 178.5 72.7 93.7Assets held for sale – – 36.7
6,626.1 6,399.01 5,666.01
Non-current assetsIntangible assets 43 10,944.5 11,764.3 12,484.1Property, plant and equipment 44 2,953.6 3,113.4 3,241.5Investments at equity – – 5.0Non-current financial assets 45 97.1 60.3 130.3Financial assets covering pensions – – 216.9Other non-current assets 41 75.4 54.9 52.9Deferred tax assets 34 946.6 730.0 592.21
15,017.2 15,722.9 16,722.91
Total assets 21,643.3 22,121.91 22,388.91
Current liabilitiesCurrent financial liabilities 46 1,091.4 1,394.4 356.1Trade accounts payable 47 1,288.3 1,100.8 1,200.1Other current liabilities 48 1,096.2 1,102.1 1,054.6Tax liabilities 49 401.4 399.4 368.4Current provisions 50 684.3 365.5 374.5Liabilities directly related to assets held for sale – – 5.9
4,561.6 4,362.2 3,359.6Non-current liabilitiesNon-current financial liabilities 46 3,362.1 4,144.9 5,127.4Other non-current liabilities 48 9.4 43.6 42.9Non-current provisions 50 891.7 617.01 516.91
Provisions for pensions and other post-employment benefits 51 1,211.7 1,140.31 1,585.01
Deferred tax liabilities 34 1,192.0 1,319.6 1,380.56,666.9 7,265.41 8,652.71
Equity 52
Equity capital 565.2 565.2 565.2Reserves 8,552.3 8,672.61 8,489.01
Gains / losses recognized immediately in equity 1,243.9 1,210.2 1,280.4Equity attributable to Merck KGaA shareholders 10,361.4 10,448.01 10,334.61
Non-controlling interest 53.4 46.3 42.010,414.8 10,494.31 10,376.61
Total liabilities and equity 21,643.3 22,121.91 22,388.91
1 Previous year’s figures have been adjusted, see Note [5]
130 Merck 2012Consolidated Financial Statements

Merck Consolidated Cash Flow Statement
€ million Note 2012 2011
Profit after tax 579.0 618.01
Depreciation / amortization / impairment losses / write-ups 1,396.6 1,597.4Changes in inventories 140.6 –75.3Changes in trade accounts receivable 186.2 –3.7Changes in trade accounts payable 198.8 –119.3Changes in provisions 378.6 –418.71
Changes in other assets and liabilities –383.5 –150.01
Neutralization of gain / loss on disposals of assets –31.6 –208.8Other non-cash income and expenses 7.5 31.6Net cash flows from operating activities 55 2,472.2 1,271.2
Investments in intangible assets –144.2 –79.7Investments in property, plant and equipment –329.1 –366.3Acquisitions –20.6 –161.0Investments in non-current financial assets –42.4 –10.5Disposal of non-current assets 93.6 787.4Purchase / sale of marketable securities 10.4 –4.7Changes in other financial assets –725.6 –1,061.2Net cash flows from investing activities 56 –1,157.9 –896.0
Dividend payments –102.6 –86.8Profit transfers to E. Merck KG and changes in reserves –304.5 –326.5Payments from transactions with no change of control –15.0 –Changes in liabilities to E. Merck KG 10.6 77.3Repayment of bonds –1,000.0 –20.8New borrowings of other current and non-current financial liabilities 37.5 16.8Repayments of other current and non-current financial liabilities –145.4 –44.1Net cash flows from financing activities 57 –1,519.4 –384.1
Changes in cash and cash equivalents –205.1 –8.9Changes in cash and cash equivalents due to currency translation –3.0 1.8Cash and cash equivalents as of January 1 937.8 943.7Cash and cash equivalents as of December 31 729.7 936.6Plus cash and cash equivalents included in assets held for sale – 1.2
Cash and cash equivalents as of December 31(consolidated balance sheet) 37 729.7 937.81 Previous year’s figures have been adjusted, see Note [5]
131Merck 2012Consolidated Financial Statements

€ million
Equity capital Retained earnings Gains / losses recognized immediately in equity
Equity attributable to Merck KGaA
shareholders Non-controlling interest EquityGeneral partner’s equity
Merck KGaASubscribed capital
Merck KGaA
Capital reserves (share premium)
Merck KGaARetained earnings/ Net retained profit
Remeasurement of defined benefit plans
Available-for-sale financial assets
Derivative financial instruments
Currency translation difference
Balance as of January 1, 2011 397.2 168.0 3,813.7 5,040.9 –370.4 –3.1 –61.1 1,344.6 10,329.8 42.0 10,371.8Adjustments to IAS 19 – – – –0.6 5.4 – – – 4.8 – 4.8
Balance as of January 1, 2011 adjusted 397.2 168.0 3,813.7 5,040.3 –365.0 –3.1 –61.1 1,344.6 10,334.6 42.0 10,376.6Profit after tax 1 – – – 606.5 – – – – 606.5 11.5 618.0
Gains / losses recognized 1 immediately in equity – – – – –13.1 3.9 –33.5 –40.6 –83.3 –3.9 –87.2Comprehensive income 1 – – – 606.5 –13.1 3.9 –33.5 –40.6 523.2 7.6 530.8Dividend payments – – – –80.8 – – – – –80.8 –6.0 –86.8
Profit transfers to / from E. Merck KG including changes in reserves – – – –326.5 – – – – –326.5 – –326.5
Changes in scope of consolidation / Other – – – –2.4 –0.1 – – – –2.5 2.7 0.2
Balance as of December 31, 20111 397.2 168.0 3,813.7 5,237.1 –378.2 0.8 –94.6 1,304.0 10,448.0 46.3 10,494.3
Balance as of January 1, 20121 397.2 168.0 3,813.7 5,237.1 –378.2 0.8 –94.6 1,304.0 10,448.0 46.3 10,494.3Profit after tax – – – 566.7 – – – – 566.7 12.3 579.0
Gains / losses recognized immediately in equity – – – – –266.7 0.4 65.1 –31.8 –233.0 –3.2 –236.2Comprehensive income – – – 566.7 –266.7 0.4 65.1 –31.8 333.7 9.1 342.8Dividend payments – – – –96.9 – – – – –96.9 –5.7 –102.6
Profit transfers to / from E. Merck KG including changes in reserves – – – –304.5 – – – – –304.5 – –304.5
Transactions with no change of control – – – –15.3 – – – – –15.3 0.3 –15.0
Changes in scope of consolidation / Other – – – –3.2 –0.4 – – – –3.6 3.4 –0.2
Balance as of December 31, 2012 397.2 168.0 3,813.7 5,383.9 –645.3 1.2 –29.5 1,272.2 10,361.4 53.4 10,414.81 Previous year’s figures have been adjusted, see Note [5]
Merck Consolidated Statement of Changes in Net EquityFor details see Note [52]
132 Merck 2012Consolidated Financial Statements

€ million
Equity capital Retained earnings Gains / losses recognized immediately in equity
Equity attributable to Merck KGaA
shareholders Non-controlling interest EquityGeneral partner’s equity
Merck KGaASubscribed capital
Merck KGaA
Capital reserves (share premium)
Merck KGaARetained earnings/ Net retained profit
Remeasurement of defined benefit plans
Available-for-sale financial assets
Derivative financial instruments
Currency translation difference
Balance as of January 1, 2011 397.2 168.0 3,813.7 5,040.9 –370.4 –3.1 –61.1 1,344.6 10,329.8 42.0 10,371.8Adjustments to IAS 19 – – – –0.6 5.4 – – – 4.8 – 4.8
Balance as of January 1, 2011 adjusted 397.2 168.0 3,813.7 5,040.3 –365.0 –3.1 –61.1 1,344.6 10,334.6 42.0 10,376.6Profit after tax 1 – – – 606.5 – – – – 606.5 11.5 618.0
Gains / losses recognized 1 immediately in equity – – – – –13.1 3.9 –33.5 –40.6 –83.3 –3.9 –87.2Comprehensive income 1 – – – 606.5 –13.1 3.9 –33.5 –40.6 523.2 7.6 530.8Dividend payments – – – –80.8 – – – – –80.8 –6.0 –86.8
Profit transfers to / from E. Merck KG including changes in reserves – – – –326.5 – – – – –326.5 – –326.5
Changes in scope of consolidation / Other – – – –2.4 –0.1 – – – –2.5 2.7 0.2
Balance as of December 31, 20111 397.2 168.0 3,813.7 5,237.1 –378.2 0.8 –94.6 1,304.0 10,448.0 46.3 10,494.3
Balance as of January 1, 20121 397.2 168.0 3,813.7 5,237.1 –378.2 0.8 –94.6 1,304.0 10,448.0 46.3 10,494.3Profit after tax – – – 566.7 – – – – 566.7 12.3 579.0
Gains / losses recognized immediately in equity – – – – –266.7 0.4 65.1 –31.8 –233.0 –3.2 –236.2Comprehensive income – – – 566.7 –266.7 0.4 65.1 –31.8 333.7 9.1 342.8Dividend payments – – – –96.9 – – – – –96.9 –5.7 –102.6
Profit transfers to / from E. Merck KG including changes in reserves – – – –304.5 – – – – –304.5 – –304.5
Transactions with no change of control – – – –15.3 – – – – –15.3 0.3 –15.0
Changes in scope of consolidation / Other – – – –3.2 –0.4 – – – –3.6 3.4 –0.2
Balance as of December 31, 2012 397.2 168.0 3,813.7 5,383.9 –645.3 1.2 –29.5 1,272.2 10,361.4 53.4 10,414.81 Previous year’s figures have been adjusted, see Note [5]
133Merck 2012Consolidated Financial Statements

General
( 1 ) Company informationThe accompanying consolidated financial statements as at December 31, 2012 have been prepared with Merck KGaA, Frankfurter Strasse 250, 64293 Darmstadt, which manages the operations of the Merck Group, as parent company. In accordance with the provisions of the German financial reporting disclosure law (Publi zitäts ge setz), consolidated financial statements are also prepared for E. Merck KG, the ultimate parent company and general partner of Merck KGaA with an equity interest of 70.27% as of December 31, 2012. These include Merck KGaA and its subsidiaries. The authoritative German versions of these financial statements are filed with the electronic German Federal Gazette (elektronischer Bundesanzeiger) and can be accessed at www.bundesanzeiger.de.
( 2 ) Reporting principlesThe consolidated financial statements of the Merck Group have been prepared in accordance with consistent accounting policies and in euros, the reporting currency. Pursuant to section 315a of the German Commercial Code (HGB), the International Financial Reporting Standards (IFRS) in force on the reporting date and adopted by the European Union as issued by the International Accounting Standards Board (IASB) and the IFRS Interpretations Committee (IFRIC) have been applied.
The following rule takes effect as of fiscal 2012: Amendment to IFRS 7 “Financial Instruments: Disclosures”
The new rule did not have any material effects on the consolidated financial statements.
The following rule was applied in advance as of fiscal 2012: Amendment to IAS 19 “Employee Benefits”
The amended standard was published by the IASB in June 2011, adopted by the European Union in June 2012, and is effective for financial reporting periods beginning on or after January 1, 2013. The changes that the early application of the amended standard involve are described in Note [5] “Accounting policies”.
The following rules take effect as of fiscal 2013: IFRS 13 “Fair Value Measurement“ Amendment to IAS 1 ”Presentation of Financial Statements” Amendment to IAS 12 “Income Taxes“ Amendment to IFRS 1 “First-time Adoption of International Financial Reporting Standards“ Amendment to IFRS 7 “Financial Instruments: Disclosures“ IFRIC 20 “Stripping Costs in the Production Phase of a Surface Mine“
From today’s perspective we do not expect the new rules to have a material impact on the consolidated financial statements.
The following rules take effect as of fiscal 2014: IFRS 10 “Consolidated Financial Statements“ IFRS 11 “Joint Arrangements“ IFRS 12 “Disclosure of Interests in Other Entities“ Amendment to IAS 27 “Separate Financial Statements“ Amendment to IAS 28 “Investments in Associates and Joint Ventures“ Amendment to IAS 32 “Financial Instruments: Presentation”
Merck Notes to the Group accounts
134 Merck 2012Consolidated Financial Statements

From today’s perspective we do not expect the new rules to have a material impact on the consolidated financial statements.
The following rules were published by the International Accounting Standards Board and the IFRS Interpretations Committee, but not yet adopted by the EU as of the balance sheet date:
IFRS 9 “Financial Instruments“ Amendment to IAS 27 “Separate Financial Statements“ Amendment to IFRS 1 “First-time Adoption of International Financial Reporting Standards“ Amendment to IFRS 7 “Financial Instruments: Disclosures“ Amendment to IFRS 9 “Financial Instruments“ Amendments to IFRS 10 “Consolidated Financial Statements“ Amendment to IFRS 11 “Joint Arrangements“ Amendments to IFRS 12 “Disclosure of Interests in Other Entities“ “Improvements to International Financial Reporting Standards” (IASB version issued in May 2012)
The impact that IFRS 9, which is expected to become effective as of 2015, will have on the consolidated financial statements is currently being examined. At the present time, the other new rules are not expected to have any material effects on the consolidated financial statements.
Scope of consolidation
( 3 ) Changes in the scope of consolidationIncluding the parent company Merck KGaA, Darmstadt, 203 (2011: 228) German and foreign companies were fully consolidated in the annual financial statements of the Merck Group. Of these companies, 178 (2011: 206) are located abroad. No companies were consolidated on a pro rata basis or using the equity method as of the balance sheet date. Since the beginning of 2012, the following changes have taken place:With the acquisitions of CellASIC Corp, Hayward, CA, USA, and Biochrom AG, Berlin, Germany, two further companies were consolidated. Details of these acquisitions and their impact on the financial statements are presented in Note [4]. Overall, the following further changes in the scope of consolidation had no material impact on the financial statements: Four newly established companies were included in the consolidated financial statements for the first time. Owing to 20 liquidations and 11 mergers, 31 companies were deconsolidated.
Due to secondary importance, 28 (2011: 25) subsidiaries were not consolidated. Overall, the impact of these subsidiaries on sales, profit after tax, assets and equity was less than 1% relative to the entire Merck Group. The interests in subsidiaries not consolidated due to secondary importance are measured at cost and presented under non-current financial assets. The list of shareholdings presents all of the companies included in the consolidated financial statements as well as all of the Merck Group’s shareholdings (see Note [74]).
135
General / Scope of consolidation
Merck 2012Consolidated Financial Statements

( 4 ) AcquisitionsOn April 27, 2012, Merck acquired 100% of the shares in CellASIC Corp., Hayward, CA, USA, and then merged the company with EMD Millipore Corp., Billerica, MA, USA. This business, which is part of the Merck Millipore division, has expanded the Bioscience portfolio. The first-time consolidation of CellASIC Corp. took place on April 27, 2012.
On November 6, 2012, Merck acquired 100% of the shares in Biochrom AG, Berlin, Germany. The acquired company is a specialist in the production and commercialization of cell culture media and buffer solutions and is expected to strengthen the Process Solutions business unit of the Merck Millipore division. The first-time consolidation of Biochrom AG took place on November 6, 2012.
The purchase price of the two acquisitions totaled € 21.7 million and was paid in cash. Acquisition-related costs amounting to € 0.5 million were incurred in connection with the aforementioned acquisitions and were expensed in the operating result. Within the scope of the purchase price allocation, the acquired assets and liabilities were recognized at fair values in the balance sheet in accordance with IFRS 3.
The acquisitions had the following effects on the consolidated balance sheet:
€ million
Current assets
Cash and cash equivalents 1.1Inventories 7.4Receivables 1.3Other current assets 0.6
10.4Non-current assetsGoodwill 8.0Other intangible assets 6.1Property, plant and equipment 6.3
20.4Assets 30.8
Current liabilitiesCurrent financial liabilities 0.8Other current liabilities 2.1
2.9Non-current liabilitiesNon-current financial liabilities 3.1Other non-current liabilities 0.2Deferred tax liabilities 2.9
6.2Liabilities 9.1
Net assets acquired / purchase price 21.7
136
Scope of consolidation
Merck 2012Consolidated Financial Statements

The most significant impact of the purchase price allocations on the balance sheet and the income state-ment resulted from the fair value adjustment of intangible assets. Intangible assets related particularly to the measurement of existing customer relationships and technologies. The gross value of the acquired receivables at the time of the acquisition amounted to € 1.3 million. The best possible estimate of the irrecoverable debts amounted to less than € 0.1 million. The deferred tax liabilities disclosed related mainly to the remeasurement of intangible assets. The remaining difference between the purchase prices of € 21.7 million and fair values of € 13.7 million was reported as goodwill. This mainly included the expertise of the workforce as well as synergies from the expansion of the Merck Millipore product portfolio, increases in market shares, and from combining the companies. The fair value adjustments made as part of the purchase price allocation were still to be considered as preliminary since the accounting analyses and calculations had not yet been completed. There fore, adjustments to these items could still occur in 2013 based on new information.
The impact of the acquisitions on total revenues and profit after tax was as follows:
€ million
Total revenues 2.4Profit after tax –0.3
Profit after tax also included the amortization of the step-up of intangible assets within the scope of the purchase price allocation as well as higher expenses due to the step-up of the acquired inventories to fair values. Had the two acquisitions been included in the consolidated financial statements of the Merck Group as of January 1, 2012, total revenues and profit after tax for the period from January 1 to December 31, 2012 would have amounted to € 11,185.9 million and € 579.2 million, respectively.
With respect to acquisitions made in 2011, no subsequent purchase price allocation adjustments occurred.
137
Scope of consolidation
Merck 2012Consolidated Financial Statements
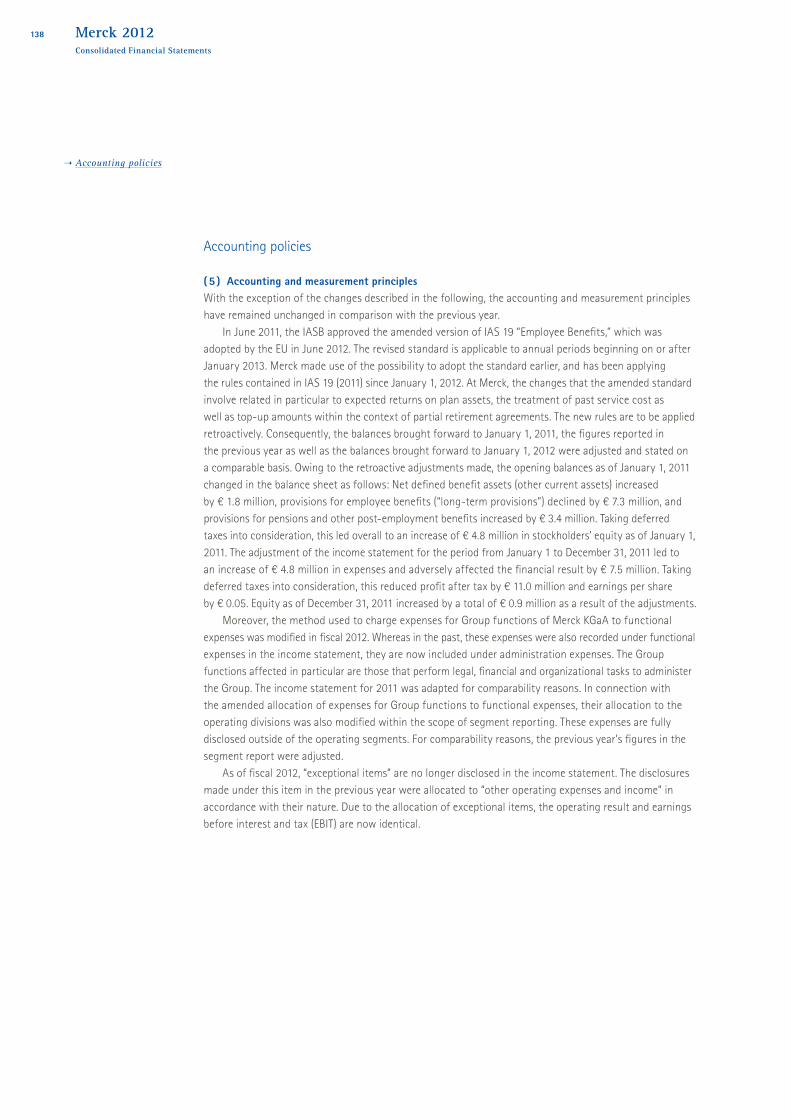
Accounting policies
( 5 ) Accounting and measurement principlesWith the exception of the changes described in the following, the accounting and measurement principles have remained unchanged in comparison with the previous year.
In June 2011, the IASB approved the amended version of IAS 19 “Employee Benefits,” which was adopted by the EU in June 2012. The revised standard is applicable to annual periods beginning on or after January 2013. Merck made use of the possibility to adopt the standard earlier, and has been applying the rules contained in IAS 19 (2011) since January 1, 2012. At Merck, the changes that the amended standard involve related in particular to expected returns on plan assets, the treatment of past service cost as well as top-up amounts within the context of partial retirement agreements. The new rules are to be applied retroactively. Consequently, the balances brought forward to January 1, 2011, the figures reported in the previous year as well as the balances brought forward to January 1, 2012 were adjusted and stated on a comparable basis. Owing to the retroactive adjustments made, the opening balances as of January 1, 2011 changed in the balance sheet as follows: Net defined benefit assets (other current assets) increased by € 1.8 million, provisions for employee benefits (“long-term provisions”) declined by € 7.3 million, and provisions for pensions and other post-employment benefits increased by € 3.4 million. Taking deferred taxes into consideration, this led overall to an increase of € 4.8 million in stockholders’ equity as of January 1, 2011. The adjustment of the income statement for the period from January 1 to December 31, 2011 led to an increase of € 4.8 million in expenses and adversely affected the financial result by € 7.5 million. Taking deferred taxes into consideration, this reduced profit after tax by € 11.0 million and earnings per share by € 0.05. Equity as of December 31, 2011 increased by a total of € 0.9 million as a result of the adjustments.
Moreover, the method used to charge expenses for Group functions of Merck KGaA to functional expenses was modified in fiscal 2012. Whereas in the past, these expenses were also recorded under functional expenses in the income statement, they are now included under administration expenses. The Group functions affected in particular are those that perform legal, financial and organizational tasks to administer the Group. The income statement for 2011 was adapted for comparability reasons. In connection with the amended allocation of expenses for Group functions to functional expenses, their allocation to the operating divisions was also modified within the scope of segment reporting. These expenses are fully disclosed outside of the operating segments. For comparability reasons, the previous year’s figures in the segment report were adjusted.
As of fiscal 2012, “exceptional items” are no longer disclosed in the income statement. The disclosures made under this item in the previous year were allocated to “other operating expenses and income” in accordance with their nature. Due to the allocation of exceptional items, the operating result and earnings before interest and tax (EBIT) are now identical.
138
Accounting policies
Merck 2012Consolidated Financial Statements
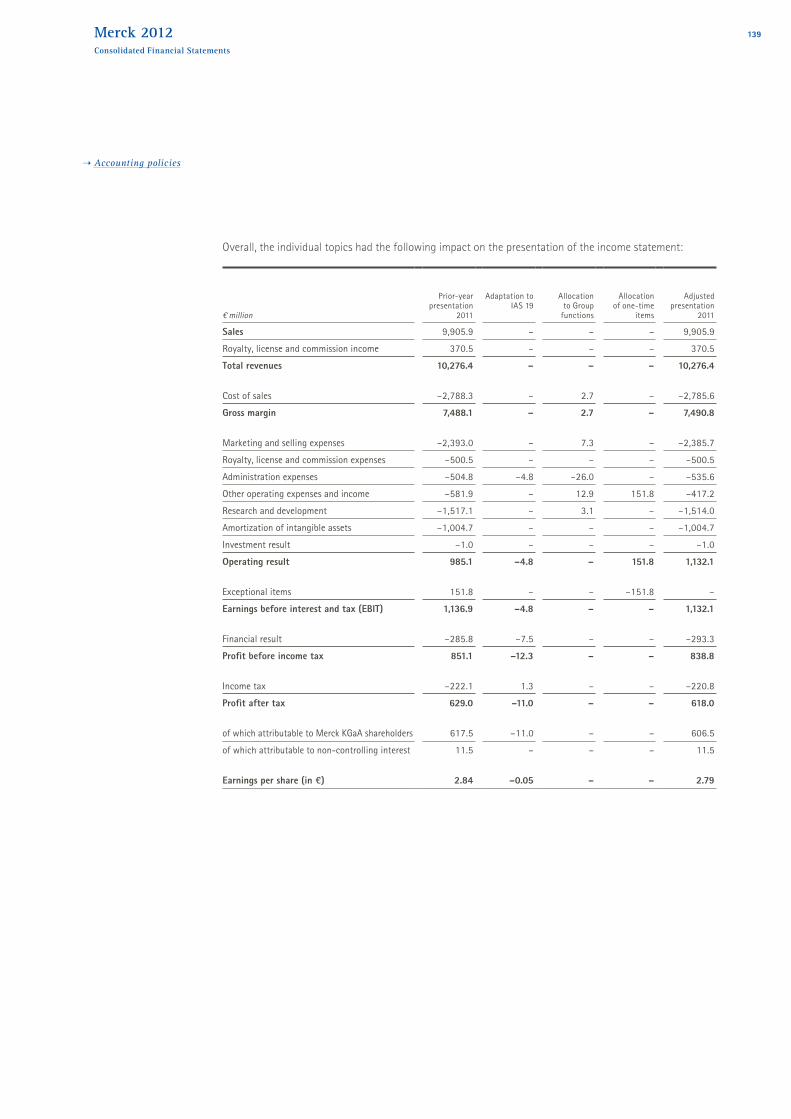
Overall, the individual topics had the following impact on the presentation of the income statement:
€ million
Prior-year presentation
2011
Adaptation to IAS 19
Allocation to Group
functions
Allocation of one-time
items
Adjusted presentation
2011
Sales 9,905.9 – – – 9,905.9Royalty, license and commission income 370.5 – – – 370.5Total revenues 10,276.4 – – – 10,276.4
Cost of sales –2,788.3 – 2.7 – –2,785.6Gross margin 7,488.1 – 2.7 – 7,490.8
Marketing and selling expenses –2,393.0 – 7.3 – –2,385.7Royalty, license and commission expenses –500.5 – – – –500.5Administration expenses –504.8 –4.8 –26.0 – –535.6Other operating expenses and income –581.9 – 12.9 151.8 –417.2Research and development –1,517.1 – 3.1 – –1,514.0Amortization of intangible assets –1,004.7 – – – –1,004.7Investment result –1.0 – – – –1.0Operating result 985.1 –4.8 – 151.8 1,132.1
Exceptional items 151.8 – – –151.8 –Earnings before interest and tax (EBIT) 1,136.9 –4.8 – – 1,132.1
Financial result –285.8 –7.5 – – –293.3Profit before income tax 851.1 –12.3 – – 838.8
Income tax –222.1 1.3 – – –220.8Profit after tax 629.0 –11.0 – – 618.0
of which attributable to Merck KGaA shareholders 617.5 –11.0 – – 606.5of which attributable to non-controlling interest 11.5 – – – 11.5
Earnings per share (in €) 2.84 –0.05 – – 2.79
139
Accounting policies
Merck 2012Consolidated Financial Statements

( 6 ) Discretionary decisions and estimation uncertaintyTo the extent that significant discretionary decisions are made by management in the application of accounting methods, these are described in the following Notes. The preparation of the consolidated financial statements requires that assumptions and estimates be made to a certain extent. This affects the amount of assets and liabilities, information on contingent assets and liabilities, as well as reported income and expenses. Corresponding estimation uncertainty results, for example, when measuring intangible assets, property, plant and equipment, as well as provisions. In each case, the assumptions and estimates are based on the state of knowledge and data available as of the reporting date; however the actual results may deviate from the expected values and lead to corresponding adjustments of book values for the assets and liabilities. The assumptions and estimates relevant to the preparation of the consolidated financial statements are reviewed on an ongoing basis. Changes to estimates are taken into account in the period in which the change was made as well as in future periods insofar as the change relates to both the reporting period and later periods. The material assumptions and parameters for the estimates made are presented in the respective Notes.
( 7 ) Consolidation methodsThe consolidated financial statements are based on the single-entity financial statements of the consolidated companies as of the balance sheet date, which were prepared applying consistent accounting polices in accordance with IFRS.
Acquisitions are accounted for using the purchase method in accordance with IFRS 3. Subsidiaries acquired and consolidated for the first time were measured at the carrying values at the time of acquisition on the basis of financial statements prepared for this purpose. Differences resulting in this connection are recognized as assets and liabilities to the extent that their fair values differ from the values actually carried in the financial statements. Any remaining – and usually positive – difference is recognized as goodwill within intangible assets, and is subjected to an impairment test if there are indications of impairment, or at least once a year.
In cases where a company was not acquired in full, non-controlling interest is measured using the fair value of the proportionate share of net assets. The option to measure non-controlling interest at fair value (full goodwill method) was not utilized.
When additional shares in non-controlling interest are acquired, the purchase price amount that exceeds the book value of this interest is recognized immediately in equity.
Interests in associates over which Merck has significant influence are – as far as they are material – included in accordance with IAS 28 using the equity method of accounting.
Intragroup sales, expenses and income, as well as all receivables and payables between the consolidated companies, were eliminated. The effects of intragroup deliveries reported under non-current assets and inventories were adjusted by eliminating any intragroup profits. In accordance with IAS 12, deferred taxes are applied to these consolidation measures.
140
Accounting policies
Merck 2012Consolidated Financial Statements

( 8 ) Currency translationThe functional currency concept applies to the translation of financial statements of consolidated companies prepared in foreign currencies. The subsidiaries of the Merck Group generally conduct their operations independently. The functional currency of these companies is normally the respective local currency. Assets and liabilities are measured at the closing rate, and income and expenses are measured at weighted average annual rates in euros, the reporting currency. Any currency translation differences aris ing during consolidation of Group companies are taken directly to equity. If Group companies are deconsolidated, existing currency differences are reversed and recognized in income. The local currency is not the functional currency at only a few subsidiaries.
When the financial statements of consolidated companies are prepared, business transactions that are conducted in currencies other than the functional currency are recorded using the current exchange rate on the date of the transaction. Foreign currency monetary items (cash and cash equivalents, receivables and payables) in the year-end financial statements of the consolidated companies prepared in the functional currency are translated at the respective closing rates. Exchange differences from the translation of monetary items are recognized in the income statement with the exception of net investments in a foreign operation. Hedged items are like wise carried at the closing rate. The resulting gains or losses are eliminated in the income statement against offsetting amounts from the fair value measurement of derivatives.
Currency translation was based on the following key exchange rates:
Average annual rate Closing rate
1 € = 2012 2011 Dec. 31, 2012 Dec. 31, 2011
British pound (GBP) 0.814 0.870 0.816 0.838Chinese renminbi (CNY) 8.143 9.001 8.217 8.151Japanese yen (JPY) 103.233 111.119 113.568 100.361Swiss franc (CHF) 1.205 1.234 1.207 1.217Taiwan dollar (TWD) 38.187 40.938 38.282 39.170U.S. dollar (USD) 1.293 1.393 1.319 1.294
( 9 ) Recognition of sales and other revenueSales are recognized net of related taxes as well as revenue-lowering items. They are deemed realized once the goods have been delivered or the services have been rendered, the material opportunities and risks of ownership have been transferred to the purchaser, the amount of revenue can be reliably determined, and payment is sufficiently probable. When sales are recognized, estimated amounts are taken into account for expected revenue-lowering items, for example rebates, discounts and returns.
In addition to revenue from the sale of goods, sales also include revenue from services, but the volume involved is insignificant.
141
Accounting policies
Merck 2012Consolidated Financial Statements

Depending on the substance of the relevant agreements, royalty, license and commission income is recognized either immediately or on an accrued basis if further contractual obligations exist.
Dividend income is recognized when the shareholders’ right to receive the dividend is established. This is normally the date of the dividend resolution. Interest income is recognized on a pro rata basis using the effective interest rate method.
( 10 ) Research and developmentResearch and development costs comprise the costs of research departments and process development, the cost of clinical trials as well as the expenses incurred as a result of research and development collaborations.
The costs of research cannot be capitalized and are expensed in full in the period in which they are incurred. As self-developed intangible assets, it is necessary to capitalize development expenses if they can be reliably measured and can be expected to lead to economic future benefits. This means that the necessary resources are available for the development of an asset, the asset is technically feasible, its completion and use are intended, and it is also marketable. Owing to the high risks up to the time that pharmaceutical products are approved, these criteria are not met in the pharmaceutical business. Costs incurred after regulatory approval are usually insignificant and are therefore not recognized as intangible assets. Owing to the risks existing up until market launch, development expenses in the Merck Millipore and Performance Materials divisions can likewise not be capitalized.
In addition to our own research and development, Merck is also a partner in collaborations aimed at developing marketable products. These collaborations typically involve payments for the achievement of certain milestones. Here, assessments are made as to whether these upfront or milestone payments represent compensation for services performed (research and development expense) or whether the payments represent the acquisition of an asset that has to be capitalized. Reimbursements for R & D are offset against research and development costs.
( 11 ) Financial instruments: PrinciplesA financial instrument is any contract that gives rise to both a financial asset of one entity and a financial liability or equity instrument of another entity. A distinction is made between non-derivative and derivative financial instruments. Derivatives can be embedded in other financial instruments or in non-financial instruments. Under IFRS, an embedded derivative must be separated from the host contract and accounted for separately at fair value if the economic characteristics of the embedded derivative are not closely related to the economic characteristics of the host contract. Merck did not have any separable embedded derivatives during the fiscal year. Issued compound financial instruments with both an equity and a liability component must be recognized separately depending on their characteristics. Merck was not a party to hybrid or compound financial instruments during the fiscal year.
As a rule, Merck accounts for regular way purchases or sales of financial instruments at the settlement date and derivatives at the trade date.
Financial assets and financial liabilities are generally measured at fair value on initial recognition, if necessary including transaction costs.
142
Accounting policies
Merck 2012Consolidated Financial Statements

Financial assets are derecognized in part or in full if the contractual rights to the cash flows from the financial asset have expired or if control and substantially all the risks and rewards of ownership of the financial asset have been transferred to a third party. Financial liabilities are derecognized if the contractual obligations have been discharged, cancelled, or expired. Cash and cash equivalents are carried at nominal value.
( 12 ) Financial instruments: Categories and classes of financial instrumentsFinancial assets and liabilities are classified into the following IAS 39 measurement categories and IFRS 7 classes.
“Financial assets and financial liabilities at fair value through profit or loss” can be both non-derivative and derivative financial instruments. Financial instruments in this category are subsequently measured at fair value. Gains and losses on financial instruments in this measurement category are recognized directly in the income statement. This measurement category includes an option to designate non-derivative financial instruments as at “fair value through profit or loss” on initial recognition (fair value option) or as “financial instruments held for trading”. We did not apply the fair value option during the fiscal year. Merck only assigns derivatives to the “held for trading” measurement category. Special accounting rules apply to derivatives that are designated as hedging instruments in a hedging relationship (hedge accounting).
“Held-to-maturity investments” are non-derivative financial assets with fixed or determinable payments and a fixed maturity that are quoted in an active market. To be able to assign a financial asset to this measurement category, the entity must have the positive intention and ability to hold it to maturity. These investments are subsequently measured at amortized cost. If there is objective evidence that such an asset is impaired, an impairment loss is recognized in profit or loss. Subsequent reversals of impairment losses are also recognized in profit or loss up to the amount of the original cost of the asset. At Merck, this measurement category is used for current and non-current financial assets.
“Loans and receivables” are non-derivative financial assets with fixed or determinable payments that are not quoted in an active market. They are subsequently measured at amortized cost. If there is objective evidence that such assets are impaired, an impairment loss is recognized in the income statement. Subsequent reversals of impairment losses are also recognized in the income statement up to the amount of the original cost of the asset. Long-term non-interest-bearing and low-interest receivables are measured at their present value. Merck primarily assigns trade receivables, loans, and miscellaneous other current and non-current receivables to this measurement category. Merck uses a separate allowance account for impairment losses on trade and other receivables.
“Available-for-sale financial assets” are those non-derivative financial assets that were not assigned to the measurement categories “financial assets and financial liabilities at fair value through profit or loss”, “loans and receivables” or “held-to-maturity investments”. Financial assets in this category are subsequently measured at fair value. Changes in fair value are recognized immediately in equity and are only transferred to the income statement when the financial asset is derecognized. If there is objective evidence that such an asset is impaired, an impairment loss is recognized immediately in the income statement, including any amounts already recognized in equity. Reversals of impairment losses on previously impaired equity instruments are recognized immediately in equity. Reversals of impairment losses on previously impaired
143
Accounting policies
Merck 2012Consolidated Financial Statements

debt instruments are recognized in profit or loss up to the amount of the impairment loss. Any amount in excess of this is recognized directly in equity. At Merck, this measurement category is used in particular for securities and financial assets, as well as interests in subsidiaries that are not consolidated due to secondary importance (affiliates).
Financial assets in this category for which no fair value is available or fair value cannot be reliably determined are measured at cost less any cumulative impairment losses. Impairment losses on financial assets carried at cost may not be reversed.
“Other liabilities” are non-derivative financial liabilities that are subsequently measured at amortized cost. Differences between the amount received and the amount to be repaid are amortized to profit or loss over the maturity of the instrument. Merck primarily assigns financial liabilities, trade pay-ables, and miscellaneous other non-derivative current and non-current liabilities to this category.
There were no reclassifications between the aforementioned measurement categories during the fiscal year.
The classes required to be disclosed in accordance with IFRS 7 consist of the measurement categories set out above. Additionally, cash and cash equivalents with an original maturity of up to 90 days, finance lease liabilities, and hedging derivatives used in hedge accounting are also classed in accordance with IFRS 7.
( 13 ) Financial instruments: Derivative and hedge accountingMerck uses derivatives solely to hedge recognized assets or liabilities and forecast transactions. Hedge accounting in accordance with IFRS is applied to some of these hedges. A distinction is made between fair value hedge accounting and cash flow hedge accounting. Designation of a hedging relationship requires a hedged item (underlying) and a hedging instrument assigned to that hedged item. At Merck, all hedges relate to existing or highly probable hedged items. Merck only uses derivatives as hedging instruments.
The hedging relationship must be effect ive at all times, i.e. the development of the value of the hedging instrument fully offsets changes in the value of the hedged item. In both cash flow and fair value hedges, the ineffective portion of the gain or loss on a hedging instrument is recognized in profit or loss. Merck uses the dollar offset method to measure hedge effectiveness. There are strict documentation requirements for hedge accounting. Derivatives that do not or no longer meet the documentation or effectiveness requirements for hedge accounting, or whose hedged item no longer exists, are reported as “financial assets and liabilities at fair value through profit or loss.” Changes in fair value are then recognized in profit or loss.
As a rule, the purpose of a fair value hedge is to offset the exposure to changes in the fair value of recognized hedged items (financial assets or financial liabilities) through offsetting changes in the fair value of a hedging instrument. Offsetting gains and losses on the hedging instrument resulting from changes in fair value are recognized in profit or loss, net of deferred taxes. Offsetting gains and losses on the hedged item that are attributable to the hedged risk are also recognized in profit or loss, irrespective of the item’s allocation to a measurement category.
144
Accounting policies
Merck 2012Consolidated Financial Statements

At Merck, cash flow hedges are normally a hedge of the exposure to variability in cash flows resulting from highly probable forecast transactions in foreign currencies. In cash flow hedges, the effective portion of the gains and losses on the hedging instrument is recognized in equity until the hedged item occurs. This is also the case if the hedging instrument expires, is sold, or is terminated before the hedged transaction occurs. The ineffective portion of a cash flow hedge is always recognized in profit or loss.
( 14 ) Other non-financial assets and liabilitiesOther non-financial assets are carried at amortized cost. Allowances are recognized for any credit risks. Long-term non-interest-bearing and low-interest receivables are carried at their present value. Other non-financial liabilities are carried at the amount to be repaid.
( 15 ) InventoriesInventories are carried at cost using the weighted average method. In accordance with IAS 2, in addition to directly attributable unit costs, manufacturing costs also include overheads attributable to the production process, which are determined on the basis of normal capacity utilization of the production facilities.
Inventories are written down if the net realizable value is lower than the acquisition or manu facturing cost carried in the balance sheet.
Inventory prepayments are recorded under other current assets.
( 16 ) Intangible assetsAcquired intangible assets are recognized at cost and are classified as assets with finite and indefinite useful lives. Self-developed intangible assets are only capitalized if the requirements specified by IAS 38 have been met. Intangible assets with indefinite useful lives acquired in the course of business combinations are recognized at fair value on the acquisi tion date. Intangible assets with indefinite useful lives are not amortized, however they are tested for impairment when a triggering event arises or at least once a year. Goodwill is allocated to cash-generating units and tested for impairment either annually or if there are indications of impairment. A cash-generating unit is a division as presented in the Segment Reporting. The carrying amounts of the cash-generating units are compared with their recoverable amounts and impairment losses are recognized where the recoverable amount is lower than the carrying amount. The recoverable amount of a cash- genera ting unit is determined as the higher of fair value less costs to sell and value in use estimated using the discounted cash flow method. When testing for potential goodwill impairments, Merck determines the recoverable amount by discounting expected cash flows and therefore uses the value-in-use method. Reference is made to existing forecasts. Among other things, market observations, and – if available – market data, constant target-actual deviations, detailed plans as well as past experience form the basis for cash flow forecasts. Above all, assumptions on existing and future customers, future realizable selling prices and volumes and corresponding costs are made. The existing plans normally cover a period of four years. Cash flows for periods in excess of this are included using an individualized long-term growth rate for the specific cash-generating unit.
145
Accounting policies
Merck 2012Consolidated Financial Statements
In the business plan, a long-term growth rate of 2.8% was used to measure the goodwill of the Merck Millipore division (2011: 2.8%). The long-term growth rates used for the other divisions are as follows: Merck Serono 1.5% (2011: 1.5%), Consumer Health 2.5% (2011: 2.5%) and Performance Materials 1.0% (2011: 1.0%). The use of division-specific long-term growth rates is suited to taking the specific business and the imminent growth prospects thereof into account.
The expected future cash flows were discounted using a weighted average cost of capital (WACC) of 7.0% (2011: 7.0%). A 10% reduction in future cash flows was assumed when calculating sensitivity, furthermore sensitivities were calculated for the case that the weighted average cost of capital increases by 10%. We regarded greater volatility as unlikely based on our experience. Even if the actual future cash flows were 10% lower than the expected cash flows, there would be no need to record impairment losses for goodwill. Likewise, there would be no need to record impairment losses if future cash flows were discounted by a weighted average cost of capital that was 10% higher.
Intangible assets with indefinite useful lives are tested for impairment individually and annually. The carrying amounts are compared with the recoverable amounts. Impairment losses recognized on indefinite-lived intangible assets other than goodwill are reversed if the original reasons for impairment no longer apply.
Intangible assets with a finite useful life are amortized using the straight- line method. The useful lives of acquired patents, licenses and similar rights, brand names, trademarks and software are between 3 and 15 years. Amortization of intangible assets other than software is reported in a separate line item in the income statement. This item primarily comprises amortization in connection with the Serono and Millipore purchase price allocations. Amortization of software is allocated to the functional costs in the income statement. An impairment test is performed if there are indications of impairment. Impairment losses are determined using the same methodology as for indefinite-lived intangible assets. Impairment losses are reversed if the original reasons for impairment no longer apply.
( 17 ) Property, plant and equipmentProperty, plant and equipment is carried at the cost of acquisi tion or manufacture less depreciation and impairments plus reversals of impairments. The component approach is applied here in accordance with IAS 16. Sub sequent acquisition and manufacturing costs are only capitalized if it is probable that future economic benefits will arise for the Group and the cost of the asset can be measured reliably. The cost of manufacture of self-constructed property, plant and equipment is calculated on the basis of the directly attributable unit costs and an appropriate share of overheads. If the construction of property, plant and equipment lasts for an extended period, the directly allocable costs of borrowing incurred up until comple-tion are capitalized as part of the costs of acquisition or manufacture. In accordance with IAS 20, costs of acquisition or manufacture are reduced by the amount of government grants in those cases where government grants or subsidies have been paid for the acquisition or manufacture of assets (investment grants). Grants related to expenses which no longer offset future expenses are recognized in income. Property, plant and equipment is depreciated by the straight-line method over the useful life of the asset concerned. Depreciation of property, plant and equipment is based on the following useful lives:
146
Accounting policies
Merck 2012Consolidated Financial Statements

Useful life of property, plant and equipment
Useful life
Production buildings maximum of 33 yearsAdministration buildings maximum of 40 yearsPlant and machinery 6 to 25 yearsOperating and office equipment; other facilities 3 to 10 years
The useful lives of the assets are reviewed regularly and adjusted if necessary. If indications of a decline in value exist, an impairment test is performed. The determination of the possible need to recognize impairments proceeds in the same way as for intangible assets. If the reasons for an impairment loss no longer exist, a write-up is recorded.
( 18 ) LeasingWhere non-current assets are leased and economic ownership lies with Merck (finance lease), the asset is recognized at the present value of the lease payments or the lower fair value in accordance with IAS 17 and depreciated over its useful life. The corresponding payment obligations from future lease payments are recorded as liabilities. If an operating lease is concerned, the associated expenses are recognized in the period in which they are incurred.
( 19 ) Deferred taxesDeferred tax assets and liabilities result from temporary differences between the carrying amount of an asset or liability in the IFRS and tax balance sheets of consolidated companies as well as from consolidation activities, as far as the carrying amount of the asset or liability is recovered or settled in future periods. In addition, deferred tax assets are recorded in particular for tax loss carryforwards if and insofar as their utilization is probable in the foreseeable future. In accordance with the liability method, the tax rates enacted and published as of the balance sheet date are used.
Deferred tax assets and liabilities are only offset on the balance sheet data if they meet the require-ments of IAS 12.
147
Accounting policies
Merck 2012Consolidated Financial Statements

( 20 ) ProvisionsProvisions are recognized in the balance sheet if it is more likely than not that a cash outflow will be required to settle the obligation and the amount of the obligation can be measured reliably. The carrying amount of provisions takes into account the amounts required to cover future payment obligations, recognizable risks and uncertain obligations of the Merck Group to third parties. Measurement is based on the settlement amount with the highest probability or if the probabilities are equivalent and a high number of similar cases exist, it is based on the expected value of the settlement amounts. Long-term provisions are discounted and carried at their present value as of the balance sheet date. To the extent that reimbursement claims exist as defined in IAS 37, they are recognized separately as an asset as soon as their realization is virtually certain and the asset recognition criteria has been met.
( 21 ) Provisions for pensions and other post-employment benefitsProvisions for pensions and other post-employment benefits are recorded in the balance sheet in accordance with IAS 19. The obligations of our companies under defined benefit plans are measured using the projected unit credit method. Under the projected unit credit method, dynamic parameters are taken into account in calculating the expected benefit payments after an insured event occurs; these payments are spread over the entire period of service of the participating employees. Annual actuarial opinions are prepared for this purpose. The actuarial parameters for discount rates, salary and pension trends, staff turnover as well as health care cost increases, which were used to calculate the benefit obligation, were determined on a country-by-country basis in line with the economic conditions prevailing in each country. The respective discount rates are generally determined on the basis of the returns on high-quality corporate bonds issued with adequate maturities and currencies. For euro-denominated obligations, bonds with ratings of at least “AA” from one of the three major rating agencies (Standard & Poor’s, Moody’s or Fitch), and a euro swap rate of adequate duration served as the basis for the data. Against the background of financial market developments, the “iBoxx Euro Non-Sovereigns 10+” portfolio used in the previous year with a minimum rating of “AA” only encompassed eight bonds and therefore no longer offered sufficient market depth. If the obligations had been measured on the balance sheet date using the method applied in the previous year, pension obligations would have been € 184.5 million higher. Interest expenses for 2013 would be € 0.2 million higher without a change in method. Actuarial gains and losses resulting from changes in actuarial assumptions and/or experience adjustments (the effects of differences between the previous actuarial assumptions and what has actually occurred) are recognized immediately in equity as soon as they are incurred, taking deferred taxes into account. Consequently, the balance sheet discloses – after deduction of the plan assets – the full scope of the obligations while avoiding the fluctuations in expenses that can result especially when the calculation parameters change. The actuarial gains and losses recorded in the respective reporting period are presented separately in the Statement of Comprehensive Income.
148
Accounting policies
Merck 2012Consolidated Financial Statements

Notes to the consolidated income statement
( 22 ) SalesSales were generated primarily from the sale of goods and to a limited degree also included revenues from services rendered. Merck Group sales totaled € 10,740.8 million in 2012 (2011: € 9,905.9 million), which represented an increase of 8.4% compared to 2011. Adjusted for the impact of foreign exchange rates and acquisitions, organic growth amounted to 4.5%. Sales are presented by division and region in the Segment Reporting (see Note [53]).
( 23 ) Royalty, license and commission incomeIn 2012, royalty and license income totaled € 417.2 million (2011: € 354.2 million) and mainly included royalty and license income from the products Humira ® (AbbVie Inc., formerly Abbott), Avonex ® (Biogen Idec Inc.), Enbrel ® (Amgen Inc.), Puregon ® (Merck & Co. Inc.) and Viibryd ® (Forest Laboratories Inc.), as well as income from the active pharmaceutical ingredients bisoprolol and metformin.
In 2012, commission income totaled € 14.9 million (2011: € 16.3 million). This primarily consisted of cooperation and distribution agreements. The breakdown of royalty, license and commission income by division is presented in the Segment Reporting (see Note [53]).
( 24 ) Cost of salesCost of sales primarily included the cost of manufactured products as well as goods purchased for resale. In accordance with IAS 2, the cost comprises overheads and, if necessary, inventory write-downs, in addition to directly attributable costs, such as the cost of mate rials, personnel and energy.
( 25 ) Marketing and selling expensesIn addition to the cost of sales and marketing departments and of the sales force, marketing and selling expenses included advertising and logistics. The breakdown of marketing and selling expenses by division is presented in the Segment Reporting (see Note [53]).
( 26 ) Royalty, license and commission expensesIn 2012, royalty and license expenses amounted to € 208.1 million (2011: € 204.1 million) and commission expenses totaled € 371.7 million (2011: € 296.4 million). The increase in commission expenses is due mainly to the marketing partnership with Pfizer Inc. for Rebif ® in the United States. The breakdown of royalty, license and commission expenses by division is presented in the Segment Reporting (see Note [53]).
( 27 ) Administration expensesPersonnel costs and material expenses of management and administra tive functions were recorded under this item unless charged to other functional costs as internal services. The breakdown of administration expenses by division is presented in the Segment Reporting (see Note [53]).
149
Notes to the consolidated income statement
Merck 2012Consolidated Financial Statements

( 28 ) Other operating expenses and incomeOther operating expenses and income were as follows:
€ million 2012 2011
Litigation –185.5 –61.1Allowances for receivables –68.3 –123.7Exchange rate differences from operating activities –60.4 –Premiums, fees and contributions –51.4 –49.41
Non-income-related taxes –33.0 –29.2Expense for miscellaneous services –20.2 –17.8Impairment losses –19.7 –20.41
Project costs –8.1 –37.31
Impairment losses on Greek sovereign bonds –2.8 –18.0One-time items –663.7 –64.01
Other operating expenses –132.6 –139.01
Total other operating expenses –1,245.7 –559.91
Release of allowances for receivables 42.4 9.2Income from miscellaneous services 21.0 30.5Gains on disposals of assets 6.0 53.0Exchange rate differences from operating activities – 12.3Other operating income 49.8 37.7Total other operating income 119.2 142.7
Total other operating income and expenses –1,126.5 –417.21
1 Previous year’s figures have been adjusted, see Note [5]
The one-time items included in other operating expenses are explained in more detail under Note [29].Allowances for receivables and the release of allowances for receivables included both trade accounts
receivable as well as other receivables disclosed in the balance sheet under “other current assets” insofar as the expenses were not reported under one-time items.
Other operating expenses included, among other things, special environmental protection costs and non-allocatable personnel expenses. The breakdown of other operating expenses and income by division is presented in the Segment Reporting (see Note [53]).
150
Notes to the consolidated income statement
Merck 2012Consolidated Financial Statements
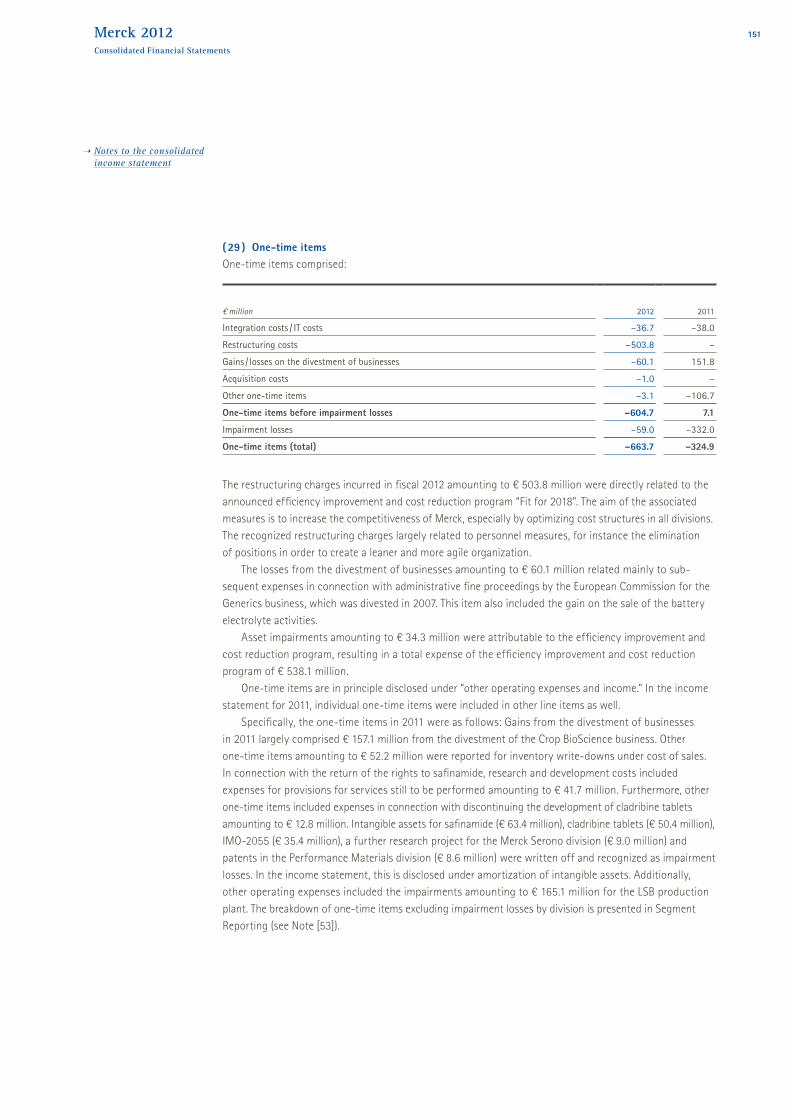
( 29 ) One-time itemsOne-time items comprised:
€ million 2012 2011
Integration costs / IT costs –36.7 –38.0Restructuring costs –503.8 –Gains / losses on the divestment of businesses –60.1 151.8Acquisition costs –1.0 –Other one-time items –3.1 –106.7One-time items before impairment losses –604.7 7.1Impairment losses –59.0 –332.0One-time items (total) –663.7 –324.9
The restructuring charges incurred in fiscal 2012 amounting to € 503.8 million were directly related to the announced efficiency improvement and cost reduction program “Fit for 2018”. The aim of the associated measures is to increase the competitiveness of Merck, especially by optimizing cost structures in all divisions. The recognized restructuring charges largely related to personnel measures, for instance the elimination of positions in order to create a leaner and more agile organization.
The losses from the divestment of businesses amounting to € 60.1 million related mainly to sub-sequent expenses in connection with administrative fine proceedings by the European Commission for the Generics business, which was divested in 2007. This item also included the gain on the sale of the battery electrolyte activities.
Asset impairments amounting to € 34.3 million were attributable to the efficiency improvement and cost reduction program, resulting in a total expense of the efficiency improvement and cost reduction program of € 538.1 million.
One-time items are in principle disclosed under “other operating expenses and income.” In the income statement for 2011, individual one-time items were included in other line items as well.
Specifically, the one-time items in 2011 were as follows: Gains from the divestment of businesses in 2011 largely comprised € 157.1 million from the divestment of the Crop BioScience business. Other one-time items amounting to € 52.2 million were reported for inventory write-downs under cost of sales. In connection with the return of the rights to safinamide, research and development costs included expenses for provisions for services still to be performed amounting to € 41.7 million. Furthermore, other one-time items included expenses in connection with discontinuing the development of cladribine tablets amounting to € 12.8 million. Intangible assets for safinamide (€ 63.4 million), cladribine tablets (€ 50.4 million), IMO-2055 (€ 35.4 million), a further research project for the Merck Serono division (€ 9.0 million) and patents in the Performance Materials division (€ 8.6 million) were written off and recognized as impairment losses. In the income statement, this is disclosed under amortization of intangible assets. Additionally, other operating expenses included the impairments amounting to € 165.1 million for the LSB production plant. The breakdown of one-time items excluding impairment losses by division is presented in Segment Reporting (see Note [53]).
151
Notes to the consolidated income statement
Merck 2012Consolidated Financial Statements

( 30 ) Research and developmentResearch and development costs decreased slightly in 2012 by 0.2% to € 1,511.3 million (2011: € 1,514.0)1 and were thus nearly at the previous year’s level. In particular, a decline in the Merck Serono division, which reported one-time items of € 41.7 million in 2011, was offset by an expansion of research in the biophar-maceutical sector of the Merck Millipore division. Reimbursements for R & D amounting to € 37.2 million (2011: € 22.9 million) were offset against research and development costs. This figure also included government subsidies of € 6.4 million. The breakdown of research and development costs by division is presented in the Segment Reporting (see Note [53]).
( 31 ) Amortization of intangible assetsDue to the particular significance of the amortization of intangible assets to the Merck Group, this item is disclosed separately in the income statement. This item mainly included amortization of intangible assets in connection with the purchase price allocations for Serono and Millipore. Amortization of intangible assets decreased to € 871.6 million in 2012 from € 1,004.7 million in 2011. The decrease was due to the fact that in 2011, this item included impairment losses classified as one-time items amounting to € 166.8 million, whereas in 2012 no impairment losses were included under this item. Amortization of software is allocated to the respective functional costs.
( 32 ) Investment result
€ million 2012 2011
Investment result from associates (equity method) – –1.2Other investment income / expense 0.6 0.2
0.6 –1.0
( 33 ) Financial result
€ million 2012 2011
Interest income and similar income 35.6 57.8Interest expenses and similar expenses –221.9 –227.2Interest component from currency hedging transactions –19.0 –17.0Net interest –205.3 –186.4
Interest component of the additions to pension provisions and other non-current provisions –60.3 –74.91
Exchange rate differences from financing activities 11.2 –30.4Income from financial interests –0.2 –1.6
–254.6 –293.31
1 Previous year’s figures have been adjusted, see Note [5]
152
Notes to the consolidated income statement
Merck 2012Consolidated Financial Statements
( 30 ) Research and developmentResearch and development costs decreased slightly in 2012 by 0.2% to € 1,511.3 million (2011: € 1,514.0)1 and were thus nearly at the previous year’s level. In particular, a decline in the Merck Serono division, which reported one-time items of € 41.7 million in 2011, was offset by an expansion of research in the biophar-maceutical sector of the Merck Millipore division. Reimbursements for R & D amounting to € 37.2 million (2011: € 22.9 million) were offset against research and development costs. This figure also included government subsidies of € 6.4 million. The breakdown of research and development costs by division is presented in the Segment Reporting (see Note [53]).
( 31 ) Amortization of intangible assetsDue to the particular significance of the amortization of intangible assets to the Merck Group, this item is disclosed separately in the income statement. This item mainly included amortization of intangible assets in connection with the purchase price allocations for Serono and Millipore. Amortization of intangible assets decreased to € 871.6 million in 2012 from € 1,004.7 million in 2011. The decrease was due to the fact that in 2011, this item included impairment losses classified as one-time items amounting to € 166.8 million, whereas in 2012 no impairment losses were included under this item. Amortization of software is allocated to the respective functional costs.
( 32 ) Investment result
€ million 2012 2011
Investment result from associates (equity method) – –1.2Other investment income / expense 0.6 0.2
0.6 –1.0
( 33 ) Financial result
€ million 2012 2011
Interest income and similar income 35.6 57.8Interest expenses and similar expenses –221.9 –227.2Interest component from currency hedging transactions –19.0 –17.0Net interest –205.3 –186.4
Interest component of the additions to pension provisions and other non-current provisions –60.3 –74.91
Exchange rate differences from financing activities 11.2 –30.4Income from financial interests –0.2 –1.6
–254.6 –293.31
1 Previous year’s figures have been adjusted, see Note [5]
Net interest amounting to € –205.3 million (2011: € –186.4 million) worsened in comparison with 2011 owing to lower interest income from cash investments due to the general decline in interest rates. In addition, one-time effects were incurred in 2011. Despite a negative effect from the dedesignation of a € 250.0 million interest rate swap, interest expenses declined as a result of the repayment of two bonds, each with a nominal volume of € 500.0 million, in March and December 2012.
The interest portion of the additions to pension provisions and other non-current provisions decreased due to transfers of plan assets to a Contractual Trust Arrangement in the fourth quarter of 2011 and in the fourth quarter of 2012.
( 34 ) Income tax
€ million 2012 2011
Current taxes in the period –451.2 –422.0Taxes for previous periods –4.5 11.5Deferred taxes in the period 325.7 189.71
–130.0 –220.81
1 Previous year’s figures have been adjusted, see Note [5]
The following table presents the tax reconciliation from theoretical tax expense to tax expense according to the income statement. The theoretical tax expense is determined by applying the statutory tax rate of 30.7% of a corporation headquartered in Darmstadt.
€ million 2012 2011
Profit before income tax 709.0 838.81
Tax rate 30.7% 30.7%Theoretical tax expense –217.7 –257.51
Tax rate differences 67.6 –11.61
Tax effect of companies with a negative contribution to consolidated profit –1.9 –3.2Tax for other periods –4.5 11.5Tax credits 71.3 38.2Tax effect on tax loss carryforwards 0.1 25.7Effect of non-deductible expenses / tax-free income / other tax effects –44.9 –23.91
Tax expense according to income statement –130.0 –220.81
Tax ratio according to income statement 18.3% 26.3%1
1 Previous year’s figures have been adjusted, see Note [5]
153
Notes to the consolidated income statement
Merck 2012Consolidated Financial Statements

The tax expense consisted of corporation and trade income taxes for the companies domiciled in Germany as well as comparable income taxes for foreign companies.
In 2012, one-time deferred tax income of € 2.4 million was recognized owing to changes in tax rates in individual companies (2011: € 19.2 million).
The reconciliation between deferred taxes in the balance sheet and deferred taxes in the income state-ment is presented in the following table:
€ million 2012 2011
Change in deferred tax assets (balance sheet) 216.6 137.81
Change in deferred tax liabilities (balance sheet) 127.6 60.9Deferred taxes credited / debited to equity –20.3 –12.91
Changes in scope of consolidation / currency translation / Other changes 1.8 3.9Deferred taxes (income statement) 325.7 189.71
1 Previous year’s figures have been adjusted, see Note [5]
Tax loss carryforwards were structured as follows:
Dec. 31, 2012 Dec. 31, 2011
€ million Germany Abroad Total Germany Abroad Total
Tax loss carryforwards 281.9 285.2 567.1 1.8 188.1 189.9
thereof:Including deferred tax asset 278.3 146.3 424.6 – 100.9 100.9Deferred tax asset 41.3 33.0 74.3 – 35.1 35.1
thereof:Excluding deferred tax asset 3.6 138.9 142.5 1.8 87.2 89.0Theoretical deferred tax asset 1.0 21.1 22.1 0.3 28.2 28.5
The increase in tax loss carryforwards compared to 2011 was mainly the result of the release of tax reserves in the tax balance sheet of Merck KGaA as well as the recognition of state taxes for the United States. Deferred tax assets are recognized for tax loss and interest carryforwards only if for tax loss carryforwards of less than € 5.0 million, realiza tion of the related tax benefits is probable within one year, and for tax loss carryforwards of more than € 5.0 million realization of the related tax benefits is probable within the next three years.
The vast majority of the tax loss carryforwards either has no expiry date or can be carried forward for up to 20 years.
The tax loss carryforwards accumulated in Germany for corporation and trade tax amounted to € 281.9 million (2011: € 1.8 million).
The additional theoretically possible deferred tax assets amounted to € 22.1 million (2011: € 28.5 million).In 2012, the income tax expense was reduced by € 0.1 million (2011: € 25.7 million) due to the
utilization of tax loss carryforwards from prior years for which no deferred tax asset had been recognized in prior periods.
154
Notes to the consolidated income statement
Merck 2012Consolidated Financial Statements

Deferred tax assets and liabilities corresponded to the following balance sheet items:
Dec. 31, 2012 Dec. 31, 2011
€ million Assets Liabilities Assets Liabilities
Intangible assets 46.4 1,162.7 71.3 1.293.5Property, plant and equipment 5.2 67.0 5.9 94.7Current and non-current financial assets 0.9 4.1 14.9 21.1Inventories 438.7 4.7 384.4 3.5Current and non-current receivables / Other assets 41.8 12.6 32.4 20.7Provisions for pensions and other post-employment benefits 153.6 47.3 131.31 14.2Current and non-current other provisions 316.2 60.1 192.51 14.2Current and non-current liabilities 53.1 4.6 74.1 6.0Tax loss carryforwards 74.3 – 35.1 –Tax refund claims / Other 43.7 56.2 29.2 92.8Offset deferred tax assets and liabilities –227.3 –227.3 –241.1 –241.1Deferred taxes (balance sheet) 946.6 1,192.0 730.0 1.319.6 1 Previous year’s figures have been adjusted, see Note [5]
In addition to deferred tax assets on tax loss carryforwards amounting to € 74.3 million (2011: € 35.1 mil-lion), deferred tax assets of € 872.3 million (2011: € 694.9 million) were recognized for other temporary differences.
As of the balance sheet date, deferred tax liabilities for temporary differences for interests in subsidiaries as regards planned dividend payments amounted to € 52.7 million (2011: € 100.2 million). Of this amount, € 43.6 million (2011: € 83.5 million) was recognized within the scope of the Millipore acquisition. No deferred tax liabilities were recognized for other temporary differences relating to interests in subsidiaries since the reversal of these differences was not foreseeable. Temporary differences relating to the retained earnings of subsidiaries amounted to € 3,533.0 million (2011: € 3,508.8 million).
( 35 ) Non-controlling interestNon-controlling interest in net profit was primarily composed of the minority interests in the listed companies Merck Ltd., India, and P.T. Merck Tbk., Indonesia, as well as in Merck Ltd., Thailand, and Merck (Pvt.) Ltd., Pakistan.
( 36 ) Earnings per shareBasic earnings per share are calculated by dividing the profit after tax attributable to the shareholders of Merck KGaA by the weighted average number of theoretical shares outstanding. The use of a theo retical number of shares takes into account the fact that the general partner’s capital is not represented by shares. The share capital of € 168.0 million was divided into 64,621,126 shares. Accordingly, the general partner’s capital of € 397.2 million was divided into 152,767,813 theoretical shares. Overall, the total capital thus amounted to € 565.2 million or 217,388,939 theoretical shares outstanding. The weighted average number of shares was likewise 217,388,939 in 2012.
As of December 31, 2012 there were no potentially dilutive shares.
155
Notes to the consolidated income statement
Merck 2012Consolidated Financial Statements

Notes to the consolidated balance sheet
( 37 ) Cash and cash equivalentsThis item comprised:
€ million Dec. 31, 2012 Dec. 31, 2011
Cash, bank balances and cheques 349.1 187.7Short-term cash investments 380.6 750.1
729.7 937.8
Changes in cash and cash equivalents as defined by IAS 7 are presented in the cash flow statement. This item included short-term receivables due from affiliates amounting to € 6.9 million (2011: € 8.2 million).
Short-term cash investments declined mainly owing to the reclassification to current financial assets.
( 38 ) Current financial assetsThis item comprised the following categories:
€ million Dec. 31, 2012 Dec. 31, 2011
Financial investments held to maturity 349.7 27.3Available-for-sale financial investments 1,230.1 307.9Loans and receivables 200.0 760.0Derivative assets (financial transactions) 18.1 21.9
1,797.9 1,117.1
The increase in current financial assets resulted mainly from “available-for-sale financial investments“, which rose to € 1,230.1 million (2011: € 307.9 million) owing to the reclassification of short-term monetary deposits to current financial assets. As of December 31, 2012, this item mainly included commercial paper amounting to € 283.7 million (2011: € 247.3 million) as well as bonds amounting to € 616.5 million (2011: € 0.0 million). All Greek sovereign bonds, which were included under “available for sales financial investments” with a book value of € 10.9 million, were sold in 2012. Following the debt cut in the first quarter of 2012, the nominal value of these securities was € 20.1 million (2011: € 43.2 million before the debt cut). We received these securities in 2011 within the scope of an exchange of receivables from Greek hospitals. On the date of their sale, the purchase price of € 8.1 million largely corresponded to the net book value of the bonds. The impairments recognized in 2012 prior to the sale amounted to € 2.8 million and were reported under “other operating expenses”.
Moreover, fair value adjustments of € +0.8 million which were recognized immediately in equity, were made on “available-for-sale financial investments“ (2011: € +1.3 million).
156
Notes to the consolidated balance sheet
Merck 2012Consolidated Financial Statements

( 39 ) Trade accounts receivableTrade accounts receivable amounting to € 2,114.6 million (2011: € 2,328.3 million) only existed vis-à-vis third parties:
Trade accounts receivable past due were as follows:
€ million Dec. 31, 2012 Dec. 31, 2011
Neither past due nor impaired 1,556.9 1,676.0Past due, but not impaired
up to 3 months 210.5 196.5up to 6 months 24.7 29.2up to 12 months 13.3 17.7up to 24 months 6.6 7.6over 2 year 3.6 2.8
Impaired 299.0 398.5Book value 2,114.6 2,328.3
The corresponding allowances developed as follows:
€ million 2012 2011
January 1 –149.0 –58.9Additions –68.3 –123.0Reversals 42.4 9.2Utilizations 20.6 23.6Currency translation and other changes –0.5 0.1December 31 –154.8 –149.0
Due to the large number of products we offer, trade accounts receivable exist vis-à-vis a large number of customers. This diversification helps to reduce risk with respect to potential defaults on receivables. In addition, established credit management processes that take individual customer risks into account are used to assess the recoverability of receivables. If there are indications that individual trade accounts receivable are partly or fully impaired, corresponding allowances are recognized. Additions to allowances relate mainly to receivables from state hospitals and health care organizations in Italy, Spain, Greece and Portugal.
In the period from January 1 to December 31, 2012 trade receivables in Italy and Spain with a nominal value of € 256.9 million were sold for € 246.5 million. Previous write-downs in this context amounting to € 10.4 million were reversed and disclosed under other operating income. The sold receivables do not involve any further rights of recovery vis-à-vis Merck.
157
Notes to the consolidated balance sheet
Merck 2012Consolidated Financial Statements

( 40 ) InventoriesThis item comprised:
€ million Dec. 31, 2012 Dec. 31, 2011
Raw materials and production supplies 308.1 288.9Work in progress, finished goods and goods purchased for resale 1,225.8 1,402.2
1,533.9 1,691.1
Write-downs of inventories amounted to € 126.1 million (2011: € 116.0 million). As of the balance sheet date, the residual book value of inventories that were written down amounted to € 931.4 million (2011: € 894.8 million). In 2012, inventory write-ups of € 36.3 million were recorded (2011: € 0.7 million). As of the balance sheet date, no inventories were used to secure liabilities.
( 41 ) Other assetsOther assets comprised the following:
€ million current non-current Dec. 31, 2012 current non-current Dec. 31, 2011
Other receivables 86.5 2.3 88.8 88.1 2.5 90.6Derivative assets (operational) 23.3 32.0 55.3 2.6 – 2.6Financial items 109.8 34.3 144.1 90.7 2.5 93.2Receivables from non-income related taxes 94.0 31.4 125.4 85.0 40.7 125.7Prepaid expenses 34.3 2.2 36.5 37.1 3.6 40.7Assets from defined benefit plans 15.2 – 15.2 19.11 – 19.11
Other assets 18.2 7.5 25.7 20.1 8.1 28.2Non-financial items 161.7 41.1 202.8 161.3 52.4 213.7
271.5 75.4 346.9 252.01 54.9 306.91
1 Previous year’s figures have been adjusted, see Note [5]
Other receivables included current receivables from related parties amounting to € 5.4 million (2011: € 6.2 million) as well as current receivables from affiliates amounting to € 0.3 million (2011: € 0.4 million).
158
Notes to the consolidated balance sheet
Merck 2012Consolidated Financial Statements

Other receivables from third parties past due were as follows:
€ million Dec. 31, 2012 Dec. 31, 2011
Neither past due nor impaired 76.3 69.0Past due, but not impaired
up to 3 months 4.7 4.7up to 6 months 0.9 5.6up to 12 months 0.3 0.4up to 24 months 0.8 4.3over 2 years 0.1 –
Impaired – –Book value 83.1 84.0
In the year under review, allowances for other receivables from third parties amounting to € 1.6 million (2011: € 0.7 million) were necessary. These were reported under one-time items in 2012. The correspond ing amount for 2011 was reported under allowances for receivables. There were no reversals of allowances in 2012 or in 2011. With regard to other receivables that were neither impaired nor delayed, as of the reporting date there were no indications that the debtors would not meet their payment obligations.
( 42 ) Tax receivablesTax receivables amounted to € 178.5 million (2011: € 72.7 million) and resulted from tax prepayments that exceeded the actual amount of tax pay able for 2012 and prior fiscal years, and from refund claims for prior years as well as withholding tax credits.
159
Notes to the consolidated balance sheet
Merck 2012Consolidated Financial Statements

( 43 ) Intangible assets
Patents, licensesand similar rights,brands, trademarks
and other Goodwill SoftwareAdvance
payments Total
€ million Finite useful
lifeIndefiniteuseful life
Acquisition and manufacturing cost January 1, 2011 10,897.7 491.6 4,622.3 276.8 41.9 16,330.3Currency translation 60.6 –0.3 45.1 1.9 –0.1 107.2Changes in scope of consolidation 79.1 – 91.4 0.1 – 170.6Additions 8.1 31.2 – 11.8 28.6 79.7Disposals –0.3 –0.3 – –6.5 –0.4 –7.5Transfers 11.9 –9.0 – 48.1 –44.0 7.0Reclassification to assets held for sale – – – – – –December 31, 2011 11,057.1 513.2 4,758.8 332.2 26.0 16,687.3
Accumulated amortization and impairment lossesJanuary 1, 2011 –3,330.3 –313.6 –42.2 –160.1 – –3,846.2Currency translation –16.7 –0.1 –0.2 –1.4 – –18.4Changes in scope of consolidation – – – – – –Amortization –839.1 – – –50.8 – –889.9Impairment losses –59.0 –111.4 – –0.7 – –171.1Disposals 0.3 0.3 – 6.0 – 6.6Transfers –0.2 –0.5 – –3.3 – –4.0Write-ups – – – – – –Reclassification to assets held for sale – – – – – –December 31, 2011 –4,245.0 –425.3 –42.4 –210.3 – –4,923.0
Net carrying amount as of December 31, 2011 6,812.1 87.9 4,716.4 121.9 26.0 11,764.3
Acquisition and manufacturing cost January 1, 2012 11,057.1 513.2 4,758.8 332.2 26.0 16,687.3Currency translation –31.0 –0.1 –28.6 –3.8 – –63.5Changes in scope of consolidation 6.1 – 8.0 – – 14.1Additions 42.8 81.0 – 5.4 32.0 161.2Disposals –1.9 – –42.5 –82.3 –0.9 –127.6Transfers –2.2 – – 36.6 –21.7 12.7Reclassification to assets held for sale – – – – – –December 31, 2012 11,070.9 594.1 4,695.7 288.1 35.4 16,684.2
Accumulated amortization and impairment lossesJanuary 1, 2012 –4,245.0 –425.3 –42.4 –210.3 – –4,923.0Currency translation 9.8 0.1 –0.1 3.3 – 13.1Changes in scope of consolidation – – – – – –Amortization –871.6 – – –51.3 – –922.9Impairment losses –8.5 –12.3 – –8.7 – –29.5Disposals 1.8 – 42.5 78.3 – 122.6Transfers 0.4 – – –0.4 – –Write-ups – – – – – –Reclassification to assets held for sale – – – – – –December 31, 2012 –5,113.1 –437.5 – –189.1 – –5,739.7
Net carrying amount as of December 31, 2012 5,957.8 156.6 4,695.7 99.0 35.4 10,944.5
160
Notes to the consolidated balance sheet
Merck 2012Consolidated Financial Statements

The changes in scope of consolidation included additions amounting to € 14.1 million (2011: € 170.6 million). These additions related to the acquisitions of CellASIC Corp. and Biochrom AG. Details of these transactions are presented under Note [4].
The net carrying amount of “Patents, licenses and similar rights, brands, trademarks and other” with finite useful lives amounting to € 5,957.8 million (2011: € 6,812.1 million) mainly included the identified and capitalized assets from the Millipore and Serono purchase price allocations. The vast majority was attributable to technologies and know-how. The remaining useful lives of these assets ranged between 6.0 and 15.0 years. This item also included licenses from these acquisitions with remaining useful lives of between 0.5 and 5.0 years. In response to the increasing market impact of oral therapies for multiple sclerosis, the amortization period of Rebif ® was shortened by two years in 2011, starting on April 1. In fiscal 2012, this change increased amortization by a total of € 68.4 million (2011: € 51.3 million).
In fiscal 2012, impairment losses on intangible assets with finite useful lives totaled € 8.5 million (2011: € 59.0 million). Of this amount, € 3.1 million was attributable to the Futuran ® and Ketesse ® licenses in the Merck Serono division and € 4.0 million to the Fitoladius brand of the Consumer Health division. These impairments were recorded in the income statement as one-time items under “other operating expenses”. Moreover, € 1.4 million was attributable to the Pinion license agreement in the Performance Materials division and was recorded in the income statement as an impairment loss under “other operating expenses”.
The changes in goodwill caused by foreign exchange rates resulted almost exclusively from translating the goodwill for Millipore, part of which is carried in U.S. dollars, into the reporting currency. Since goodwill and intangible assets with indefinite useful lives are not amortized, these are subjected to an annual impairment test. As in 2011, goodwill was not impaired in 2012. Impairment losses on intangible assets with indefinite useful lives totaled € 12.3 million in 2012 (2011: € 111.4 million). Of this amount, € 12.0 million was accounted for by the Merck Serono division, with € 7.4 million attributable to the Ambrx ARX 424 project, € 1.3 million to the Bionomics Kv 1.3 blocker license agreement, € 1.6 million to the license agreement with Domain Therapeutics SA, and € 1.7 million to the Affectis project P2X7 inhibitor. These amounts were recorded in the income statement as one-time items under “other operating expenses.” Moreover, impairment losses of € 0.3 million were incurred in the Performance Materials division in connection with OLED patents. These were recorded in the income statement as impairment losses under “other operating expenses.” In 2011, impairment losses of € 111.4 million on intangible assets with indefinite useful lives were incurred and recorded in the income statement under “amortization of intangible assets.”
161
Notes to the consolidated balance sheet
Merck 2012Consolidated Financial Statements

The book values of “Patents, licenses and similar rights, brands, trademarks and other” as well as goodwill were attributable to the divisions as follows:
€ million
Remaininguseful life
in years Merck SeronoConsumer
HealthPerformance
MaterialsMerck
MilliporeTotal
Dec. 31, 2012Total
Dec. 31, 2011
Patents, licenses and similar rights, brands, trademarks and otherFinite useful life 3,813.0 13.3 38.1 2,093.4 5,957.8 6,812.1
Rebif ® 7.0 2,577.0 – – – 2,577.0 2,944.9Gonal-f ® 6.0 569.7 – – – 569.7 664.6Saizen ® 7.0 215.1 – – – 215.1 245.9Humira ® 5.0 184.8 – – – 184.8 223.7Avonex ® 0.5 23.8 – – – 23.8 72.2Enbrel ® – – – – – – 38.0Puregon ® 2.0 22.9 – – – 22.9 34.4Other technologies 1.4–15.0 218.5 0.2 36.0 487.5 742.2 789.2Brands 1.6–11.5 – 13.1 0.6 281.3 295.0 333.4Customer relationships 1.0–14.5 1.2 – 1.5 1,324.6 1,327.3 1,465.8
Indefinite useful life – 150.3 – 6.3 – 156.6 87.9
Goodwill – 1,681.2 164.6 23.8 2,826.1 4,695.7 4,716.4
Intangible assets with an indefinite useful life primarily related to rights that Merck had acquired for products or technologies that were still in the research and development stage. Amortization will only begin once product marketing begins.
In fiscal 2012, software amortization expenses of € 8.7 million (2011: € 0.7 million) were recognized and recorded as one-time items under “other operating expenses”. Of this amount, € 8.2 million was attribut-able to customer relationship management software in the Merck Serono division as well as € 0.4 million to strategic planning software in Corporate and Other.
162
Notes to the consolidated balance sheet
Merck 2012Consolidated Financial Statements

( 44 ) Property, plant and equipment
€ million
Land, land rights
and buildings, including
buildings on third-party
landPlant and
machinery
Other facili-ties, operating
and office equipment
Construction in progress
and advance payments to vendors and contractors Total
Acquisition and manufacturing cost January 1, 2011 2,321.9 2,663.9 845.4 778.9 6,610.1Currency translation 27.3 3.7 3.4 –0.6 33.8Changes in scope of consolidation 0.6 5.1 2.5 1.1 9.3Additions 32.7 34.3 42.9 262.0 371.9Disposals –23.6 –41.2 –27.7 –1.8 –94.3Transfers 117.1 159.4 48.7 –310.6 14.6Reclassification to assets held for sale – – – – –December 31, 2011 2,476.0 2,825.2 915.2 729.0 6,945.4
Accumulated depreciation and impairment losses January 1, 2011 –872.5 –1,885.5 –600.5 –10.1 –3,368.6Currency translation –7.4 2.1 –2.6 – –7.9Changes in scope of consolidation 2.9 – – – 2.9Depreciation –94.0 –175.0 –85.8 – –354.8Impairment losses –2.2 – –0.1 –165.1 –167.4Disposals 14.8 37.0 26.3 0.9 79.0Transfers 3.4 –20.2 –0.7 –0.1 –17.6Write-ups 0.8 1.4 0.2 – 2.4Reclassification to assets held for sale – – – – –December 31, 2011 –954.2 –2,040.2 –663.2 –174.4 –3,832.0
Net carrying amount as of December 31, 2011 1,521.8 785.0 252.0 554.6 3,113.4
Acquisition and manufacturing cost January 1, 2012 2,476.0 2,825.2 915.2 729.0 6,945.4Currency translation –16.1 –16.4 –5.7 –1.4 –39.6Changes in scope of consolidation 2.9 3.3 0.1 – 6.3Additions 8.8 28.3 33.2 260.0 330.3Disposals –42.0 –89.8 –67.1 –0.9 –199.8Transfers 221.9 293.8 31.0 –557.6 –10.9Reclassification to assets held for sale – – – – –December 31, 2012 2,651.5 3,044.4 906.7 429.1 7,031.7
Accumulated depreciation and impairment losses January 1, 2012 –954.2 –2,040.2 –663.2 –174.4 –3,832.0Currency translation 4.0 12.6 4.8 – 21.4Changes in scope of consolidation – – – – –Depreciation –108.7 –199.4 –88.3 – –396.4Impairment losses –16.0 –21.5 –4.1 –2.5 –44.1Disposals 26.5 82.7 64.1 0.1 173.4Transfers –4.6 1.2 1.6 – –1.8Write-ups 1.4 – – – 1.4Reclassification to assets held for sale – – – – –December 31, 2012 –1,051.6 –2,164.6 –685.1 –176.8 –4,078.1
Net carrying amount as of December 31, 2012 1,599.9 879.8 221.6 252.3 2,953.6
163
Notes to the consolidated balance sheet
Merck 2012Consolidated Financial Statements
The changes in scope of consolidation included additions amounting to € 6.3 million (2011: € 17.4 million). The additions are due to the acquisitions of CellASIC Corp. and Biochrom AG. In 2011, changes in scope of consolidation included disposals of € 5.2 million.
Impairment losses totaled € 44.1 million in fiscal 2012 (2011: € 167.4 million). Of this total, € 26.2 million was recorded as one-time items under “other operating expenses”. Of this amount, € 18.6 million was attributable to laboratory equipment and office furnishings in Corsier-sur-Vevey, Switzerland for the Merck Serono division, € 6.7 million to restructuring of the Hull site (United Kingdom) within the Consumer Health division and € 0.9 million to restructuring within Merck Millipore. A further € 17.9 million in impairments on property, plant and equipment was recorded as impairment losses under “other operating expenses”. Of this amount, € 10.3 million was attributable to the Performance Materials division, € 4.3 million to Merck Serono, and € 3.3 million to Merck Millipore.
The total amount of property, plant and equipment used as collateral was immaterial. Total government grants and subsidies in connection with investments in property, plant and equipment during the fiscal year amounted to € 12.3 million (2011: € 14.8 million).
Directly allocable borrowing costs were capitalized; the cumulative amount was immaterial. The weighted average cost of capital used by the Group was 4.1% per annum.
Property, plant and equipment also included assets that were leased. The total value of capitalized leased assets amounted to € 10.1 million (2011: € 16.5 million) and the corresponding obligations amounted to € 9.8 million (2011: € 11.8 million) (see Note [46]).
The book values of assets classified as finance leases were as follows:
€ million Dec. 31, 2012 Dec. 31, 2011
Land and buildings 8.8 14.1Vehicles 0.9 1.2Other property, plant and equipment 0.4 1.2
10.1 16.5
( 45 ) Non-current financial assets
€ million Dec. 31, 2012 Dec. 31, 2011
Investments in available-for-sale affiliates 16.1 12.4Investments in available-for-sale associates and other companies 27.3 22.1Securities – available-for-sale financial investments 5.3 6.8Securities – financial investments held to maturity 30.0 –Loans and other non-current financial assets 18.4 19.0
97.1 60.3
Investments in affiliates, associates and other companies were classified as available for sale. Investments with a book value of € 41.8 million (2011: € 32.6 million) were carried at cost since their market value could not be reliably determined.
In 2012, impairment losses totaling € 5.1 million (2011: € 14.9 million) were recognized. Of this amount, € 5.0 million was recorded in the income statement as one-time items under “other operating expenses”.
164
Notes to the consolidated balance sheet
Merck 2012Consolidated Financial Statements

Moreover, fair value adjustments of € –0.4 million (2011: € 2.5 million) were made on “available-for-sale financial assets“ and recognized in equity.
( 46 ) Financial liabilitiesThis item comprised:
€ million current non-current Dec. 31, 2012 current non-current Dec. 31, 2011
Bonds 749.1 3,145.9 3,895.0 1,004.7 3,893.7 4,898.4Bank loans and overdrafts 48.1 19.9 68.0 106.9 20.3 127.2Liabilities to related parties 233.1 – 233.1 199.2 – 199.2
Loans from third parties and other financial liabilities 21.5 66.6 88.1 17.2 66.0 83.2
Liabilities from derivatives (financial transactions) 37.1 122.4 159.5 63.9 155.6 219.5Finance leases 2.5 7.3 9.8 2.5 9.3 11.8
1,091.4 3,362.1 4,453.5 1,394.4 4,144.9 5,539.3
Bank financing commitments vis-à-vis the Merck Group were as follows:
€ million Bank credit
facilities
Utilization 1 as of
Dec. 31, 2012 Interest Due
Syndicated loan 2007 2,000.0 – variable 2014Bilateral credit facilities with banks 9.4 9.4 fixed 2013Bilateral credit facilities with banks 1.0 1.0 fixed 2014Bilateral credit facilities with banks 0.9 0.9 fixed 2015Bilateral credit facilities with banks 6.3 6.3 fixed 2017Bilateral credit facilities with banks 11.1 11.1 fixed 2018Bilateral credit facilities with banks 0.9 0.9 fixed 2021
Various bank lines 308.6 38.7fixed /
variable < 1 year2,338.2 68.3
1 Booked disagios are not taken into account in the disclosure
165
Notes to the consolidated balance sheet
Merck 2012Consolidated Financial Statements
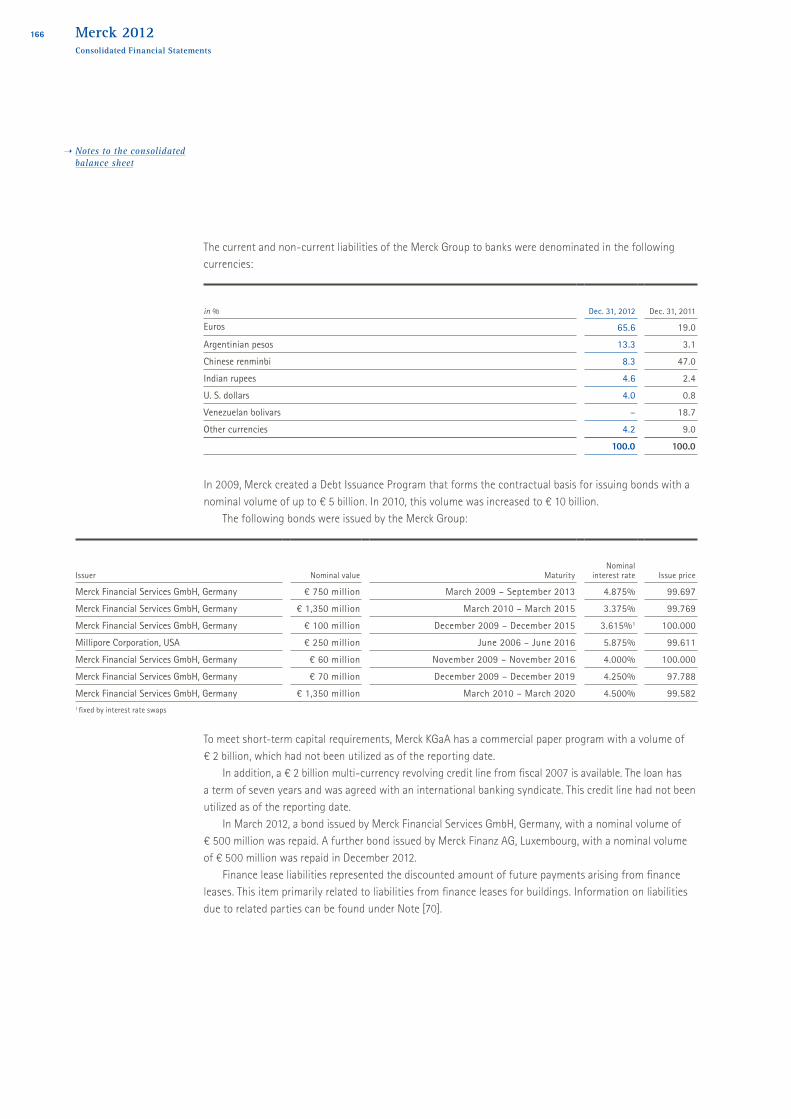
The current and non-current liabilities of the Merck Group to banks were denominated in the following currencies:
in % Dec. 31, 2012 Dec. 31, 2011
Euros 65.6 19.0Argentinian pesos 13.3 3.1Chinese renminbi 8.3 47.0Indian rupees 4.6 2.4U. S. dollars 4.0 0.8Venezuelan bolivars – 18.7Other currencies 4.2 9.0
100.0 100.0
In 2009, Merck created a Debt Issuance Program that forms the contractual basis for issuing bonds with a nominal volume of up to € 5 billion. In 2010, this volume was increased to € 10 billion.
The following bonds were issued by the Merck Group:
Issuer Nominal value MaturityNominal
interest rate Issue price
Merck Financial Services GmbH, Germany € 750 million March 2009 – September 2013 4.875% 99.697Merck Financial Services GmbH, Germany € 1,350 million March 2010 – March 2015 3.375% 99.769Merck Financial Services GmbH, Germany € 100 million December 2009 – December 2015 3.615%1 100.000Millipore Corporation, USA € 250 million June 2006 – June 2016 5.875% 99.611Merck Financial Services GmbH, Germany € 60 million November 2009 – November 2016 4.000% 100.000Merck Financial Services GmbH, Germany € 70 million December 2009 – December 2019 4.250% 97.788Merck Financial Services GmbH, Germany € 1,350 million March 2010 – March 2020 4.500% 99.5821 fixed by interest rate swaps
To meet short-term capital requirements, Merck KGaA has a commercial paper program with a volume of € 2 billion, which had not been utilized as of the reporting date.
In addition, a € 2 billion multi-currency revolving credit line from fiscal 2007 is available. The loan has a term of seven years and was agreed with an international banking syndicate. This credit line had not been utilized as of the reporting date.
In March 2012, a bond issued by Merck Financial Services GmbH, Germany, with a nominal volume of € 500 million was repaid. A further bond issued by Merck Finanz AG, Luxembourg, with a nominal volume of € 500 million was repaid in December 2012.
Finance lease liabilities represented the discounted amount of future payments arising from finance leases. This item primarily related to liabilities from finance leases for buildings. Information on liabilities due to related parties can be found under Note [70].
166
Notes to the consolidated balance sheet
Merck 2012Consolidated Financial Statements

( 47 ) Trade accounts payableTrade accounts payable consisted of the following:
€ million Dec. 31, 2012 Dec. 31, 2011
Liabilities due to third parties 1,288.2 1,100.5Liabilities due to affiliates 0.1 0.3
1,288.3 1,100.8
Trade accounts payable included accrued amounts of € 776.6 million (2011: € 647.2 million) for outstanding invoices and reductions in sales revenues.
( 48 ) Other liabilitiesThis item comprised:
€ million current non-current Dec. 31, 2012 current non-current Dec. 31, 2011
Other financial liabilities 520.1 2.8 522.9 529.1 3.8 532.9
Liabilities from derivatives (operational) 12.2 2.8 15.0 64.5 36.6 101.1Financial items 532.3 5.6 537.9 593.6 40.4 634.0Accruals for personnel expenses 466.2 – 466.2 425.6 – 425.6Deferred income 29.5 2.6 32.1 24.2 1.6 25.8
Advance payments received from customers 10.1 0.1 10.2 9.8 0.1 9.9
Liabilities from non-income related taxes 58.1 1.1 59.2 48.9 1.5 50.4Non-financial items 563.9 3.8 567.7 508.5 3.2 511.7
1,096.2 9.4 1,105.6 1,102.1 43.6 1,145.7
As of December 31, 2012, other financial liabilities included liabilities due to related companies amounting to € 295.4 million (2011: € 319.3 million). These are profit entitlements of E. Merck KG. More over, this item contained liabilities due to affiliates amounting to € 3.6 million (2011: € 0.6 million), interest accruals of € 93.0 million (2011: € 104.2 million) as well as payroll liabilities of € 64.8 million (2011. € 65.5 million). The remaining amount of € 66.1 million (2011: € 43.3 million) recorded under other financial liabilities included employee loans, liabilities due to insurers as well as contractually agreed payment obligations vis-à-vis other companies.
( 49 ) Tax liabilitiesTax liabilities amounted to € 66.3 million (2011: € 80.0 million). Tax liabilities totaling € 401.4 million (2011: € 399.4 million) also include provisions for tax liabilities of € 335.1 million (2011: € 319.4 million).
167
Notes to the consolidated balance sheet
Merck 2012Consolidated Financial Statements
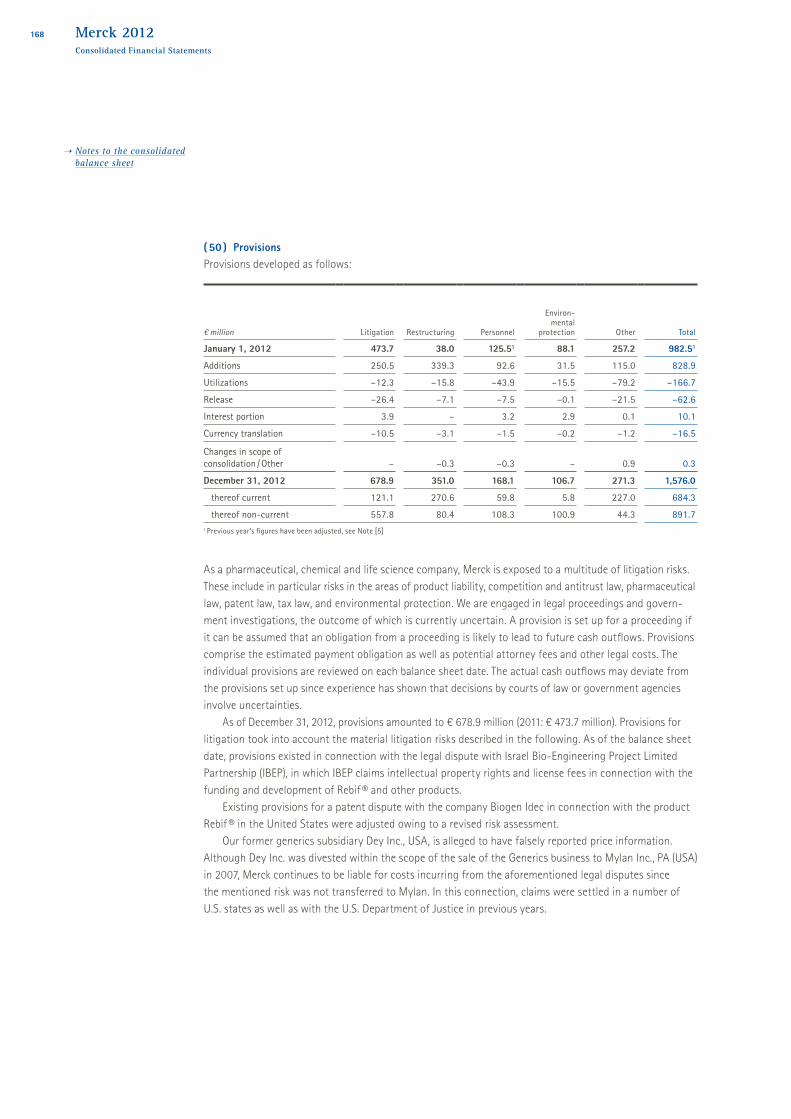
( 50 ) ProvisionsProvisions developed as follows:
€ million Litigation Restructuring Personnel
Environ- mental
protection Other Total
January 1, 2012 473.7 38.0 125.51 88.1 257.2 982.51
Additions 250.5 339.3 92.6 31.5 115.0 828.9Utilizations –12.3 –15.8 –43.9 –15.5 –79.2 –166.7Release –26.4 –7.1 –7.5 –0.1 –21.5 –62.6Interest portion 3.9 – 3.2 2.9 0.1 10.1Currency translation –10.5 –3.1 –1.5 –0.2 –1.2 –16.5
Changes in scope of consolidation / Other – –0.3 –0.3 – 0.9 0.3December 31, 2012 678.9 351.0 168.1 106.7 271.3 1,576.0
thereof current 121.1 270.6 59.8 5.8 227.0 684.3thereof non-current 557.8 80.4 108.3 100.9 44.3 891.7
1 Previous year’s figures have been adjusted, see Note [5]
As a pharmaceutical, chemical and life science company, Merck is exposed to a multitude of litigation risks. These include in particular risks in the areas of product liability, competition and antitrust law, pharmaceutical law, patent law, tax law, and environmental protection. We are engaged in legal proceedings and govern-ment investigations, the outcome of which is currently uncertain. A provision is set up for a proceeding if it can be assumed that an obligation from a proceeding is likely to lead to future cash outflows. Provisions comprise the estimated payment obligation as well as potential attorney fees and other legal costs. The individual provisions are reviewed on each balance sheet date. The actual cash outflows may deviate from the provisions set up since experience has shown that decisions by courts of law or government agencies involve uncertainties.
As of December 31, 2012, provisions amounted to € 678.9 million (2011: € 473.7 million). Provisions for litigation took into account the material litigation risks described in the following. As of the balance sheet date, provisions existed in connection with the legal dispute with Israel Bio-Engineering Project Limited Partnership (IBEP), in which IBEP claims intellectual property rights and license fees in connection with the funding and development of Rebif ® and other products.
Existing provisions for a patent dispute with the company Biogen Idec in connection with the product Rebif ® in the United States were adjusted owing to a revised risk assessment.
Our former generics subsidiary Dey Inc., USA, is alleged to have falsely reported price information. Al though Dey Inc. was divested within the scope of the sale of the Generics business to Mylan Inc., PA (USA) in 2007, Merck continues to be liable for costs incurring from the aforementioned legal disputes since the mentioned risk was not transferred to Mylan. In this connection, claims were settled in a number of U.S. states as well as with the U.S. Department of Justice in previous years.
168
Notes to the consolidated balance sheet
Merck 2012Consolidated Financial Statements

( 50 ) ProvisionsProvisions developed as follows:
€ million Litigation Restructuring Personnel
Environ- mental
protection Other Total
January 1, 2012 473.7 38.0 125.51 88.1 257.2 982.51
Additions 250.5 339.3 92.6 31.5 115.0 828.9Utilizations –12.3 –15.8 –43.9 –15.5 –79.2 –166.7Release –26.4 –7.1 –7.5 –0.1 –21.5 –62.6Interest portion 3.9 – 3.2 2.9 0.1 10.1Currency translation –10.5 –3.1 –1.5 –0.2 –1.2 –16.5
Changes in scope of consolidation / Other – –0.3 –0.3 – 0.9 0.3December 31, 2012 678.9 351.0 168.1 106.7 271.3 1,576.0
thereof current 121.1 270.6 59.8 5.8 227.0 684.3thereof non-current 557.8 80.4 108.3 100.9 44.3 891.7
1 Previous year’s figures have been adjusted, see Note [5]
As a pharmaceutical, chemical and life science company, Merck is exposed to a multitude of litigation risks. These include in particular risks in the areas of product liability, competition and antitrust law, pharmaceutical law, patent law, tax law, and environmental protection. We are engaged in legal proceedings and govern-ment investigations, the outcome of which is currently uncertain. A provision is set up for a proceeding if it can be assumed that an obligation from a proceeding is likely to lead to future cash outflows. Provisions comprise the estimated payment obligation as well as potential attorney fees and other legal costs. The individual provisions are reviewed on each balance sheet date. The actual cash outflows may deviate from the provisions set up since experience has shown that decisions by courts of law or government agencies involve uncertainties.
As of December 31, 2012, provisions amounted to € 678.9 million (2011: € 473.7 million). Provisions for litigation took into account the material litigation risks described in the following. As of the balance sheet date, provisions existed in connection with the legal dispute with Israel Bio-Engineering Project Limited Partnership (IBEP), in which IBEP claims intellectual property rights and license fees in connection with the funding and development of Rebif ® and other products.
Existing provisions for a patent dispute with the company Biogen Idec in connection with the product Rebif ® in the United States were adjusted owing to a revised risk assessment.
Our former generics subsidiary Dey Inc., USA, is alleged to have falsely reported price information. Al though Dey Inc. was divested within the scope of the sale of the Generics business to Mylan Inc., PA (USA) in 2007, Merck continues to be liable for costs incurring from the aforementioned legal disputes since the mentioned risk was not transferred to Mylan. In this connection, claims were settled in a number of U.S. states as well as with the U.S. Department of Justice in previous years.
In connection with the divested Generics business, the European Commission opened administrative fine proceedings against Merck. It is alleged that Merck engaged in anticompetitive behavior in connection with the market launch of the product citalopram. A corresponding provision was set up.
As of the balance sheet date, provisions also existed for litigation with the federal state of São Paulo, Brazil. The federal state of São Paulo is demanding compensation from the Brazilian company Merck S.A., Brazil, in connection with the marketing of the product Raptiva ®. Merck withdrew Raptiva ® from the market globally in early 2009.
For various smaller pending legal disputes against companies of the Merck Group, provisions that are considered appropriate have been set up.
Provisions for restructuring mainly include provisions for severance payments for employees in connection with restructuring projects and provisions for onerous contracts. These were recognized once detailed restructuring plans had been prepared and communicated.
In 2012, provisions related to the “Fit for 2018” efficiency improvement and cost reduction program were set up. The aim of this program is to secure the competitiveness and the growth of the Merck Group over the long term. The provisions recognized in this connection mainly included future commitments to employees such as severance payments and € 14.7 million from partial retirement arrangements. In addition, commitments from the closure of sites were included here.
Provisions for employee benefits include obligations from long-term variable compensation programs. In 2012, the previous variable compensation program (Merck Long-Term Incentive Plan – LTIP) was replaced by a new long-term variable compensation plan aligned not only with target achievement based on key performance indicators, but above all with a sustainable performance of Merck shares. With the new Merck Long-Term-Incentive-Plan, certain executives and employees could be eligible to receive a certain number of virtual shares – Merck Share Units (MSUs) – at the end of a three-year performance cycle. The number of MSUs that could be received depends on the total value defined for the respective person and the average closing price of Merck shares in Xetra trading during the last 60 trading days prior to January 1 of the respective fiscal year (reference price). In order for members of top management to receive payment, they must personally own an investment in Merck shares dependent on their respective fixed annual compensa-tion. When the three-year performance cycle ends, the number of MSUs to then be granted is determined based on the development of two key performance indicators (KPIs). These are on the one hand the performance of the Merck share price compared to the performance of the DAX ® with a weighting of 70% and on the other hand the development of the EBITDA pre margin, during the performance cycle as a proportion of a defined target value with a weighting of 30%.
Depending on the development of the KPIs, at the end of the respective performance cycle the eligible participants are granted between 0% and 150% of the MSUs they could be eligible to receive. Based on the MSUs granted, the eligible participants receive a cash payment at a specified point in time in the year after the three-year performance cycle has ended.
The value of a granted MSU, which is relevant for payment, corresponds to the average closing price of Merck shares in Xetra trading during the last 60 trading days prior to January 1 after the performance cycle. The payment amount is limited to three times the reference price.
169
Notes to the consolidated balance sheet
Merck 2012Consolidated Financial Statements
Notes to the consolidated balance sheet
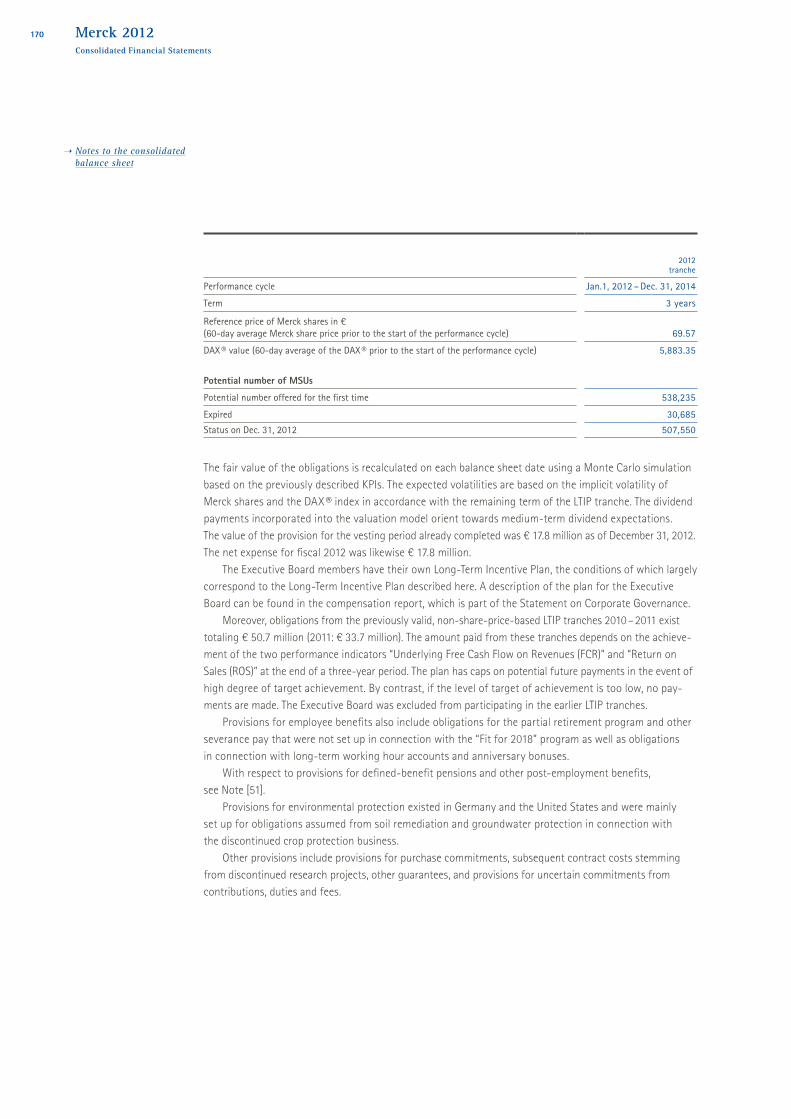
2012 tranche
Performance cycle Jan.1, 2012 – Dec. 31, 2014Term 3 years
Reference price of Merck shares in € (60-day average Merck share price prior to the start of the performance cycle) 69.57DAX ® value (60-day average of the DAX ® prior to the start of the performance cycle) 5,883.35
Potential number of MSUsPotential number offered for the first time 538,235Expired 30,685Status on Dec. 31, 2012 507,550
The fair value of the obligations is recalculated on each balance sheet date using a Monte Carlo simulation based on the previously described KPIs. The expected volatilities are based on the implicit volatility of Merck shares and the DAX ® index in accordance with the remaining term of the LTIP tranche. The dividend payments incorporated into the valuation model orient towards medium-term dividend expectations. The value of the provision for the vesting period already completed was € 17.8 million as of December 31, 2012. The net expense for fiscal 2012 was likewise € 17.8 million.
The Executive Board members have their own Long-Term Incentive Plan, the conditions of which largely correspond to the Long-Term Incentive Plan described here. A description of the plan for the Executive Board can be found in the compensation report, which is part of the Statement on Corporate Governance.
Moreover, obligations from the previously valid, non-share-price-based LTIP tranches 2010 – 2011 exist totaling € 50.7 million (2011: € 33.7 million). The amount paid from these tranches depends on the achieve-ment of the two performance indicators “Underlying Free Cash Flow on Revenues (FCR)” and “Return on Sales (ROS)” at the end of a three-year period. The plan has caps on potential future payments in the event of high degree of target achievement. By contrast, if the level of target of achievement is too low, no pay-ments are made. The Executive Board was excluded from participating in the earlier LTIP tranches.
Provisions for employee benefits also include obligations for the partial retirement program and other severance pay that were not set up in connection with the “Fit for 2018” program as well as obligations in connection with long-term working hour accounts and anniversary bonuses.
With respect to provisions for defined-benefit pensions and other post-employment benefits, see Note [51].
Provisions for environmental protection existed in Germany and the United States and were mainly set up for obligations assumed from soil remediation and groundwater protection in connection with the discontinued crop protection business.
Other provisions include provisions for purchase commitments, subsequent contract costs stemming from discontinued research projects, other guarantees, and provisions for uncertain commitments from contributions, duties and fees.
170
Notes to the consolidated balance sheet
Merck 2012Consolidated Financial Statements

( 51 ) Provisions for pensions and other post-employment benefitsDepending on the legal, economic and fiscal circumstances prevailing in each country, different retirement benefit systems are provided for the employees of the Merck Group. Generally these systems are based on the years of service and salaries of the employees. Pension obligations of the Merck Group include both defined benefit and defined contribution plans and comprise both obligations from current pensions and accrued benefits for pensions payable in the future. In the Merck Group, defined benefit plans are funded and unfunded. Provisions also contain other post-employment benefits, such as accrued future health care costs for retirees in the United States.
In order to limit the risks of changing capital market conditions and demographic developments, for many years now Merck has been offering only defined contribution plans to newly hired employees.
The value recognized in the balance sheet for “pensions and other post-employment benefits” was derived as follows:
€ million Dec. 31, 2012 Dec. 31, 2011
Present value of all defined benefit obligations 2,830.1 2,489.9
Fair value of the plan assets –1,633.6 –1,370.3Funded status 1,196.5 1,119.6
Other changes – 1.61
Net defined benefit liability recognized in the balance sheet 1,196.5 1,121.21
Assets from defined benefit plans 15.2 19.11
Provisions for pensions and other post-employment benefits 1,211.7 1,140.31
1 Previous year’s figures have been adjusted, see Note [5]
The calculation of the defined benefit obligations as well as the relevant plan assets was based on the following actuarial parameters:
in %
Germany Other countries
2012 2011 2012 2011
Discount rate 3.5 4.5 3.2 3.8Future salary increases 2.5 2.5 2.8 2.8Future pension increases 1.8 1.8 2.7 3.0Staff turnover 1.9 1.9 7.6 7.7Future cost increases for health care benefits – – 7.0 5.0
There are average values weighted by the present value of the respective benefit obligation.
171
Notes to the consolidated balance sheet
Merck 2012Consolidated Financial Statements

The defined benefit obligations of the Merck Group were based on the following types of benefits pro-vided by the respective plan:
Present value of defined benefit obligations in € million
Germany Other countries Merck Group
Dec. 31, 2012 Dec. 31, 2012 Dec. 31, 2012
Benefit based on final salary
Annuity 1,744.7 369.7 2,114.4Lump sum – 70.5 70.5Installments 1.0 – 1.0
Benefit not based on final salaryAnnuity 84.1 495.3 579.4Lump sum 6.6 46.4 53.0
Medical plan – 11.8 11.81,836.4 993.7 2,830.1
The main benefit rules are as follows:Merck KGaA and Merck Pensions GmbH & Co. KG accounted for € 1,681.8 million (2011: € 1,368.8 million) of the defined benefit obligations and € 799.5 million (2011: € 523.8 million) of the plan assets. The benefits comprise old-age, disability and surviving dependent pensions. On the one hand, these obligations are based on benefit rules comprising benefit commitments dependent upon years of service and final salary from which newly hired employees have been excluded. On the other hand, the benefit rules applicable to employees newly hired since January 1, 2005 comprise a direct commitment in the form of a defined contribution obligation. The benefit entitlement results from the cumulative total of annually determined pension components that are calculated on the basis of a defined benefit expense and an age-dependent annuity table. Statutory minimum funding obligations do not exist.
The Merck Serono pension fund in Switzerland accounted for € 393.5 million (2011: € 372.8 million) of the defined benefit obligations and € 378.7 million (2011: € 364.4 million) of the plan assets. These obligations are based on the granting of old-age, disability and surviving dependents benefits, which include the legally required benefits. Both employer and employee contributions are paid into the pension fund. Statutory minimum funding obligations exist.
The Merck Pension Scheme in the United Kingdom accounted for € 303.2 million (2011: € 289.7 million) of the defined benefit obligations and € 284.0 million (2011: € 257.9 million) of the plan assets. These obligations result from a benefit plan which is based on years of service and final salary and was closed to newly hired employees in 2006. The agreed benefits comprise old-age, disability and surviving dependent benefits. The employer and the employees make contributions to the plan. Statutory minimum funding obligations also exist in the United Kingdom.
172
Notes to the consolidated balance sheet
Merck 2012Consolidated Financial Statements

In the reporting period, the following items were recognized in income:
€ million 2012 2011
Current service cost 75.7 81.9Past service cost 19.3 0.3Gains (–) or losses (+) on settlement 0.1 –0.6Other effects recognized in income 0.6 –0.4Interest expense 101,8 100.2Interest income –53.8 –31.61
Total amount recognized in income 143.7 149.81
1 Previous year’s figures have been adjusted, see Note [5]
With the exception of the net balance of interest expense on the defined benefit obligations and interest income from the plan assets, which is recorded under the financial result, the relevant expenses for defined benefit and defined contribution pension systems are allocated to the individual functional areas.
During the reporting period, the present value of the defined pension obligations changed as follows:
€ million
Funded benefit
obligations
Benefit obligations funded by provisions 2012
Funded benefit
obligations
Benefit obligations funded by provisions 2011
Present value of the defined benefit obligations Jan. 1 2,322.8 167.1 2,489.9 888.1 1,467.7 2,355.8Currency translation differences 4.8 –0.1 4.7 25.0 –0.5 24.5Current service cost 64.9 10.8 75.7 72.9 9.0 81.9Past service cost 17.7 1.6 19.3 0.2 0.1 0.3Gains (–) or losses (+) on settlement – 0.1 0.1 –0.2 –0.4 –0.6Interest expense 93.8 8.0 101.8 93.2 7.0 100.2Actuarial gains (–) / losses (+) 334.0 33.1 367.1 14.1 0.7 14.8Contributions by plan participants 13.6 – 13.6 14.1 – 14.1Pension payments –240.4 –7.6 –248.0 –95.7 –6.3 –102.0Changes in the scope of consolidation – – – 4.1 – 4.1Reclassification Merck KGaA due to CTA – – – 1,310.6 –1,310.6 –Other effects recognized in income 0.1 –0.2 –0.1 –0.5 0.1 –0.4Other changes 4.4 1.6 6.0 –3.1 0.3 –2.8
Cash value of all defined benefit obligations on December 31 2,615.7 214.4 2,830.1 2,322.8 167.1 2,489.9
173
Notes to the consolidated balance sheet
Merck 2012Consolidated Financial Statements

In December 2011, Merck KGaA set up a Contractual Trust Arrangement (CTA) with Merck Pensions-treuhand e.V., Darmstadt. Accordingly, the benefit obligations of Merck KGaA were reclassified from the category “funded by provisions” to the category “funded”.
The following overview shows how the present value of all defined benefit obligations would have been influenced by changes to definitive actuarial assumptions:
€ million Dec. 31, 2012
Present value of all defined benefit obligations ifthe discount rate is 50 basis points higher 2,621.3the discount rate is 50 basis points lower 3,069.7expected rate of future salary increases is 0.50% higher 2,896.6expected rate of future salary increases 0.50% lower 2,768.9expected rate of future pension increases is 0.50% higher 2,964.8expected rate of future pension increases is 0.50% lower 2,714.3medical cost trend rate is 0.50% higher 2,830.9medical cost trend is 0.50% lower 2,829.3
The fair value of the plan assets changed in the reporting period as follows:
€ million 2012 2011
Fair value of the plan assets on January 1 1,370.3 793.3Currency translation differences 6.2 23.2Interest income from plan assets 53.8 31.61
Actuarial gains (+) / losses (–) arising from experience adjustments 62.8 –5.41
Funding CTA Merck KGaA 250.0 520.0Employer contributions 59.9 39.3Employee contributions 13.6 14.1Pension payments from plan assets –186.3 –42.1Changes in scope of consolidation – 0.9Plan administration costs paid from the plan assets recognized in income –0.6 –Other effects recognized in income –0.1 –Other changes 4.0 –4.6Fair value of the plan assets on December 31 1,633.6 1,370.31 Previous year’s figures have been adjusted, see Note [5]
174
Notes to the consolidated balance sheet
Merck 2012Consolidated Financial Statements

The actual return on plan assets amounted to € 116.6 million in 2012 (2011: income of € 26.2 million). As in the previous year, there were no effects of the asset ceiling in accordance with IAS 19.64.
The development of cumulative actuarial gains (+) and losses (–) was as follows:
€ million 2012 2011
Cumulated actuarial gains (+) / losses (–) recognized in equity on January 1 –489.7 –466.91
Currency translation differences –1.2 –2.8Remeasurements of defined benefit obligations
Actuarial gains (+) / losses (–) arising from changes in demographic assumptions 12.4 –Actuarial gains (+) / losses (–) arising from changes in financial assumptions –333.2 –5.2Actuarial gains (+) / losses (–) arising from experience adjustments –46.3 –9.6
Remeasurements on plan assetsActuarial gains (+) / losses (–) arising from experience adjustments 62.8 –5.41
Reclassification within retained earnings –0.4 0.2Cumulated actuarial gains (+) / losses (–) recognized in equity on December 31 –795.6 –489.71
1 Previous year’s figures have been adjusted, see Note [5]
Plan assets for funded benefit obligations primarily comprised fixed-income securities, liquid assets, and stocks. They did not include financial instruments issued by Merck Group companies or real estate used by Group companies.
The plan assets serve exclusively to meet the defined benefit obligations. Covering these benefit obliga-tions with financial assets represents a means of providing for future cash outflows, which occur in some countries on the basis of legal requirements and in other countries (e.g. Germany) on a voluntary basis.
The ratio of the fair value of the plan assets to the present value of the defined benefit obligations is referred to as the degree of pension plan funding. If the benefit obligations exceed the plan assets, this represents underfunding of the pension fund.
It should be noted, however, that both the benefit obligations as well as the plan assets fluctuate over time. This could lead to an increase in underfunding. Depending on the statutory regulations, it could become necessary in some countries for the Merck Group to reduce underfunding through additions of liquid assets. The reasons for such fluctuations could include changes in market interest rates and thus the discount rate as well as adjustments to other actuarial assumptions (e.g. life expectancy, inflation rates, etc.)
In order to minimize such fluctuations, in managing its plan assets, the Merck Group also pays attention to potential fluctuations in liabilities. In the ideal case, assets and liabilities develop in opposite directions when exposed to exogenous factors, creating a natural defense against these factors. In order to achieve this effect, the corresponding use of financial instruments is considered in respect of individual pension plans.
175
Notes to the consolidated balance sheet
Merck 2012Consolidated Financial Statements

The fair value of the plan assets can be allocated to the following categories:
Dec. 31, 2012 Dec. 31, 2011
€ million
Quoted market price in
an active market
No quoted market price in
an active market Total
Quoted market price in
an active market
No quoted market price in
an active market Total
Cash and cash equivalents 455.3 4.1 459.4 328.3 5.4 333.7Equity instruments 311.5 13.3 324.8 204.9 13.0 217.9Debt instruments 548.5 – 548.5 563.6 – 563.6Direct investments in real estate – 86.4 86.4 – 80.3 80.3Investment funds 65.9 – 65.9 73.3 – 73.3Asset-backed securities 1.5 11.2 12.7 2.0 14.7 16.7Structured debt 10.0 – 10.0 13.1 – 13.1Insurance contracts – 73.6 73.6 – 70.5 70.5Other 51.4 0.9 52.3 – 1.2 1.2Fair value of the plan assets 1,444.1 189.5 1,633.6 1,185.2 185.1 1,370.3
Employer contributions to plan assets will probably amount to around € 37.4 million in 2013 (2012: € 39.0 million). The weighted duration amounted to 16 years.
The cost of ongoing contributions for defined contribution plans that are financed exclusively by external funds and for which the companies of the Merck Group are only obliged to pay the contributions amounted to € 19.9 million (2011: € 19.1 million). In addition, employer contributions amounting to € 54.9 million (2011: € 56.4 million) were transferred to the German statutory pension insurance system and € 33.9 million (2011: € 28.9 million) to statutory pension insurance systems abroad.
( 52 ) EquityAs of the balance sheet date, the subscribed capital of the company was divided into 64,621,125 no-par value bearer shares as well as one registered share. The amount resulting from the issue of shares by Merck KGaA exceeding the nominal amount was recognized in the capital reserves.
The disclosure of non-controlling interest was based on the stated equity of the subsidiaries concerned after any adjustment required to ensure compliance with the accounting policies of the Merck Group, as well as pro rata consolidation entries.
The net equity attributable to non-controlling interests mainly related to the minority interests in Merck Ltd., India, Merck Ltd., Thailand, P.T. Merck Tbk, Indonesia, and Merck (Pvt.) Ltd., Pakistan.
176
Notes to the consolidated balance sheet
Merck 2012Consolidated Financial Statements

In addition to the dividend payments to the shareholders of Merck KGaA and to non-controlling interests of subsidiaries, the appropriation of profits included the transfer of profits from Merck & Cie to E. Merck KG in accord ance with the company agreements. It also included the reciprocal transfer of profits be tween E. Merck KG and Merck KGaA in accordance with the Articles of Association, which is as follows:
In accordance with the provisions of the Articles of Association, E. Merck KG has a 70.274% interest in the distributable profit/loss of Merck KGaA while Merck KGaA has an interest of 29.726% in the distributable profit/loss of E. Merck KG. Merck KGaA’s result from ordinary activities adjusted for trade income tax and extraordinary result, on which the appropriation of its profit is based, amounted to € –529.3 million (2011: € 1,335.5 million). Merck KGaA transferred € 372.0 million of its loss to E. Merck KG (2011: profit transfer of € 938.5 million). The result of E. Merck KG, on which the appropriation of profits is based, amounted to € 7.5 million (2011: € 2.7 million). Consequently, this resulted in a profit transfer to Merck KGaA of € 2.2 million (2011: € 0.8 million). Moreover, in 2012 € 61.8 million (2011: € 44.3 million) was transferred by Merck & Cie to E. Merck KG.
For 2011, a dividend of € 1.50 per share was distributed. The dividend proposal for fiscal 2012 will be € 1.70 per share, corresponding to a total dividend payment of € 109.9 million to shareholders.
2012 2011
€ million E. Merck KG Merck KGaA E. Merck KG Merck KGaA
Result of E. Merck KG 7.5 – 2.7 –Result of ordinary activities of Merck KGaA – –17.2 – 1,326.9Extraordinary result – –513.8 – –20.5
Adjustment for trade income tax in accordance with Art. 27 (1) Articles of Association of Merck KGaA – – – –
Trade income tax in accordance with Art. 30 (1) Articles of Association of Merck KGaA – –1.7 – 29.1Basis for the appropriation of profits (100%) 7.5 –529.3 2.7 1,335.5
Profit transfer to E. Merck KG Ratio general partner’s capital to total capital (70.274%) –372.0 372.0 938.5 –938.5
Profit transfer from E. Merck KG Ratio of share capital to total capital (29.726%) –2.2 2.2 –0.8 0.8Trade tax – – – –Corporation tax – 4.0 – –23.6Net income / loss –366.7 –151.1 940.4 374.2
177
Notes to the consolidated balance sheet
Merck 2012Consolidated Financial Statements
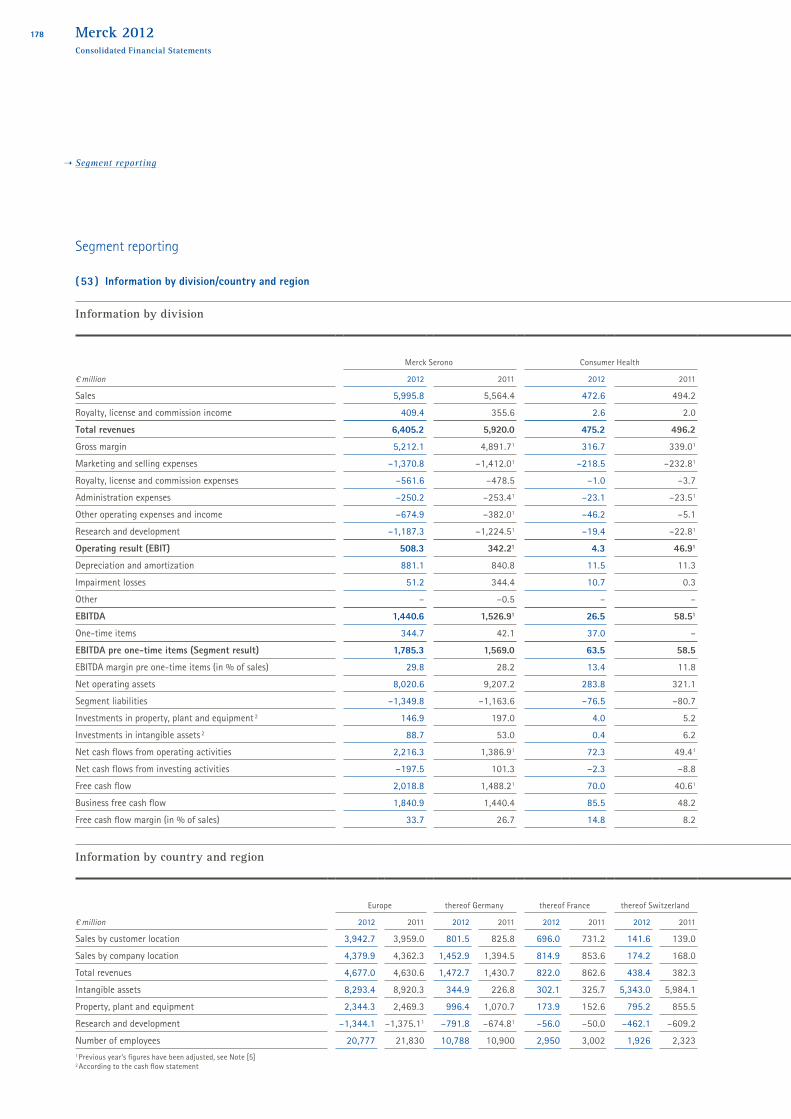
Information by division
Merck Serono Consumer Health Performance Materials Merck Millipore Corporate and Other Group
€ million 2012 2011 2012 2011 2012 2011 2012 2011 2012 2011 2012 2011
Sales 5,995.8 5,564.4 472.6 494.2 1,674.2 1,464.7 2,598.2 2,382.6 – – 10,740.8 9,905.9Royalty, license and commission income 409.4 355.6 2.6 2.0 1.4 2.7 18.7 10.2 – – 432.1 370.5Total revenues 6,405.2 5,920.0 475.2 496.2 1,675.6 1,467.4 2,616.9 2,392.8 – – 11,172.9 10,276.4Gross margin 5,212.1 4,891.71 316.7 339.01 959.1 875.31 1,531.1 1,389.61 –3.8 –4.81 8.015.2 7,490.81
Marketing and selling expenses –1,370.8 –1,412.01 –218.5 –232.81 –142.8 –132.41 –675.7 –606.01 –3.0 –2.51 –2,410.8 –2,385.71
Royalty, license and commission expenses –561.6 –478.5 –1.0 –3.7 –1.5 –2.3 –15.7 –16.0 – – –579.8 –500.5Administration expenses –250.2 –253.41 –23.1 –23.51 –35.2 –33.11 –113.5 –104.11 –130.2 –121.51 –552.2 –535.61
Other operating expenses and income –674.9 –382.01 –46.2 –5.1 –39.2 127.41 –122.9 –103.01 –243.3 –54.51 –1,126.5 –417.21
Research and development –1,187.3 –1,224.51 –19.4 –22.81 –137.4 –132.81 –166.1 –133.41 –1.1 –0.51 –1,511.3 –1,514.01
Operating result (EBIT) 508.3 342.21 4.3 46.91 598.5 691.01 233.2 235.41 –380.7 –183.41 963.6 1,132.11
Depreciation and amortization 881.1 840.8 11.5 11.3 114.1 102.5 305.0 283.7 7.6 5.4 1,319.3 1,243.7Impairment losses 51.2 344.4 10.7 0.3 12.1 9.5 4.2 1.8 0.5 – 78.7 356.0Other – –0.5 – – –1.3 –1.9 – 1.5 –0.1 – –1.4 –0.9EBITDA 1,440.6 1,526.91 26.5 58.51 723.4 801.11 542.4 522.41 –372.7 –178.01 2,360.2 2,730.91
One-time items 344.7 42.1 37.0 – 7.3 –118.4 53.5 38.7 162.2 30.5 604.7 –7.1EBITDA pre one-time items (Segment result) 1,785.3 1,569.0 63.5 58.5 730.7 682.7 595.9 561.1 –210.5 –147.5 2,964.9 2,723.8EBITDA margin pre one-time items (in % of sales) 29.8 28.2 13.4 11.8 43.6 46.6 22.9 23.6 – – 27.6 27.5Net operating assets 8,020.6 9,207.2 283.8 321.1 1,187.7 1,331.0 6,328.9 6,608.6 25.1 –1.3 15,846.1 17,466.6Segment liabilities –1,349.8 –1,163.6 –76.5 –80.7 –147.1 –131.7 –383.1 –335.4 –33.7 –22.9 –1,990.2 –1,734.3Investments in property, plant and equipment 2 146.9 197.0 4.0 5.2 55.7 64.1 113.2 99.7 9.3 0.3 329.1 366.3Investments in intangible assets 2 88.7 53.0 0.4 6.2 28.6 2.7 10.0 12.0 16.5 5.8 144.2 79.7Net cash flows from operating activities 2,216.3 1,386.91 72.3 49.41 875.4 573.81 639.7 413.41 –1,331.5 –1,152.31 2,472.2 1,271.2Net cash flows from investing activities –197.5 101.3 –2.3 –8.8 –70,8 128.6 –137.4 –263.3 –749.9 –853.8 –1,157.9 –896.0Free cash flow 2,018.8 1,488.21 70.0 40.61 804.6 702.41 502.2 150.01 –1,355.7 –944.81 2,039.9 1,436.4Business free cash flow 1,840.9 1,440.4 85.5 48.2 786.9 572.3 492.8 352.3 –236.8 –151.3 2,969.3 2,261.9Free cash flow margin (in % of sales) 33.7 26.7 14.8 8.2 48.1 48.0 19.3 6.3 – – 19.0 14.5
Information by country and region
Europe thereof Germany thereof France thereof Switzerland North America thereof USA Emerging Markets Rest of World Group
€ million 2012 2011 2012 2011 2012 2011 2012 2011 2012 2011 2012 2011 2012 2011 2012 2011 2012 2011
Sales by customer location 3,942.7 3,959.0 801.5 825.8 696.0 731.2 141.6 139.0 2,128.3 1,789.1 1,965.0 1,641.9 3,712.2 3,283.9 957.6 873.9 10,740.8 9,905.9Sales by company location 4,379.9 4,362.3 1,452.9 1,394.5 814.9 853.6 174.2 168.0 2,121.4 1,781.2 1,979.0 1,651.9 3,408.4 3,001.4 831.1 761.0 10,740.8 9,905.9Total revenues 4,677.0 4,630.6 1,472.7 1,430.7 822.0 862.6 438.4 382.3 2,122.1 1,781.9 1,979.7 1,652.6 3,542.7 3,103.0 831.1 760.9 11,172.9 10,276.4Intangible assets 8,293.4 8,920.3 344.9 226.8 302.1 325.7 5,343.0 5,984.1 2,462.1 2,599.6 2,461.6 2,598.9 141.3 184.0 47.7 60.4 10,944.5 11,764.3Property, plant and equipment 2,344.3 2,469.3 996.4 1,070.7 173.9 152.6 795.2 855.5 359.6 366.0 358.3 364.5 163.7 176.8 86.0 101.3 2,953.6 3,113.4Research and development –1,344.1 –1,375.11 –791.8 –674.81 –56.0 –50.0 –462.1 –609.2 –114.5 –95.2 –113.3 –92.4 –28.6 –27.1 –24.1 –16.6 –1,511.3 –1,514.01
Number of employees 20,777 21,830 10,788 10,900 2,950 3,002 1,926 2,323 4,848 4,962 4,688 4,793 11,642 12,229 1,580 1,655 38,847 40,6761 Previous year’s figures have been adjusted, see Note [5] 2 According to the cash flow statement
Segment reporting
( 53 ) Information by division/country and region
178
Segment reporting
Merck 2012Consolidated Financial Statements

Information by division
Merck Serono Consumer Health Performance Materials Merck Millipore Corporate and Other Group
€ million 2012 2011 2012 2011 2012 2011 2012 2011 2012 2011 2012 2011
Sales 5,995.8 5,564.4 472.6 494.2 1,674.2 1,464.7 2,598.2 2,382.6 – – 10,740.8 9,905.9Royalty, license and commission income 409.4 355.6 2.6 2.0 1.4 2.7 18.7 10.2 – – 432.1 370.5Total revenues 6,405.2 5,920.0 475.2 496.2 1,675.6 1,467.4 2,616.9 2,392.8 – – 11,172.9 10,276.4Gross margin 5,212.1 4,891.71 316.7 339.01 959.1 875.31 1,531.1 1,389.61 –3.8 –4.81 8.015.2 7,490.81
Marketing and selling expenses –1,370.8 –1,412.01 –218.5 –232.81 –142.8 –132.41 –675.7 –606.01 –3.0 –2.51 –2,410.8 –2,385.71
Royalty, license and commission expenses –561.6 –478.5 –1.0 –3.7 –1.5 –2.3 –15.7 –16.0 – – –579.8 –500.5Administration expenses –250.2 –253.41 –23.1 –23.51 –35.2 –33.11 –113.5 –104.11 –130.2 –121.51 –552.2 –535.61
Other operating expenses and income –674.9 –382.01 –46.2 –5.1 –39.2 127.41 –122.9 –103.01 –243.3 –54.51 –1,126.5 –417.21
Research and development –1,187.3 –1,224.51 –19.4 –22.81 –137.4 –132.81 –166.1 –133.41 –1.1 –0.51 –1,511.3 –1,514.01
Operating result (EBIT) 508.3 342.21 4.3 46.91 598.5 691.01 233.2 235.41 –380.7 –183.41 963.6 1,132.11
Depreciation and amortization 881.1 840.8 11.5 11.3 114.1 102.5 305.0 283.7 7.6 5.4 1,319.3 1,243.7Impairment losses 51.2 344.4 10.7 0.3 12.1 9.5 4.2 1.8 0.5 – 78.7 356.0Other – –0.5 – – –1.3 –1.9 – 1.5 –0.1 – –1.4 –0.9EBITDA 1,440.6 1,526.91 26.5 58.51 723.4 801.11 542.4 522.41 –372.7 –178.01 2,360.2 2,730.91
One-time items 344.7 42.1 37.0 – 7.3 –118.4 53.5 38.7 162.2 30.5 604.7 –7.1EBITDA pre one-time items (Segment result) 1,785.3 1,569.0 63.5 58.5 730.7 682.7 595.9 561.1 –210.5 –147.5 2,964.9 2,723.8EBITDA margin pre one-time items (in % of sales) 29.8 28.2 13.4 11.8 43.6 46.6 22.9 23.6 – – 27.6 27.5Net operating assets 8,020.6 9,207.2 283.8 321.1 1,187.7 1,331.0 6,328.9 6,608.6 25.1 –1.3 15,846.1 17,466.6Segment liabilities –1,349.8 –1,163.6 –76.5 –80.7 –147.1 –131.7 –383.1 –335.4 –33.7 –22.9 –1,990.2 –1,734.3Investments in property, plant and equipment 2 146.9 197.0 4.0 5.2 55.7 64.1 113.2 99.7 9.3 0.3 329.1 366.3Investments in intangible assets 2 88.7 53.0 0.4 6.2 28.6 2.7 10.0 12.0 16.5 5.8 144.2 79.7Net cash flows from operating activities 2,216.3 1,386.91 72.3 49.41 875.4 573.81 639.7 413.41 –1,331.5 –1,152.31 2,472.2 1,271.2Net cash flows from investing activities –197.5 101.3 –2.3 –8.8 –70,8 128.6 –137.4 –263.3 –749.9 –853.8 –1,157.9 –896.0Free cash flow 2,018.8 1,488.21 70.0 40.61 804.6 702.41 502.2 150.01 –1,355.7 –944.81 2,039.9 1,436.4Business free cash flow 1,840.9 1,440.4 85.5 48.2 786.9 572.3 492.8 352.3 –236.8 –151.3 2,969.3 2,261.9Free cash flow margin (in % of sales) 33.7 26.7 14.8 8.2 48.1 48.0 19.3 6.3 – – 19.0 14.5
Information by country and region
Europe thereof Germany thereof France thereof Switzerland North America thereof USA Emerging Markets Rest of World Group
€ million 2012 2011 2012 2011 2012 2011 2012 2011 2012 2011 2012 2011 2012 2011 2012 2011 2012 2011
Sales by customer location 3,942.7 3,959.0 801.5 825.8 696.0 731.2 141.6 139.0 2,128.3 1,789.1 1,965.0 1,641.9 3,712.2 3,283.9 957.6 873.9 10,740.8 9,905.9Sales by company location 4,379.9 4,362.3 1,452.9 1,394.5 814.9 853.6 174.2 168.0 2,121.4 1,781.2 1,979.0 1,651.9 3,408.4 3,001.4 831.1 761.0 10,740.8 9,905.9Total revenues 4,677.0 4,630.6 1,472.7 1,430.7 822.0 862.6 438.4 382.3 2,122.1 1,781.9 1,979.7 1,652.6 3,542.7 3,103.0 831.1 760.9 11,172.9 10,276.4Intangible assets 8,293.4 8,920.3 344.9 226.8 302.1 325.7 5,343.0 5,984.1 2,462.1 2,599.6 2,461.6 2,598.9 141.3 184.0 47.7 60.4 10,944.5 11,764.3Property, plant and equipment 2,344.3 2,469.3 996.4 1,070.7 173.9 152.6 795.2 855.5 359.6 366.0 358.3 364.5 163.7 176.8 86.0 101.3 2,953.6 3,113.4Research and development –1,344.1 –1,375.11 –791.8 –674.81 –56.0 –50.0 –462.1 –609.2 –114.5 –95.2 –113.3 –92.4 –28.6 –27.1 –24.1 –16.6 –1,511.3 –1,514.01
Number of employees 20,777 21,830 10,788 10,900 2,950 3,002 1,926 2,323 4,848 4,962 4,688 4,793 11,642 12,229 1,580 1,655 38,847 40,6761 Previous year’s figures have been adjusted, see Note [5] 2 According to the cash flow statement
179
Segment reporting
Merck 2012Consolidated Financial Statements

( 54 ) Segment reportingSegmentation was performed in accordance with the organizational and reporting structure of the Merck Group. Within the Merck Serono division, we focus on specialist therapeutic areas and market innovative pre-scription drugs of chemical and biotechnological origin. The Consumer Health division comprises Merck’s business with high-quality over-the-counter products for preventive health care and self-treatment of minor ailments. The Performance Materials division consists of the Liquid Crystals and Pigments & Cosmetics business units. The Merck Millipore division offers solutions to two key customer groups: research and analytical laboratories in the pharmaceutical/biotechnology industry or in academic institutions, and cus-tomers manufacturing large- and small- molecule drugs. The fields of activity of the individual divisions are described in detail in the sections about the divisions in the management report.
Corporate and Other includes assets and liabilities as well as income and expenses that cannot be directly allocated to the reportable segments presented; it serves the reconciliation to the Group numbers. The numbers mainly relate to Group functions. The cash flows attributable to the financial result and income taxes are also presented under Corporate and Other.
Apart from sales, the success of a segment is mainly determined by EBITDA pre one-time items (segment result).
Transfer prices for intragroup sales are determined on an arm’s-length basis. There were no significant intercompany relations between the business segments.
The Emerging Markets region was introduced in the information by country and region in order to appropriately reflect the importance that this region has acquired in our operating divisions. The Emerging Markets region comprises Latin America and Asia with the exception of Japan. The region “Rest of World” comprises Japan, Africa and Australia/Oceania.
Neither in 2012 nor in 2011 did any single customer account for more than 10% of Group sales.
The reconciliation of EBITDA pre one-time items of all operating businesses to the profit before income tax of the Merck Group was as follows:
€ million 2012 2011
Total EBITDA pre one-time items of the operating businesses 3,175.4 2,871.3Corporate and Other –210.5 –147.51
EBITDA pre one-time items of the Merck Group 2,964.9 2,723.8Depreciation and amortization / impairment losses / other –1,396.6 –1,598.8One-time items –604.7 7.1Operating result (EBIT) 963.6 1,132.11
Financial result –254.6 –293.31
Profit before income tax 709.0 838.81
1 Previous year’s figures have been adjusted, see Note [5]
180
Segment reporting
Merck 2012Consolidated Financial Statements

The reconciliation of operating assets in the Segment Reporting was as follows:
€ million Dec. 31, 2012 Dec. 31, 2011
Assets 21,643.3 22,121.91
Monetary assets (cash and cash equivalents, current financial assets, loans, securities) –2,633.7 –2,082.7
Non-operating receivables, income tax receivables, deferred taxes and net defined benefit assets –1,173.3 –838.31
Operating assets (gross) 17,836.3 19,200.9Trade accounts payable –1,288.3 –1,100.8Other operating liabilities –701.9 –633.5Segment liabilities –1,990.2 –1,734.3Operating assets (net) 15,846.1 17,466.61 Previous year’s figures have been adjusted, see Note [5]
The investment result disclosed in the income statement in 2012 totaled € 0.6 million (2011: € 0.2 million) and was attributable to the Corporate and Other segment. In 2011, an investment result of € –1.2 million was attributable to the Merck Millipore division.
Notes to the consolidated cash flow statement
( 55 ) Net cash flows from operating activitiesIn 2012, tax payments totaled € 580.5 million (2011: € 436.0 million). Tax refunds totaled € 18.6 million (2011: € 78.3 million). Interest paid totaled € 303.6 million (2011: € 238.7 million). The increase was due to the sale of two interest rate swaps involving a cash outflow of € 41.7 million. Interest received amounted to € 59.9 million (2011: € 75.5 million). A focus on working capital management increased cash flow from operating activities by € 525.6 million. Within the scope of a Contractual Trust Arrangement in Germany, € 250.0 million was transferred to Merck Pensionstreuhand e.V., Darmstadt (trustee) (2011: € 520.0 million). This led to a corresponding decline in pension provisions and to a decrease in cash flows from operating activities.
( 56 ) Net cash flows from investing activitiesA total of € 63.0 million was used for acquisitions and investments in non-current financial assets (2011: € 171.5 million). Of this amount, € 20.6 million (2011: € 161.0 million) was used for acquisitions. In vestments in non-current financial assets totaled € 42.4 million (2011: € 10.5 million). Acquisitions reflect the purchase of CellASIC Corp. and Biochrom AG.
181
Segment reporting / Notes to the consolidated cash flow statement
Merck 2012Consolidated Financial Statements

€ million Total 2012
Purchase price paid 21.7Cash and cash equivalents acquired –1.1Acquisitions 20.6
In 2012, cash inflows from disposals of assets amounted to € 93.6 million. Cash inflows in 2011 related mainly to the payment of our purchase price receivable of € 270.2 for the sale of Théramex, which closed in December 2010, the divestment of the Crop BioScience business amounting to € 200.9 million, and the sale of Merck Capital Asset Management Limited, Malta, to Merck Pensionstreuhand e.V., Darmstadt, amounting to € 218.1 million.
Net cash outflows from changes in other financial assets amounting to € 725.6 million (2011: € 1,061.2 million) mainly resulted from short-term monetary deposits and the purchase of current financial assets.
( 57 ) Net cash flows from financing activitiesDisclosed dividend payments and transfers of profits in accordance with the Articles of Association were broken down as follows in the fiscal year:
€ million 2012 2011
Dividends to shareholders –96.9 –80.8Dividends to shareholders of non-controlling interest –5.7 –6.0Dividend payments –102.6 –86.8
€ million 2012 2011
Profit transfer in accordance with the Articles of Association from E. Merck KG to Merck KGaA 2.2 0.8
Profit transfer in accordance with the Articles of Association from Merck KGaA to E. Merck KG 372.0 –938.5Changes in reserves of Merck KGaA by E. Merck KG –616.9 655.5
Profit transfer from Merck KGaA to E. Merck KG –242.7 –282.2Profit transfer from Merck & Cie to E. Merck KG –61.8 –44.3Profit transfer to E. Merck KG –304.5 –326.5
Changes in financial liabilities to E. Merck KG 33.9 8.9Changes in other liabilities to E. Merck KG –23.3 68.4
Changes in liabilities to E. Merck KG 10.6 77.3Total cash transfers to and from E. Merck KG –293.9 –249.2
In December 2012, Merck acquired the non-controlling interest in Allergopharma GmbH & Co. KG, Reinbek, Germany, for a purchase price of € 15.0 million.
182
Segment reporting / Notes to the consolidated cash flow statement
Merck 2012Consolidated Financial Statements

( 58 ) Free cash flow and business free cash flowFree cash flow is an indicator used internally by Merck to measure the contribution of the divisions to liquidity. Free cash flow includes all net cash flows from operating activities as well as investing activities performed in connection with operating business. Not included in free cash flow are pure financial investments and similar monetary deposits of more than three months, which are also to be reported as net cash flows from investing activities under IFRS.
Free cash flow was calculated as follows:
€ million 2012 2011
Net cash flows from operating activities 2,472.2 1,271.2Investments in intangible assets –144.2 –79.7Investments in property, plant and equipment –329.1 –366.3Acquisitions –20.6 –161.0Investments in non-current financial assets –42.4 –10.5Disposal of non-current assets 93.6 787.4Purchase / sale of marketable securities 10.4 –4.7Free cash flow 2,039.9 1,436.4
In addition, business free cash flow is an important indicator used to agree internal targets for steering liquidity. It comprises the major payment-relevant items that the individual businesses can influence.
The composition of business free cash flow was as follows:
€ million 2012 2011
EBITDA pre one-time items 2,964.9 2,723.8
less investments in property, plant and equipment, software as well as advance payments for intangible assets –366.5 –412.3Changes in inventories as reported in the balance sheet 157.2 –17.6Changes in trade accounts receivable as reported in the balance sheet 213.7 –32.0Business free cash flow 2,969.3 2,261.9
Both indicators are presented in the Segment Reporting (see Note [53]).
€ million Total 2012
Purchase price paid 21.7Cash and cash equivalents acquired –1.1Acquisitions 20.6
In 2012, cash inflows from disposals of assets amounted to € 93.6 million. Cash inflows in 2011 related mainly to the payment of our purchase price receivable of € 270.2 for the sale of Théramex, which closed in December 2010, the divestment of the Crop BioScience business amounting to € 200.9 million, and the sale of Merck Capital Asset Management Limited, Malta, to Merck Pensionstreuhand e.V., Darmstadt, amounting to € 218.1 million.
Net cash outflows from changes in other financial assets amounting to € 725.6 million (2011: € 1,061.2 million) mainly resulted from short-term monetary deposits and the purchase of current financial assets.
( 57 ) Net cash flows from financing activitiesDisclosed dividend payments and transfers of profits in accordance with the Articles of Association were broken down as follows in the fiscal year:
€ million 2012 2011
Dividends to shareholders –96.9 –80.8Dividends to shareholders of non-controlling interest –5.7 –6.0Dividend payments –102.6 –86.8
€ million 2012 2011
Profit transfer in accordance with the Articles of Association from E. Merck KG to Merck KGaA 2.2 0.8
Profit transfer in accordance with the Articles of Association from Merck KGaA to E. Merck KG 372.0 –938.5Changes in reserves of Merck KGaA by E. Merck KG –616.9 655.5
Profit transfer from Merck KGaA to E. Merck KG –242.7 –282.2Profit transfer from Merck & Cie to E. Merck KG –61.8 –44.3Profit transfer to E. Merck KG –304.5 –326.5
Changes in financial liabilities to E. Merck KG 33.9 8.9Changes in other liabilities to E. Merck KG –23.3 68.4
Changes in liabilities to E. Merck KG 10.6 77.3Total cash transfers to and from E. Merck KG –293.9 –249.2
In December 2012, Merck acquired the non-controlling interest in Allergopharma GmbH & Co. KG, Reinbek, Germany, for a purchase price of € 15.0 million.
183
Notes to the consolidated cash flow statement
Merck 2012Consolidated Financial Statements

Other disclosures
( 59 ) Derivative financial instrumentsMerck uses derivative financial instruments exclusively to hedge and reduce risks stemming from currency and interest rate positions. Foreign currency risks from recognized transactions are largely hedged. Merck currently uses marketable forward exchange contracts, interest rate swaps and currency options as hedging instruments. Depending on the nature of the hedging transaction, changes in the fair values of hedged items are disclosed in the income statement either in the operating result or, in the case of financial transactions, in the financial result. The strategy to hedge interest rate and foreign exchange rate fluctuations arising from future transactions is set by a Merck Group risk committee, which meets on a regular basis. A review period of up to 36 months normally serves as the basis for entering into currency derivative contracts. Extensive guidelines regulate the use of derivatives. There is a ban on speculation. Derivative transactions are subject to continuous risk management procedures. Trading, settlement and control functions are strictly separated. Derivative financial contracts are only entered into with banks that have a good credit rating. Related default risks are continuously monitored.
The following derivative financial positions were held as of the balance sheet date:
Nominal volume Fair value
€ million Dec. 31, 2012 Dec. 31, 2011 Dec. 31, 2012 Dec. 31, 2011
Cash flow hedge 5,798.9 6,493.9 –106.1 –276.7Interest 650.0 850.0 –58.1 –30.2Currency 5,148.9 5,643.9 –48.0 –246.5
Fair value hedge – 500.0 – 5.4Interest – 500.0 – 5.4Currency – – – –
No hedge accounting 1,610.1 1,996.3 5.4 –24.4Interest – 750.0 – –16.6Currency 1,610.1 1,246.3 5.4 –7.8
7,409.0 8,990.2 –100.7 –295.7
The stated fair values for derivatives do not include accrued interest (clean price).The nominal volume is the aggregate of all buy and sell amounts relating to derivative contracts.
The fair values result from the valuation of open positions at market prices, ignoring any opposite movements in the value of the underlyings. They correspond to the income or expenses which would result if the derivatives contract were closed out as of the balance sheet date. Transactions are recognized at fair value on the basis of quoted prices or current market data provided by a recognized information service.
184
Other disclosures
Merck 2012Consolidated Financial Statements

The maturity structure of the hedging transactions (nominal volume) is as follows as of the balance sheet date:
€ million
Remaining maturity less
than 1 year
Remaining maturity more
than 1 yearTotal
Dec. 31, 2012
Remaining maturity less
than 1 year
Remaining maturity more
than 1 yearTotal
Dec. 31, 2011
Foreign exchange contracts 3,965.8 2,089.3 6,055.1 3,487.3 2,693.1 6,180.4Currency options 292.9 411.0 703.9 446.9 262.9 709.8Interest rate swaps – 650.0 650.0 500.0 1,100.0 1,600.0Interest rate futures – – – 500.0 – 500.0
4,258.7 3,150.3 7,409.0 4,934.2 4,056.0 8,990.2
The forward exchange contracts that are entered into to reduce the exchange rate risk and currency options primarily serve to hedge intercompany financing in foreign currency as well as to hedge future cash flows. These mainly served to hedge fluctuations in the exchange rates of the U.S. dollar (€ 4,409.6 million), the Japanese yen (€ 458.4 million) and the Taiwan dollar (€ 388.4 million) versus the euro.
Planned future transactions are only hedged if the occurrence can be assumed to be highly probable. The nominal volume of hedged planned transactions amounted to € 2,411.6 million (2011: € 2,829.8 million) as of the balance sheet date and related to both the hedging of future transactions in non-functional currency as well as hedging of variable interest payments for planned refinancing transactions. Moreover, existing monetary deposits and borrowings in foreign currency as well as an existing variable interest private placement with a nominal amount of € 100.0 million were also hedged. All the aforementioned hedging relationships represented cash flow hedges.
Overall, income of € 3.6 million (2011: expenses of € 50.1 million) from the fair value measurement of derivatives to hedge cash flows was recognized in equity in 2012. € 78.4 million (2011: € 12.3 million) was transferred from equity and recognized as an expense. In 2012, no ineffectiveness for hedging transactions was recognized in income.
The hedging of planned transactions in non-functional currency related to sales in U.S. dollars, Taiwan dollars and Japanese yen that are expected within the next 36 months. Forward exchange contracts and currency options are used as hedging instruments.
For the planned refinancing of the bond maturing in 2015, we entered into forward interest rate swap contracts with a nominal value of € 550.0 million to hedge the interest rate level. The fair value was recognized in equity at 100% effectiveness. In addition, interest rate hedge contracts with a nominal volume of € 250.0 million for bonds due in 2012 were closed out since refinancing did not occur. The resulting expenses from the fair value of the hedge amounting to € 26.7 million were reported in the financial result.
Furthermore, a fair value hedge existed in 2012. The interest expense of the euro benchmark bond issued in 2005 and maturing in 2012 with a volume of € 500.0 million was made variable through interest rate swaps. The mark-to-market measurement of the bond resulted in income of € 5.4 million in 2012 (2011: € 10.0 million). This compared with an expense from the interest rate swap in the same amount.
185
Other disclosures
Merck 2012Consolidated Financial Statements

( 60 ) Management of financial risksMarket fluctuations with respect to foreign exchange and interest rates represent significant profit and cash flow risks for Merck. Merck aggregates these Group-wide risks and steers them also by using derivative financial instruments. Merck uses scenario analyses to estimate existing risks of foreign exchange and interest rate fluctuations as well as credit defaults. Merck is not subject to any material risk cluster from financial transactions. The Risk Report included in the Management Report provides further information on the management of financial risks.
Foreign exchange risks Owing to its international business focus, Merck is exposed to foreign exchange-related transaction risks within the scope of both ordinary business and financing activities. Different strategies are used to limit or eliminate these risks.Foreign exchange risks from recognized transactions are eliminated as far as possible through the use of forward exchange contracts. Foreign exchange risks arising from planned transactions are analyzed regularly and reduced if necessary through forward exchange contracts or currency options applying hedge accounting.
The following table presents the net foreign exchange risk from expected and recognized transactions in 2012 in the key currencies and exchange rate fluctuations versus the euro:
€ million as of Dec. 31, 2012 CHF JPY TWD USD
Foreign exchange risk from balance sheet items –107.8 125.4 28.4 2,082.1
Foreign exchange risk from contingent business and expected transactions in 2013 –375.1 304.3 235.7 1,410.1Transaction-related foreign exchange position –482.9 429.7 264.1 3,492.2Position hedged by derivatives 177.4 –216.0 –163.8 –2,855.5Open-end foreign exchange risk position –305.5 213.7 100.3 636.7
Change in foreign exchange position 1 due to a 10% appreciation of the euro 2 30.6 –21.4 –10.0 –63.7included in profit / loss –7.0 –1.4 – 6.2recognized in equity – 10.5 13.6 71.21 Foreign exchange positions include booked and planned transactions. Only the exchange rate effects on booked transactions are reflected in profit/loss or equity.
2 A 10% devaluation of the euro would have an opposite effect of the same amount.
Further significant foreign exchange risks also resulted from transactions booked in Taiwan dollars, Hong Kong dollars as well as Venezuelan bolivars subject to exchange rate movements versus the U.S. dollar. The changes in foreign exchange positions as a result of a 10% appreciation in the value of the U.S. dollar would be € 0.0 million (2011: € 0.0 million) for the Taiwan dollar position after hedging, € 4.1 million (2011: € 2.5 million) for the Venezuelan bolivar position, and € –0.9 million (2011: € 1.6 million) for the Hong Kong dollar position, and would be fully recognized in income. Moreover, derivatives existed to hedge expected
186
Other disclosures
Merck 2012Consolidated Financial Statements

cash flows beyond the year 2013. A 10% increase in the value of the euro over the Japanese yen, the Taiwan dollar and the U.S. dollar would have changed equity by € 14.5 million, € 9.8 million and € 65.4 million, respectively. In 2011, owing to hedging of expected cash flows beyond the year 2012, a 10% increase in the value of the euro over the Japanese yen, the Taiwan dollar and the U.S. dollar would have caused a change in equity of € 21.5 million, € 0.0 million and € 60.5 million, respectively.
The corresponding net foreign exchange rate risk from expected and recognized transactions for 2011 was as follows:
€ million as of Dec. 31, 2011 CHF JPY TWD USD
Foreign exchange risk from balance sheet items –119.0 191.0 62.4 2,462.3
Foreign exchange risk from contingent business and expected transactions in 2012 –471.7 322.0 459.0 843.5Transaction-related foreign exchange position –590.7 513.0 521.4 3,305.8Position hedged by derivatives 201.4 –437.4 –203.9 –2,991.0Open-end foreign exchange risk position –389.3 75.6 317.5 314.7
Change in foreign exchange position due to a 10% appreciation of the euro 38.9 –7.6 –31.7 –31.5included in profit / loss –4.7 2.3 0.1 1.8recognized in equity –3.5 22.3 14.0 51.1
In addition to the previously described transaction risks, the Merck Group is also exposed to currency translation risks since many Merck companies are located outside the eurozone. The financial statements of these companies are translated into euros. Exchange differences in the assets and liabilities of these companies resulting from currency translation are recognized in equity.
Interest rate risksInterest rate risks related mainly to financial liabilities of € 4,453.5 million (2011: € 5,539.3 million) and monetary deposits of € 2,624.7 million (2011: € 2,115.2 million). The aim is to optimize the interest result and to minimize interest rate risks. If necessary, derivative financial instruments are used to change variable interest payments into fixed interest payments.
Relative to net interest liabilities on the balance sheet date, owing to the large proportion of fixed-interest financial instruments, a parallel shift in interest rates by +100 or –100 basis points would not have a material effect. Assuming a refinancing as well as reinvestment of the same amount for the transactions expiring in 2013, a parallel shift in the interest rate curve by + 100 basis points would lead to income of € 12.5 million (2011: € 10.3 million). A parallel shift in interest rates by –100 basis points would lead to an expense of € 9.6 million (2011: € 9.7 million). This corresponds to a change in interest income of € 14.1 million (2011: € 15.7 million) or € –11.2 million (2011: € –14.8 million) on financial assets and additional interest expense of € 1.6 million (2011: € 5.4 million) or a decline in interest expense of € 1.6 million (2011: € 5.1 million) on financial liabilities. The resulting change in assets and derivative financial instruments measured at fair value would increase equity by € 31.6 million (2011: increase by € 51.3 million) or lower it by € 41.5 million (2011: lowered by € 52.9 million). The scenario calculations here assumed that the interest rate cannot fall below 0%.
187
Other disclosures
Merck 2012Consolidated Financial Statements
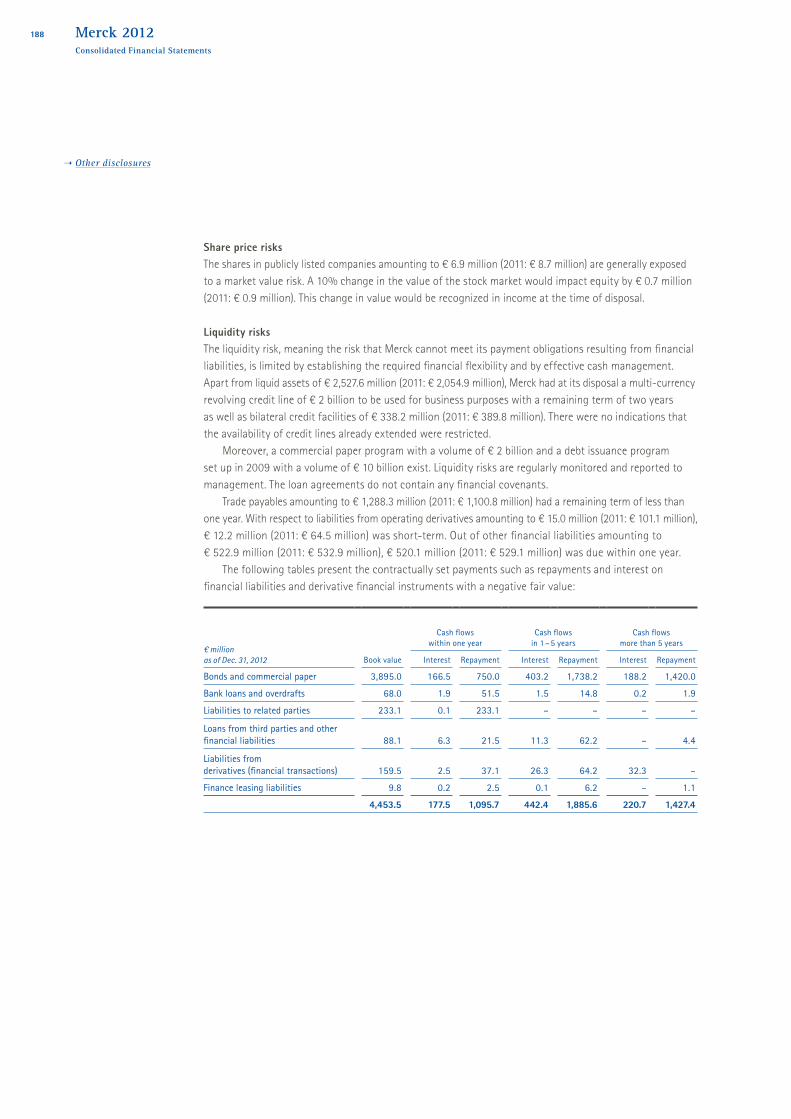
Share price risksThe shares in publicly listed companies amounting to € 6.9 million (2011: € 8.7 million) are generally exposed to a market value risk. A 10% change in the value of the stock market would impact equity by € 0.7 million (2011: € 0.9 million). This change in value would be recognized in income at the time of disposal.
Liquidity risksThe liquidity risk, meaning the risk that Merck cannot meet its payment obligations resulting from financial liabilities, is limited by establishing the required financial flexibility and by effective cash management. Apart from liquid assets of € 2,527.6 million (2011: € 2,054.9 million), Merck had at its disposal a multi-currency revolving credit line of € 2 billion to be used for business purposes with a remaining term of two years as well as bilateral credit facilities of € 338.2 million (2011: € 389.8 million). There were no indications that the availability of credit lines already extended were restricted.
Moreover, a commercial paper program with a volume of € 2 billion and a debt issuance program set up in 2009 with a volume of € 10 billion exist. Liquidity risks are regularly monitored and reported to management. The loan agreements do not contain any financial covenants.
Trade payables amounting to € 1,288.3 million (2011: € 1,100.8 million) had a remaining term of less than one year. With respect to liabilities from operating derivatives amounting to € 15.0 million (2011: € 101.1 million), € 12.2 million (2011: € 64.5 million) was short-term. Out of other financial liabilities amounting to € 522.9 million (2011: € 532.9 million), € 520.1 million (2011: € 529.1 million) was due within one year.
The following tables present the contractually set payments such as repayments and interest on financial liabilities and derivative financial instruments with a negative fair value:
€ million as of Dec. 31, 2012
Cash flows within one year
Cash flows in 1 – 5 years
Cash flows more than 5 years
Book value Interest Repayment Interest Repayment Interest Repayment
Bonds and commercial paper 3,895.0 166.5 750.0 403.2 1,738.2 188.2 1,420.0Bank loans and overdrafts 68.0 1.9 51.5 1.5 14.8 0.2 1.9Liabilities to related parties 233.1 0.1 233.1 – – – –
Loans from third parties and other financial liabilities 88.1 6.3 21.5 11.3 62.2 – 4.4
Liabilities from derivatives (financial transactions) 159.5 2.5 37.1 26.3 64.2 32.3 –Finance leasing liabilities 9.8 0.2 2.5 0.1 6.2 – 1.1
4,453.5 177.5 1,095.7 442.4 1,885.6 220.7 1,427.4
188
Other disclosures
Merck 2012Consolidated Financial Statements
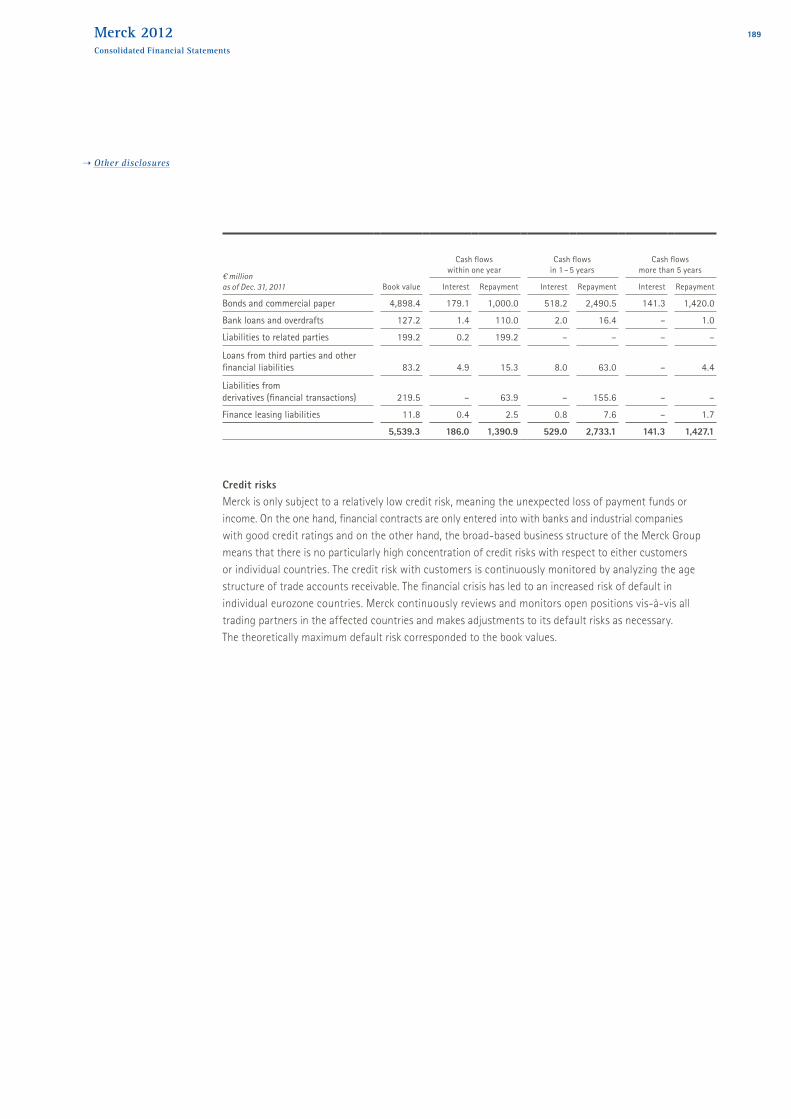
€ million as of Dec. 31, 2011
Cash flows within one year
Cash flows in 1 – 5 years
Cash flows more than 5 years
Book value Interest Repayment Interest Repayment Interest Repayment
Bonds and commercial paper 4,898.4 179.1 1,000.0 518.2 2,490.5 141.3 1,420.0Bank loans and overdrafts 127.2 1.4 110.0 2.0 16.4 – 1.0Liabilities to related parties 199.2 0.2 199.2 – – – –
Loans from third parties and other financial liabilities 83.2 4.9 15.3 8.0 63.0 – 4.4
Liabilities from derivatives (financial transactions) 219.5 – 63.9 – 155.6 – –Finance leasing liabilities 11.8 0.4 2.5 0.8 7.6 – 1.7
5,539.3 186.0 1,390.9 529.0 2,733.1 141.3 1,427.1
Credit risksMerck is only subject to a relatively low credit risk, meaning the unexpected loss of payment funds or income. On the one hand, financial contracts are only entered into with banks and industrial companies with good credit ratings and on the other hand, the broad-based business structure of the Merck Group means that there is no particularly high concentration of credit risks with respect to either customers or individual countries. The credit risk with customers is continuously monitored by analyzing the age structure of trade accounts receivable. The financial crisis has led to an increased risk of default in individual euro zone countries. Merck continuously reviews and monitors open positions vis-à-vis all trading partners in the affected countries and makes adjustments to its default risks as necessary. The theoretically maximum default risk corresponded to the book values.
189
Other disclosures
Merck 2012Consolidated Financial Statements

( 61 ) Other disclosures on financial instrumentsThe following table presents the reconciliation of the balance sheet items to the classes of financial instruments in accordance with IFRS 7:
€ million Book value
Dec. 31, 2012
Subsequent measurement according to IAS 39
Non-financial items
Fair value Dec. 31, 2012
Book value Dec. 31, 2011
Subsequent measurement according to IAS 39
Non-financial items
Fair value Dec. 31, 2011
Amortized cost At cost Fair value
Carrying value accord- ing to IAS 17 Amortized cost At cost Fair value
Carrying value according to
IAS 17
AssetsCash and cash equivalents 729.7 729.7 – – – – 729.7 937.8 937.8 – – – – 937.8Current financial assets 1,797.9 549.7 – 1,248.2 – – 1,117.1 787.3 – 329.8 – –
Held for trading (non-derivatives) – – – – – – – – – – – – – –Non-hedging derivatives 7.8 – – 7.8 – – 7.8 6.4 – – 6.4 – – 6.4Held to maturity 349.7 349.7 – – – – 349.7 27.3 27.3 – – – – 27.3Loans and receivables 200.0 200.0 – – – – 200.3 760.0 760.0 – – – – 760.0Available-for-sale 1,230.1 – – 1,230.1 – – 1,230.1 307.9 – – 307.9 – – 307.9Hedging derivatives 10.3 – – 10.3 – – 10.3 15.5 – – 15.5 – – 15.5
Trade receivables 2,114.6 2,114.6 – – – – 2,328.3 2,328.3 – – – –Loans and receivables 2,114.6 2,114.6 – – – – 2,114.6 2,328.3 2,328.3 – – – – 2,328.3
Current and non-current other assets 346.9 88.8 – 55.3 – 202.8 306.91 90.6 – 2.6 – 213.71
Non-hedging derivatives 2.7 – – 2.7 – – 2.7 0.6 – – 0.6 – – 0.6Loans and receivables 88.8 88.8 – – – – 88.8 90.6 90.6 – – – – 90.6Hedging derivatives 52.6 – – 52.6 – – 52.6 2.0 – – 2.0 – – 2.0Non-financial items 202.8 – – – – 202.8 213.71 – – – – 213.71
Non-current financial assets 97.1 48.0 41.8 7.3 – – 60.3 18.6 32.6 9.1 – –Non-hedging derivatives – – – – – – – – – – – – – –Held to maturity 30.0 30.0 – – – – 30.0 – – – – – – –Loans and receivables 18.0 18.0 – – – – 18.0 18.6 18.6 – – – – 18.6Available-for-sale 48.7 – 41.8 6.9 – – 48.7 41.3 – 32.6 8.7 – – 41.3Hedging derivatives 0.4 – – 0.4 – – 0.4 0.4 – – 0.4 – – 0.4
LiabilitiesCurrent and non-current financial liabilities 4,453.5 4,284.2 – 159.5 9.8 – 5,539.3 5,308.0 – 219.5 11.8 –
Non-hedging derivatives 4.7 – – 4.7 – – 4.7 27.8 – – 27.8 – – 27.8Other liabilities 4,284.2 4,284.2 – – – – 4,715.7 5,308.0 5,308.0 – – – – 5,548.1Hedging derivatives 154.8 – – 154.8 – – 154.8 191.7 – – 191.7 – – 191.7Finance lease 9.8 – – – 9.8 – 9.8 11.8 – – – 11.8 – 11.8
Trade accounts payable 1,288.3 1,288.3 – – – – 1,100.8 1,100.8 – – – –Other liabilities 1,288.3 1,288.3 – – – – 1,288.3 1,100.8 1,100.8 – – – – 1,100.8
Current and non-current other liabilities 1,105.6 522.9 – 15.0 – 567.7 1,145.7 532.9 – 101.1 – 511.7Non-hedging derivatives 0.4 – – 0.4 – – 0.4 3.6 – – 3.6 – – 3.6Other liabilities 522.9 522.9 – – – – 522.9 532.9 532.9 – – – – 532.9Hedging derivatives 14.6 – – 14.6 – – 14.6 97.5 – – 97.5 – – 97.5Non-financial items 567.7 – – – – 567.7 511.7 – – – – 511.7
The fair values of derivatives stated here do not include accrued interest (clean price). 1 Previous year’s figures have been adjusted, see Note [5]
190
Other disclosures
Merck 2012Consolidated Financial Statements

€ million Book value
Dec. 31, 2012
Subsequent measurement according to IAS 39
Non-financial items
Fair value Dec. 31, 2012
Book value Dec. 31, 2011
Subsequent measurement according to IAS 39
Non-financial items
Fair value Dec. 31, 2011
Amortized cost At cost Fair value
Carrying value accord- ing to IAS 17 Amortized cost At cost Fair value
Carrying value according to
IAS 17
AssetsCash and cash equivalents 729.7 729.7 – – – – 729.7 937.8 937.8 – – – – 937.8Current financial assets 1,797.9 549.7 – 1,248.2 – – 1,117.1 787.3 – 329.8 – –
Held for trading (non-derivatives) – – – – – – – – – – – – – –Non-hedging derivatives 7.8 – – 7.8 – – 7.8 6.4 – – 6.4 – – 6.4Held to maturity 349.7 349.7 – – – – 349.7 27.3 27.3 – – – – 27.3Loans and receivables 200.0 200.0 – – – – 200.3 760.0 760.0 – – – – 760.0Available-for-sale 1,230.1 – – 1,230.1 – – 1,230.1 307.9 – – 307.9 – – 307.9Hedging derivatives 10.3 – – 10.3 – – 10.3 15.5 – – 15.5 – – 15.5
Trade receivables 2,114.6 2,114.6 – – – – 2,328.3 2,328.3 – – – –Loans and receivables 2,114.6 2,114.6 – – – – 2,114.6 2,328.3 2,328.3 – – – – 2,328.3
Current and non-current other assets 346.9 88.8 – 55.3 – 202.8 306.91 90.6 – 2.6 – 213.71
Non-hedging derivatives 2.7 – – 2.7 – – 2.7 0.6 – – 0.6 – – 0.6Loans and receivables 88.8 88.8 – – – – 88.8 90.6 90.6 – – – – 90.6Hedging derivatives 52.6 – – 52.6 – – 52.6 2.0 – – 2.0 – – 2.0Non-financial items 202.8 – – – – 202.8 213.71 – – – – 213.71
Non-current financial assets 97.1 48.0 41.8 7.3 – – 60.3 18.6 32.6 9.1 – –Non-hedging derivatives – – – – – – – – – – – – – –Held to maturity 30.0 30.0 – – – – 30.0 – – – – – – –Loans and receivables 18.0 18.0 – – – – 18.0 18.6 18.6 – – – – 18.6Available-for-sale 48.7 – 41.8 6.9 – – 48.7 41.3 – 32.6 8.7 – – 41.3Hedging derivatives 0.4 – – 0.4 – – 0.4 0.4 – – 0.4 – – 0.4
LiabilitiesCurrent and non-current financial liabilities 4,453.5 4,284.2 – 159.5 9.8 – 5,539.3 5,308.0 – 219.5 11.8 –
Non-hedging derivatives 4.7 – – 4.7 – – 4.7 27.8 – – 27.8 – – 27.8Other liabilities 4,284.2 4,284.2 – – – – 4,715.7 5,308.0 5,308.0 – – – – 5,548.1Hedging derivatives 154.8 – – 154.8 – – 154.8 191.7 – – 191.7 – – 191.7Finance lease 9.8 – – – 9.8 – 9.8 11.8 – – – 11.8 – 11.8
Trade accounts payable 1,288.3 1,288.3 – – – – 1,100.8 1,100.8 – – – –Other liabilities 1,288.3 1,288.3 – – – – 1,288.3 1,100.8 1,100.8 – – – – 1,100.8
Current and non-current other liabilities 1,105.6 522.9 – 15.0 – 567.7 1,145.7 532.9 – 101.1 – 511.7Non-hedging derivatives 0.4 – – 0.4 – – 0.4 3.6 – – 3.6 – – 3.6Other liabilities 522.9 522.9 – – – – 522.9 532.9 532.9 – – – – 532.9Hedging derivatives 14.6 – – 14.6 – – 14.6 97.5 – – 97.5 – – 97.5Non-financial items 567.7 – – – – 567.7 511.7 – – – – 511.7
The fair values of derivatives stated here do not include accrued interest (clean price). 1 Previous year’s figures have been adjusted, see Note [5]
191
Other disclosures
Merck 2012Consolidated Financial Statements

The net result of financial instruments mainly includes measurement results from currency translation, fair value adjustments, write-downs and write-ups as well as the recognition of premiums and discounts. Divi-dends and interest are not recognized in the net result of financial instruments, except for in the category “held for trading.” At Merck, the category “held for trading” only includes derivatives that are not hedged.
The net results of financial instruments by category were as follows:
Interest
Net results
2012 € million Write-downs Write-upsFair value
adjustmentsDisposal
gains / losses
Financial instrument of the categoryHeld for trading – – – 44.4 –Held to maturity 10.5 – – – –Loans and receivables 7.9 –69.9 42.4 – –Available-for-sale 11.4 –5.1 20.8 – 0.3Other liabilities –195.3 – – – –
Interest
Net results
2011 € million Write-downs Write-upsFair value
adjustmentsDisposal
gains / losses
Financial instrument of the categoryHeld for trading – – – –57.5 –Held to maturity 4.7 – – – –0.8Loans and receivables 37.5 –123.7 9.2 – –Available-for-sale 9.5 –38.3 0.9 – 26.9Other liabilities –209.2 – – – –
In 2012, foreign exchange losses of € 60.4 million resulting from receivables and payables in operating business, their economic hedging, as well as hedging of planned transactions in operating business were recorded (2011: gains of € 12.3 million). Foreign exchange gains of € 11.2 million resulting from financial balance sheet items, their economic hedging as well as fair value fluctuations of option contracts to hedge planned transactions were recorded (2011: losses of € 30.4 million).
192
Other disclosures
Merck 2012Consolidated Financial Statements

The fair value of financial assets is based on the official market prices and market values quoted on the balance sheet date (Level 1 assets) as well as mathematical calculation models with inputs observable in the market on the balance sheet date. Level 1 assets comprise stocks and bonds and are classified as “available-for-sale”. Level 2 assets are primarily interest-bearing securities classified as “available-for-sale” as well as hedging and non-hedging derivatives. The fair value of interest-bearing securities is determined by discounting future cash flows using market interest rates. The fair value measurement of forward exchange contracts and currency options uses spot and forward rates as well as foreign exchange volatilities applying recognized mathematical principles. The fair value of interest rate swaps is determined with standard market valuation models using interest rate curves available in the market.
The fair values of the financial instruments disclosed in our balance sheet were determined as follows:
€ million as of Dec. 31, 2012 Assets Liabilities
Fair value determined by official prices and quoted market values (Level 1) 818.3 –thereof available-for-sale 818.3 –
Fair value determined using inputs observable in the market (Level 2) 492.5 –174.5thereof available-for-sale 418.7 –thereof hedging derivatives 63.3 –169.4thereof non-hedging derivatives 10.5 –5.1
Fair value determined using inputs unobservable in the market (Level 3) – –
€ million as of Dec. 31, 2011 Assets Liabilities
Fair value determined by official prices and quoted market values (Level 1) 58.4 –thereof available-for-sale 58.4 –
Fair value determined using inputs observable in the market (Level 2) 283.1 –320.6thereof available-for-sale 258.2 –thereof hedging derivatives 17.9 –289.2thereof non-hedging derivatives 7.0 –31.4
Fair value determined using inputs unobservable in the market (Level 3) – –
193
Other disclosures
Merck 2012Consolidated Financial Statements

( 62 ) Capital managementThe objective of capital management is to secure the financial flexibility in order to maintain long-term business operations and to realize strategic options. Maintaining a stable investment grade rating, ensuring liquidity, limiting financial risks as well as optimizing the costs of capital are the objectives of our financial policy and set important framework conditions for capital management. Traditionally, the capital market has represented a major source of financing for Merck, for instance via bond issues. In addition, Merck has both a commercial paper program for short-term financing on the capital market as well as a syndicated credit facility of € 2 billion with a term of until October 2014.
The responsible committees decide on the capital structure of the balance sheet, the appropriation of net retained profit and the dividend level.
In this context, net financial debt is one of the leading capital management indicators. It was as follows:
€ million Dec. 31, 2012 Dec. 31, 2011 Change
Financial liabilities 4,453.5 5,539.3 –1,085.8less
Cash and cash equivalents 729.7 937.8 –208.1Current financial assets 1,797.9 1,117.1 680.8Net financial debt 1,925.9 3,484.4 –1,558.5
( 63 ) Contingent liabilities
€ million Dec. 31, 2012thereof
affiliates Dec. 31, 2011thereof
affiliates
Guarantees 17.3 – 101.0 –Warranties 0.8 – 0.7 –Other contingent liabilities 87.8 – 43.4 –
Other contingent liabilities included, among other things, potential obligations from legal disputes, for which the probability of an outflow of resources did not suffice to recognize a provision as of the balance sheet date.
194
Other disclosures
Merck 2012Consolidated Financial Statements

( 64 ) Other financial obligationsOther financial obligations comprised the following:
€ million Dec. 31, 2012thereof
affiliates Dec. 31, 2011thereof
affiliates
Obligations to acquire intangible assets 1,670.7 – 950.5 –Obligations to acquire property, plant and equipment 111.8 – 84.9 –Future operating lease payments 207.9 – 178.3 –Long-term purchase commitments 186.5 – 281.4 –Other financial obligations 14.8 – 19.1 –
2,191.7 – 1,514.2 –
Obligations to acquire intangible assets existed in particular within the scope of research and development collaborations. Here Merck has obligations to make milestone payments when its partner achieves certain objectives. In the unlikely event that all contract partners achieve all milestones, Merck would be obligated to pay up to € 1,670.7 million (2011: € 950.5 million) for the acquisition of intangible assets. The increase in obligations to acquire intangible assets resulted mainly from in-licensing agreements within the scope of two development projects in the Merck Serono division.
Our expectations regarding the potential maturities of these obligations were as follows:
€ million Dec. 31, 2012 Dec. 31, 2011
Obligations to acquire intangible assetswithin one year 140.3 42.6in 1 – 5 years 308.9 120.2more than 5 years 1,221.5 787.7
1,670.7 950.5
Other financial obligations are recognized at nominal value.
195
Other disclosures
Merck 2012Consolidated Financial Statements

The maturities of liabilities from lease agreements were as follows:
€ million as of Dec. 31, 2012 within 1 year
1 – 5 years
more than 5 years Total
Present value of future payments from finance leases 2.5 6.2 1.1 9.8Interest component of finance leases 0.2 0.1 – 0.3Future finance lease payments 2.7 6.3 1.1 10.1
Future operating lease payments 72.0 126.9 9.0 207.9
€ million as of Dec. 31, 2011 within 1 year
1 - 5 years
more than 5 years Total
Present value of future payments from finance leases 2.5 7.6 1.7 11.8Interest component of finance leases 0.4 0.8 – 1.2Future finance lease payments 2.9 8.4 1.7 13.0
Future operating lease payments 50.7 104.9 22.7 178.3
Operating lease agreements related mainly to market-usual leasing arrangements to lease operating and office equipment. The payments resulting from operating lease agreements amounted to € 102.6 million (2011: € 75.6 million) and were recorded as an expense in the reporting period.
( 65 ) Personnel expenses/HeadcountPersonnel expenses comprised the following:
€ million 2012 2011
Wages and salaries 3,007.2 2,458.7Compulsory social security contributions and special financial assistance 398.3 347.4Pension expenses 159.0 167.6
3,564.5 2,973.7
The increase in personnel expenses was primarily due to the efficiency enhancement and cost reduction program “Fit for 2018” and the related expenses for severance pay and partial retirement packages. In 2012, wages and salaries included severance pay amounting to € 381.6 million, which is to be seen mainly in this context.
As of December 31, 2012, the Merck Group had 38,847 employees (2011: 40,676). The average number of employees during the year was 39,939 (2011: 40,570).
196
Other disclosures
Merck 2012Consolidated Financial Statements

The maturities of liabilities from lease agreements were as follows:
€ million as of Dec. 31, 2012 within 1 year
1 – 5 years
more than 5 years Total
Present value of future payments from finance leases 2.5 6.2 1.1 9.8Interest component of finance leases 0.2 0.1 – 0.3Future finance lease payments 2.7 6.3 1.1 10.1
Future operating lease payments 72.0 126.9 9.0 207.9
€ million as of Dec. 31, 2011 within 1 year
1 - 5 years
more than 5 years Total
Present value of future payments from finance leases 2.5 7.6 1.7 11.8Interest component of finance leases 0.4 0.8 – 1.2Future finance lease payments 2.9 8.4 1.7 13.0
Future operating lease payments 50.7 104.9 22.7 178.3
Operating lease agreements related mainly to market-usual leasing arrangements to lease operating and office equipment. The payments resulting from operating lease agreements amounted to € 102.6 million (2011: € 75.6 million) and were recorded as an expense in the reporting period.
( 65 ) Personnel expenses/HeadcountPersonnel expenses comprised the following:
€ million 2012 2011
Wages and salaries 3,007.2 2,458.7Compulsory social security contributions and special financial assistance 398.3 347.4Pension expenses 159.0 167.6
3,564.5 2,973.7
The increase in personnel expenses was primarily due to the efficiency enhancement and cost reduction program “Fit for 2018” and the related expenses for severance pay and partial retirement packages. In 2012, wages and salaries included severance pay amounting to € 381.6 million, which is to be seen mainly in this context.
As of December 31, 2012, the Merck Group had 38,847 employees (2011: 40,676). The average number of employees during the year was 39,939 (2011: 40,570).
The breakdown of personnel by function was as follows:
Average number of employees 2012 2011
Production 9,486 9,317Logistics 1,665 2,054Marketing and Sales 12,353 12,322Administration 4,416 4,696Research & Development 4,558 4,632Infrastructure and Other 7,461 7,549
39,939 40,570
( 66 ) Material costsMaterial costs in 2012 amounted to € 1,496.4 million (2011: € 1,452.7 million) and was reported under cost of sales.
( 67 ) Auditors’ feesThe costs of the auditors (KPMG) of the financial statements of the Merck Group consisted of the following:
€ million
2012 2011
Merck Group
thereof KPMG
Germany Merck Group
thereof KPMG
Germany
Audits of financial statements 5.4 1.4 7.2 1.7Other audit-related services 0.6 0.2 0.1 –Tax consultancy services 0.4 0.3 0.5 0.2Other services 0.2 – 0.7 0.3
6.6 1.9 8.5 2.2
( 68 ) Corporate governanceThe Statement of Compliance in accordance with section 161 of the German Stock Corporation Act (Aktiengesetz) was published in the corporate governance section of our website www.merckgroup.com/investors Corporate Governance in February 2012 and thus made permanently available.
( 69 ) Companies opting for exemption under section 264 (3) HGB or section 264b HGBThe following companies, which have been consolidated in these financial statements, have opted for exemption of the German Commercial Code (HGB):Allergopharma GmbH & Co. KG, ReinbekChemische Fabrik Lehrte Dr. Andreas Kossel GmbH, Lehrte Heipha Dr. Müller Gmbh, EppelheimMerck Export GmbH, DarmstadtMerck Selbstmedikation GmbH, Darmstadt Merck Shared Services Europe GmbH, DarmstadtMerck Serono GmbH, Darmstadt
197
Other disclosures
Merck 2012Consolidated Financial Statements

( 70 ) Related-party disclosuresRelated parties in respect of the Merck Group are E. Merck KG as well as Emanuel- Merck-Vermögens-KG and E. Merck Beteiligungen KG. In principle, direct or indirect subsidiaries of Merck KGaA, associates and joint ventures of the Merck Group as well as pension funds that are classified as funded defined benefit plans in accordance with IAS 19 are also related parties within the meaning of IAS 24. Members of the Executive Board and the Supervisory Board of Merck KGaA, the Executive Board and the Board of Partners of E. Merck KG as well as close members of their families are also related parties.
As of December 31, 2012, there were liabilities by Merck KGaA, Merck Financial Services GmbH and Merck & Cie, Altdorf, to E. Merck KG in the amount of € 528.1 million (2011: € 518.5 million) as well as by Merck Financial Services GmbH to Merck Capital Asset Management, Malta, and Merck Capital Asset Management Holding, Malta, amounting to € 0.3 million (2011: € 0.0 million) and € 0.1 million (2011: € 0.0 million), respectively. In addition, as of December 31, 2012, Merck KGaA had receivables from E. Merck Beteiligungen KG in the amount of € 5.4 million (2011: € 6.1 million) and from E. Merck KG in the amount of € 0.0 million (2011: € 0.1 million). The balances result mainly from the profit transfers by Merck & Cie to E. Merck KG as well as the reciprocal profit transfers between Merck KGaA and E. Merck KG. They included financial payables of € 233.1 million (2011: € 199.2 million) which were subject to standard market interest rates.
From January to December 2012, Merck KGaA performed services for E. Merck KG with a value of € 1.2 million (2011: € 1.1 million), for E. Merck Beteiligungen KG with a value of € 0.3 million (2011: € 0.0 million), and for Emanuel-Merck-Vermögens-KG with a value of € 0.3 million (2011: € 0.2 million). During the same period, E. Merck KG performed services for Merck KGaA with a value of € 0.5 million (2011: € 0.5 million).
Business transactions with major subsidiaries were eliminated during consolidation. Information on pension funds that are classified as funded defined benefit plans in accordance with IAS 19 can be found under Note [51]. There were no further material transactions with these pension funds.
From January to December 2012, there were no transactions between companies of the Merck Group and associates (2011: goods with a value of € 2.3 million were supplied to associates). As in the previous year, companies of the Merck Group had no receivables vis-à-vis associates as of December 31, 2012.
There were no additional material transactions such as, for example, the provision of services or the granting of loans, between companies of the Merck Group and members of the Executive Board and the Supervisory Board of Merck KGaA, the Executive Board and the Board of Partners of E. Merck KG or members of their immediate families.
198
Other disclosures
Merck 2012Consolidated Financial Statements

( 71 ) Executive Board and Supervisory Board compensationThe compensation of the Executive Board of Merck KGaA is paid by the general partner, E. Merck KG, and recorded as an expense in its income statement. For January to December 2012, fixed salaries of € 4.9 million (2011: € 5.5 million), variable compensation of € 11.2 million (2011: € 13.9 million), and additional benefits of € 0.1 million (2011: € 0.1 million) were recorded for members of the Executive Board of Merck KGaA. Further-more, additions to the provisions of E. Merck KG for the Long-Term Incentive Plan totaled € 3.1 million (2011: € 0.0 million), and to the pension provisions of E. Merck KG include current service costs of € 1.9 million (2011: € 1.1 million) for members of the Executive Board of Merck KGaA.
Subject to the approval of the Annual General Meeting on the proposed distribution of a dividend of € 1.70 per share, the compensation of the Supervisory Board amounting to € 694 thousand (2011: € 620 thousand) consists of a fixed portion of € 122.5 thousand (2011: € 122.5 thousand) and a variable portion of € 571.5 thousand (2011: € 497.5 thousand).
Further individualized information and details can be found in the Compensation Report on pages 104 et seq.
( 72 ) Information on preparation and approvalThe Executive Board of Merck KGaA prepared the consolidated financial statements on February 20, 2013 and approved them for forwarding to the Supervisory Board. The Supervisory Board has the responsibility to examine the consolidated financial statements and to declare whether it approves them.
( 73 ) Subsequent eventsSubsequent to the balance sheet date, no further events of special importance occurred that could have a material impact on the financial position and results of operations of the Merck Group.
199
Other disclosures
Merck 2012Consolidated Financial Statements

( 74 ) List of shareholdingsThe following table presents the list of shareholdings of the Merck Group as of December 31, 2012.
Country Company Registered office
Equity interest
(%)
thereof Merck KGaA
(%)
I. Fully consolidated companies
Germany
Germany
Merck KGaA Darmstadt
Parent company
Germany Allergopharma GmbH & Co. KG Reinbek 100.00 Germany Allergopharma Verwaltungs GmbH Darmstadt 100.00 100.00Germany Biochrom AG Berlin 100.00Germany Chemische Fabrik Lehrte Dr. Andreas Kossel GmbH Lehrte 100.00 100.00Germany Chemitra GmbH Darmstadt 100.00 100.00Germany Emedia Export Company mbH Gernsheim 100.00 Germany heipha Dr. Müller GmbH Eppelheim 100.00 100.00
Germany
IHS-Intelligent Healthcare Solutions GmbH
Frankfurt/Main
100.00
Germany Litec-LLL GmbH Greifswald 100.00 100.00Germany Merck Chemicals GmbH Schwalbach 100.00Germany Merck China Chemicals Holding GmbH Darmstadt 100.00 Germany Merck Consumer Health Care Holding GmbH Darmstadt 100.00 100.00Germany Merck Export GmbH Darmstadt 100.00 100.00Germany Merck Financial Services GmbH Darmstadt 100.00 100.00Germany Merck Financial Trading GmbH Gernsheim 100.00 100.00Germany Merck Holding GmbH Gernsheim 100.00 100.00Germany Merck Internationale Beteiligungen GmbH Darmstadt 100.00 Germany Merck Pensions GmbH & Co. KG Zossen 100.00 100.00Germany Merck Schuchardt OHG Hohenbrunn 100.00 100.00Germany Merck Selbstmedikation GmbH Darmstadt 100.00 Germany Merck Serono GmbH Darmstadt 100.00 100.00Germany Merck Shared Services Europe GmbH Darmstadt 100.00 100.00Germany Merck Versicherungsvermittlung GmbH Darmstadt 100.00 100.00Germany Merck Verwaltungsgesellschaft mbH Darmstadt 100.00 100.00
Germany
Merck Vierte Allgemeine Beteiligungsgesellschaft mbH
Gernsheim
100.00
Other European countriesSwitzerland Allergopharma AG Therwil 100.00 Switzerland Ares Trading SA Aubonne 100.00 Switzerland Horizon North SA Geneva 100.00
200
Other disclosures
Merck 2012Consolidated Financial Statements
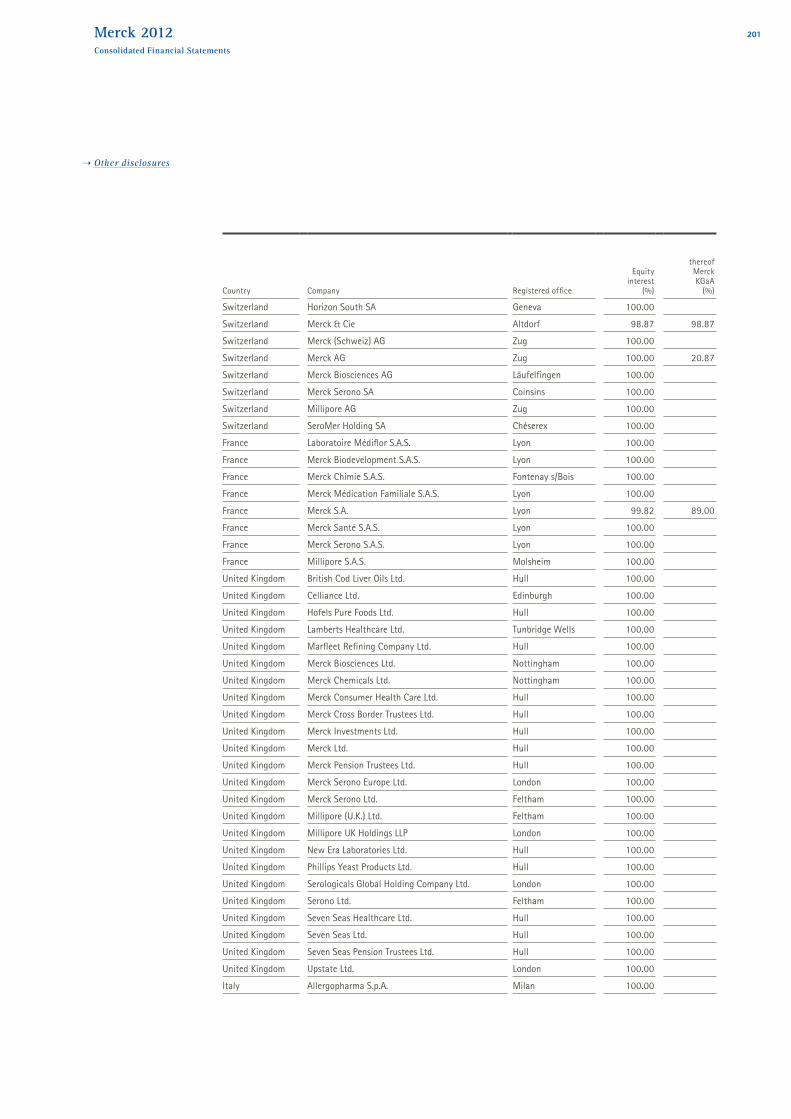
Country Company Registered office
Equity interest
(%)
thereof Merck KGaA
(%)
I. Fully consolidated companies
Germany
Germany
Merck KGaA Darmstadt
Parent company
Germany Allergopharma GmbH & Co. KG Reinbek 100.00 Germany Allergopharma Verwaltungs GmbH Darmstadt 100.00 100.00Germany Biochrom AG Berlin 100.00Germany Chemische Fabrik Lehrte Dr. Andreas Kossel GmbH Lehrte 100.00 100.00Germany Chemitra GmbH Darmstadt 100.00 100.00Germany Emedia Export Company mbH Gernsheim 100.00 Germany heipha Dr. Müller GmbH Eppelheim 100.00 100.00
Germany
IHS-Intelligent Healthcare Solutions GmbH
Frankfurt/Main
100.00
Germany Litec-LLL GmbH Greifswald 100.00 100.00Germany Merck Chemicals GmbH Schwalbach 100.00Germany Merck China Chemicals Holding GmbH Darmstadt 100.00 Germany Merck Consumer Health Care Holding GmbH Darmstadt 100.00 100.00Germany Merck Export GmbH Darmstadt 100.00 100.00Germany Merck Financial Services GmbH Darmstadt 100.00 100.00Germany Merck Financial Trading GmbH Gernsheim 100.00 100.00Germany Merck Holding GmbH Gernsheim 100.00 100.00Germany Merck Internationale Beteiligungen GmbH Darmstadt 100.00 Germany Merck Pensions GmbH & Co. KG Zossen 100.00 100.00Germany Merck Schuchardt OHG Hohenbrunn 100.00 100.00Germany Merck Selbstmedikation GmbH Darmstadt 100.00 Germany Merck Serono GmbH Darmstadt 100.00 100.00Germany Merck Shared Services Europe GmbH Darmstadt 100.00 100.00Germany Merck Versicherungsvermittlung GmbH Darmstadt 100.00 100.00Germany Merck Verwaltungsgesellschaft mbH Darmstadt 100.00 100.00
Germany
Merck Vierte Allgemeine Beteiligungsgesellschaft mbH
Gernsheim
100.00
Other European countriesSwitzerland Allergopharma AG Therwil 100.00 Switzerland Ares Trading SA Aubonne 100.00 Switzerland Horizon North SA Geneva 100.00
Country Company Registered office
Equity interest
(%)
thereof Merck KGaA
(%)
Switzerland Horizon South SA Geneva 100.00 Switzerland Merck & Cie Altdorf 98.87 98.87Switzerland Merck (Schweiz) AG Zug 100.00 Switzerland Merck AG Zug 100.00 20.87Switzerland Merck Biosciences AG Läufelfingen 100.00 Switzerland Merck Serono SA Coinsins 100.00 Switzerland Millipore AG Zug 100.00Switzerland SeroMer Holding SA Chéserex 100.00 France Laboratoire Médiflor S.A.S. Lyon 100.00 France Merck Biodevelopment S.A.S. Lyon 100.00France Merck Chimie S.A.S. Fontenay s/Bois 100.00 France Merck Médication Familiale S.A.S. Lyon 100.00 France Merck S.A. Lyon 99.82 89.00France Merck Santé S.A.S. Lyon 100.00 France Merck Serono S.A.S. Lyon 100.00 France Millipore S.A.S. Molsheim 100.00 United Kingdom British Cod Liver Oils Ltd. Hull 100.00United Kingdom Celliance Ltd. Edinburgh 100.00United Kingdom Hofels Pure Foods Ltd. Hull 100.00United Kingdom Lamberts Healthcare Ltd. Tunbridge Wells 100.00 United Kingdom Marfleet Refining Company Ltd. Hull 100.00United Kingdom Merck Biosciences Ltd. Nottingham 100.00United Kingdom Merck Chemicals Ltd. Nottingham 100.00 United Kingdom Merck Consumer Health Care Ltd. Hull 100.00 United Kingdom Merck Cross Border Trustees Ltd. Hull 100.00United Kingdom Merck Investments Ltd. Hull 100.00United Kingdom Merck Ltd. Hull 100.00United Kingdom Merck Pension Trustees Ltd. Hull 100.00United Kingdom Merck Serono Europe Ltd. London 100.00 United Kingdom Merck Serono Ltd. Feltham 100.00 United Kingdom Millipore (U.K.) Ltd. Feltham 100.00United Kingdom Millipore UK Holdings LLP London 100.00United Kingdom New Era Laboratories Ltd. Hull 100.00United Kingdom Phillips Yeast Products Ltd. Hull 100.00 United Kingdom Serologicals Global Holding Company Ltd. London 100.00United Kingdom Serono Ltd. Feltham 100.00 United Kingdom Seven Seas Healthcare Ltd. Hull 100.00United Kingdom Seven Seas Ltd. Hull 100.00 United Kingdom Seven Seas Pension Trustees Ltd. Hull 100.00United Kingdom Upstate Ltd. London 100.00Italy Allergopharma S.p.A. Milan 100.00
201
Other disclosures
Merck 2012Consolidated Financial Statements

Country Company Registered office
Equity interest
(%)
thereof Merck KGaA
(%)
Italy
Istituto di Ricerche Biomediche Antoine Marxer RBM S.p.A.
Colleretto Giacosa
100.00
Italy Merck S.p.A. Milan 100.00 Italy Merck Serono S.p.A. Rome 99.71 Italy Millipore S.p.A. Milan 100.00Spain Merck, S.L. Madrid 100.00 Spain Millipore Iberica S.A. Madrid 100.00Belgium Merck Consumer Healthcare N.V.-S.A. Overijse 100.00 Belgium Merck N.V.-S.A. Overijse 100.00 Belgium Millipore S.A./N.V. Brussels 100.00Bulgaria Merck Bulgaria EAD Sofia 100.00 Denmark Merck A/S Hellerup 100.00Denmark Millipore A/S Hellerup 100.00Denmark Survac ApS Frederiksberg 100.00 100.00Estonia Merck Serono OÜ Tallinn 100.00 Finland Merck OY Espoo 100.00 Finland Millipore OY Espoo 100.00Greece Merck A.E. Maroussi 100.00 Ireland Merck Millipore Ltd. Carrigtwohill 100.00Ireland Merck Serono (Ireland) Ltd. Dublin 100.00Ireland Millipore Cork Carrigtwohill 100.00Ireland Millipore Dublin International Finance Company Dublin 100.00Ireland Tullagreen Holdings Ltd. Dublin 100.00Croatia Merck d.o.o. Zagreb 100.00 Latvia Merck Serono SIA Riga 100.00 Lithuania Merck Serono, UAB Kaunas 100.00 Luxembourg Merck Re S.A. Luxembourg 100.00 Luxembourg Merck-Finanz AG Luxembourg 100.00 100.00Luxembourg Millilux S.a.r.L. Luxembourg 100.00Luxembourg Millipart S.a.r.L. Luxembourg 100.00Luxembourg Millipore International Holdings, S.a.r.L. Luxembourg 100.00Malta Merck Capital Holding Ltd. St. Julians 100.00 99.92 Malta Merck Capital Ltd. St. Julians 100.00 Netherlands Merck B.V. Schiphol-Rijk 100.00 Netherlands Millipore B.V. Amsterdam Zuidoost 100.00Netherlands Millipore International Holding Company B.V. Amsterdam Zuidoost 100.00Netherlands Millipore Ireland B.V. Roosendaal 100.00Netherlands Serono Tri Holdings B.V. Schiphol-Rijk 100.00 Norway Merck AB, Branch Office Norway Oslo 100.00Norway Millipore AS Oslo 100.00Austria Allergopharma Vertriebsgesellschaft m.b.H. Vienna 100.00
202
Other disclosures
Merck 2012Consolidated Financial Statements

Country Company Registered office
Equity interest
(%)
thereof Merck KGaA
(%)
Austria Arcana Life-Science-Produkte GmbH Vienna 100.00Austria Merck Gesellschaft mbH Vienna 100.00 Austria Merck KGaA & Co. Werk Spittal Spittal 100.00 99.00Austria Millipore Gesellschaft mbH Vienna 100.00Poland Merck Sp.z.o.o. Warsaw 100.00 Portugal Merck, S.A. Lisbon 100.00 Romania Merck Romania S.R.L. Bucharest 100.00 Russia Merck LLC Moscow 100.00 Sweden Merck AB Solna 100.00 Sweden Merck SeQuant AB Umea 100.00 Sweden Millipore AB Solna 100.00Serbia Merck d.o.o. Beograd Belgrade 100.00 Slovakia Merck spol. s.r.o. Bratislava 100.00 Slovenia Merck d.o.o. Ljubljana 100.00 Czech Republic Merck spol.s.r.o. Prague 100.00 Turkey Merck Ilac Ecza ve Kimya Ticaret AS Istanbul 100.00 Hungary Merck Kft. Budapest 100.00
North AmericaUnited States Amnis Corp. Seattle 100.00United States EMD Holding Corp. Rockland 100.00United States EMD Millipore Corp. Billerica 100.00 United States EMD Serono Holding Inc. Rockland 100.00 United States EMD Serono Research Institute, Inc. Billerica 100.00 United States EMD Serono, Inc. Rockland 100.00 United States EMD Shared Services America Corp. Quincy 100.00United States Millipore Asia Ltd. Wilmington 100.00United States Millipore Pacific Ltd. Wilmington 100.00United States Millipore UK Holdings I, LLC Wilmington 100.00United States Millipore UK Holdings II, LLC Wilmington 100.00United States Serono Laboratories Inc. Rockland 100.00Puerto Rico EMD Millipore Corp., Puerto Rico Branch Cidra 100.00Canada EMD Chemicals Canada Inc. Toronto 100.00 Canada EMD Crop BioScience Canada Inc. Toronto 100.00 Canada EMD Inc. Mississauga 100.00 Canada Millipore (Canada) Ltd. Toronto 100.00
Emerging MarketsArgentina Merck Química Argentina S.A.I.C. Buenos Aires 100.00 Brazil Merck S.A. Rio de Janeiro 100.00 Chile Merck S.A. Santiago de Chile 100.00
Country Company Registered office
Equity interest
(%)
thereof Merck KGaA
(%)
Italy
Istituto di Ricerche Biomediche Antoine Marxer RBM S.p.A.
Colleretto Giacosa
100.00
Italy Merck S.p.A. Milan 100.00 Italy Merck Serono S.p.A. Rome 99.71 Italy Millipore S.p.A. Milan 100.00Spain Merck, S.L. Madrid 100.00 Spain Millipore Iberica S.A. Madrid 100.00Belgium Merck Consumer Healthcare N.V.-S.A. Overijse 100.00 Belgium Merck N.V.-S.A. Overijse 100.00 Belgium Millipore S.A./N.V. Brussels 100.00Bulgaria Merck Bulgaria EAD Sofia 100.00 Denmark Merck A/S Hellerup 100.00Denmark Millipore A/S Hellerup 100.00Denmark Survac ApS Frederiksberg 100.00 100.00Estonia Merck Serono OÜ Tallinn 100.00 Finland Merck OY Espoo 100.00 Finland Millipore OY Espoo 100.00Greece Merck A.E. Maroussi 100.00 Ireland Merck Millipore Ltd. Carrigtwohill 100.00Ireland Merck Serono (Ireland) Ltd. Dublin 100.00Ireland Millipore Cork Carrigtwohill 100.00Ireland Millipore Dublin International Finance Company Dublin 100.00Ireland Tullagreen Holdings Ltd. Dublin 100.00Croatia Merck d.o.o. Zagreb 100.00 Latvia Merck Serono SIA Riga 100.00 Lithuania Merck Serono, UAB Kaunas 100.00 Luxembourg Merck Re S.A. Luxembourg 100.00 Luxembourg Merck-Finanz AG Luxembourg 100.00 100.00Luxembourg Millilux S.a.r.L. Luxembourg 100.00Luxembourg Millipart S.a.r.L. Luxembourg 100.00Luxembourg Millipore International Holdings, S.a.r.L. Luxembourg 100.00Malta Merck Capital Holding Ltd. St. Julians 100.00 99.92 Malta Merck Capital Ltd. St. Julians 100.00 Netherlands Merck B.V. Schiphol-Rijk 100.00 Netherlands Millipore B.V. Amsterdam Zuidoost 100.00Netherlands Millipore International Holding Company B.V. Amsterdam Zuidoost 100.00Netherlands Millipore Ireland B.V. Roosendaal 100.00Netherlands Serono Tri Holdings B.V. Schiphol-Rijk 100.00 Norway Merck AB, Branch Office Norway Oslo 100.00Norway Millipore AS Oslo 100.00Austria Allergopharma Vertriebsgesellschaft m.b.H. Vienna 100.00
203
Other disclosures
Merck 2012Consolidated Financial Statements

Country Company Registered office
Equity interest
(%)
thereof Merck KGaA
(%)
Ecuador Merck C.A. Quito 100.00 Guatemala Merck, S.A. Guatemala City 100.00 Colombia Merck S.A. Bogotá 100.00 Mexico Merck, S.A. de C.V. Mexico City 100.00 Mexico Millipore S.A. de C.V. Mexico City 100.00Mexico Serono de Mexico S.A. de C.V. Mexico City 100.00 Panama Mesofarma Corporation Panama City 100.00 Peru Merck Peruana S.A. Lima 100.00 Uruguay ARES Trading Uruguay S.A. Montevideo 100.00 Venezuela Merck S.A. Caracas 100.00 Venezuela Representaciones MEPRO S.A. Caracas 100.00 China Beijing Skywing Technology Co., Ltd. Beijing 100.00China Merck Chemicals (Shanghai) Co., Ltd. Shanghai 100.00
China
Merck Consumer Health Care Shanghai Trading Co., Ltd.
Shanghai
100.00
China Merck Display Materials (Shanghai) Co., Ltd. Shanghai 100.00China Merck Ltd. Hong Kong 100.00 China Merck Millipore Lab Equipment Co., Ltd. Shanghai 100.00China Merck Pharmaceutical (HK) Ltd. Hong Kong 100.00
China
Merck Serono (Beijing) Pharmaceutical R&D Co., Ltd.
Beijing
100.00
China Merck Serono Co., Ltd. Beijing 100.00China Millipore (Shanghai) Trading Co., Ltd. Shanghai 100.00China Millipore China Ltd. Hong Kong 100.00China Suzhou Taizhu Technology Development Co., Ltd. Taicang 100.00 India Merck Ltd. Mumbai 51.80 India Merck Specialities Pvt. Ltd. Mumbai 100.00 India Millipore India Pvt. Ltd. Bangalore 100.00Indonesia P.T. Merck Tbk. Jakarta 86.65 Israel Inter-Lab Ltd. Yavne 100.00 Israel InterPharm Industries Ltd. Yavne 100.00 Israel InterPharm Laboratories Ltd. Yavne 100.00 Israel Merck Serono Ltd. Herzliya Pituach 100.00 Malaysia Merck Sdn Bhd Petaling Jaya 100.00 Malaysia Millipore Asia Ltd., Malaysia Branch Kuala Lumpur 100.00Pakistan Merck (Pvt.) Ltd. Karachi 75.00 26.00Pakistan Merck Pharmaceuticals (Pvt.) Ltd. Karachi 75.00 Pakistan Merck Specialities (Pvt.) Ltd. Karachi 100.00 Philippines Merck Inc. Makati City 100.00 Singapore Merck Pte. Ltd. Singapore 100.00 South Korea Merck Advanced Technologies Ltd. Pyungtaek-shi 100.00 South Korea Merck Ltd. Seoul 100.00
204
Other disclosures
Merck 2012Consolidated Financial Statements

Country Company Registered office
Equity interest
(%)
thereof Merck KGaA
(%)
Taiwan Merck Display Technologies Ltd. Taipei 100.00 Taiwan Merck Ltd. Taipei 100.00 Taiwan Millipore Asia Ltd., Taiwan Branch (in liquidation) Taipei 100.00Thailand Merck Ltd. Bangkok 45.11
United Arab Emirates
Merck Serono Middle East FZ-LLC
Dubai 100.00
Vietnam Merck Vietnam Ltd. Ho Chi Minh City 100.00
Rest of the WorldJapan Merck Ltd. Tokyo 100,00 15.89Japan Merck Serono Co., Ltd. Tokyo 100.00Egypt Merck Ltd. Cairo 100.00 Mauritius Millipore Mauritius Ltd. Cyber City 100.00South Africa Merck (Pty) Ltd. Halfway House 100.00 South Africa Merck Pharmaceutical Manufacturing (Pty) Ltd. Wadeville 100.00 Tunisia Merck Promotion SARL Tunis 100.00 Tunisia Merck SARL Tunis 100.00 Australia Merck Pty. Ltd. Kilsyth 100.00 Australia Merck Serono Australia Pty. Ltd. Sydney 100.00 New Zealand Merck Ltd. Manukau City 100.00
II. Companies not consolidated due to secondary importance
GermanyGermany Merck 12. Allgemeine Beteiligungs GmbH Darmstadt 100.00 100.00Germany Merck 13. Allgemeine Beteiligungs GmbH Darmstadt 100.00Germany Merck 14 Allgemeine Beteiligungs GmbH Darmstadt 100.00Germany Merck Patent GmbH Darmstadt 100.00Germany Merck Pensionsverwaltung GmbH Zossen 100.00 100.00
Germany
Merck Sechste Allgemeine Beteiligungs-gesellschaft mbH
Darmstadt
100.00
Germany
Merck Wohnungs- und Grundstücks - verwaltungsgesellschaft mbH
Darmstadt
100.00 100.00
Other European countriesSwitzerland Asceneuron SA Lausanne 80.00 Switzerland Prexton Therapeutics SA Plan-les Ouates 49.00France Financière du 8ème S.A.S. Lyon 100.00France Gonnon S.A.S. Lyon 100.00 United Kingdom Merck Services U.K. Ltd. Hull 100.00 United Kingdom Merck UK Limited Partnership Poole 100.00
Country Company Registered office
Equity interest
(%)
thereof Merck KGaA
(%)
Ecuador Merck C.A. Quito 100.00 Guatemala Merck, S.A. Guatemala City 100.00 Colombia Merck S.A. Bogotá 100.00 Mexico Merck, S.A. de C.V. Mexico City 100.00 Mexico Millipore S.A. de C.V. Mexico City 100.00Mexico Serono de Mexico S.A. de C.V. Mexico City 100.00 Panama Mesofarma Corporation Panama City 100.00 Peru Merck Peruana S.A. Lima 100.00 Uruguay ARES Trading Uruguay S.A. Montevideo 100.00 Venezuela Merck S.A. Caracas 100.00 Venezuela Representaciones MEPRO S.A. Caracas 100.00 China Beijing Skywing Technology Co., Ltd. Beijing 100.00China Merck Chemicals (Shanghai) Co., Ltd. Shanghai 100.00
China
Merck Consumer Health Care Shanghai Trading Co., Ltd.
Shanghai
100.00
China Merck Display Materials (Shanghai) Co., Ltd. Shanghai 100.00China Merck Ltd. Hong Kong 100.00 China Merck Millipore Lab Equipment Co., Ltd. Shanghai 100.00China Merck Pharmaceutical (HK) Ltd. Hong Kong 100.00
China
Merck Serono (Beijing) Pharmaceutical R&D Co., Ltd.
Beijing
100.00
China Merck Serono Co., Ltd. Beijing 100.00China Millipore (Shanghai) Trading Co., Ltd. Shanghai 100.00China Millipore China Ltd. Hong Kong 100.00China Suzhou Taizhu Technology Development Co., Ltd. Taicang 100.00 India Merck Ltd. Mumbai 51.80 India Merck Specialities Pvt. Ltd. Mumbai 100.00 India Millipore India Pvt. Ltd. Bangalore 100.00Indonesia P.T. Merck Tbk. Jakarta 86.65 Israel Inter-Lab Ltd. Yavne 100.00 Israel InterPharm Industries Ltd. Yavne 100.00 Israel InterPharm Laboratories Ltd. Yavne 100.00 Israel Merck Serono Ltd. Herzliya Pituach 100.00 Malaysia Merck Sdn Bhd Petaling Jaya 100.00 Malaysia Millipore Asia Ltd., Malaysia Branch Kuala Lumpur 100.00Pakistan Merck (Pvt.) Ltd. Karachi 75.00 26.00Pakistan Merck Pharmaceuticals (Pvt.) Ltd. Karachi 75.00 Pakistan Merck Specialities (Pvt.) Ltd. Karachi 100.00 Philippines Merck Inc. Makati City 100.00 Singapore Merck Pte. Ltd. Singapore 100.00 South Korea Merck Advanced Technologies Ltd. Pyungtaek-shi 100.00 South Korea Merck Ltd. Seoul 100.00
205
Other disclosures
Merck 2012Consolidated Financial Statements

Country Company Registered office
Equity interest
(%)
thereof Merck KGaA
(%)
United Kingdom Nature’s Best Health Products Ltd. Tunbridge Wells 100.00 Netherlands Merck Holding Netherlands B.V. Schiphol-Rijk 100.00 100.00
AustriaEurodrug Chemisch-pharmazeutische Produkte GmbH Vienna 100.00
Austria Merck Vermögensverwaltungs-GmbH Vienna 100.00 Portugal Laquifa Laboratorios S.A. Lisbon 100.00
Emerging MarketsDominican Republic Merck Dominicana, S.R.L. Santo Domingo 100.00 China Beijing Ji Zhon-Sheng Pharmaceutical Co., Ltd. Beijing 100.00Indonesia P. T. Merck Specialities Jakarta 100.00
Rest of the WorldMorocco Merck Maroc S.A.R.L. Casablanca 100.00 South Africa Merck Chemicals (Pty) Ltd. (in liquidation) Modderfontein 100.00 South Africa Serono South Africa Ltd. Johannesburg 100.00 Australia Biochrom Australia Pty. Ltd. Melbourne 100.00Australia Chemicon Australia Pty. Ltd. (in liquidation) Kilsyth 100.00 Australia E. Merck Pty. Ltd. (in liquidation) Kilsyth 100.00Australia Merck Australia Pty. Ltd. Kilsyth 100.00
III. Associates not included at equity due to secondary importance
Other European countriesSwitzerland Vaximm AG Basel 22.76 Netherlands Peer+B.V. Eindhoven 49.99 49.99
Rest of the WorldIsrael Neviah Genomics Ltd. Yavne 56.43 10.89Israel QLight Nanotech Ltd. Jerusalem 40.00
206
Other disclosures
Merck 2012Consolidated Financial Statements

5/5
I
To the best of our knowledge, and in accordance with the applicable reporting principles, the consolidated financial statements of the Merck Group give a true and fair view of the assets, liabilities, financial position and profit or loss of the Group, and the Group management report includes a fair review of the development and performance of the business and the position of the Group, together with a description of the principal opportunities and risks associated with the expected development of the Group.
Darmstadt, February 20, 2013
Responsibility Statement# 05
Stefan Oschmann
Bernd Reckmann
Kai Beckmann
Matthias Zachert
Karl-Ludwig Kley
207Merck 2012Responsibility Statement

5/5
I
Auditor’s Report
We have audited the consolidated financial statements prepared by Merck Kommanditgesellschaft auf Aktien, Darmstadt, comprising the Consolidated Income Statement, the Consolidated Statement of Com-prehensive Income, the Consolidated Balance Sheet, the Consolidated Cash Flow Statement, the Consoli-dated Statement of Changes in Net Equity, and the Notes to the Group accounts, together with the Group Management Report for the business year from January 1 to December 31, 2012. The preparation of the consolidated financial statements and the Group Management Report in accordance with IFRSs, as adopted by the EU, and the additional requirements of German commercial law pursuant to section 315a (1) HGB [Handelsgesetzbuch “German Commercial Code”] and supplementary provisions of the articles of associa-tion are the responsibility of the parent company’s management. Our responsibility is to express an opinion on the consolidated financial statements and on the Group Management Report based on our audit. We conducted our audit of the consolidated financial statements in accordance with § 317 HGB [Handelsgesetzbuch “German Commercial Code“] and German generally accepted standards for the audit of financial statements promulgated by the Institut der Wirtschaftsprüfer [Institute of Public Auditors in Germany] (IDW). Those standards require that we plan and perform the audit such that misstatements materially affecting the presentation of the net assets, financial position and results of operations in the consolidated financial statements in accordance with the applicable financial reporting framework and in the Group Management Report are detected with reasonable assurance. Knowledge of the business activi-ties and the economic and legal environment of the Group and expectations as to possible misstatements are taken into account in the determination of audit procedures. The effectiveness of the accounting-related internal control system and the evidence supporting the disclosures in the consolidated financial statements and the Group Management Report are examined primarily on a test basis within the frame-work of the audit. The audit includes assessing the annual financial statements of those entities included in consolidation, the determination of entities to be included in consolidation, the accounting and consoli-dation principles used and significant estimates made by management, as well as evaluating the overall presentation of the consolidated financial statements and Group Management Report. We believe that our audit provides a reasonable basis for our opinion.
Our audit has not led to any reservations.
In our opinion, based on the findings of our audit, the consolidated financial statements comply with IFRSs, as adopted by the EU, the additional requirements of German commercial law pursuant to section 315a (1) HGB and supplementary provisions of the articles of association and give a true and fair view of the net assets, financial position and results of operations of the Group in accordance with these requirements. The Group Management Report is consistent with the consolidated financial statements and as a whole provides a suitable view of the Group’s position and suitably presents the opportunities and risks of future development.
Frankfurt/Main, February 21, 2013
KPMG AGWirtschaftsprüfungsgesellschaft
Original German version signed byRolf Nonnenmacher Manfred JenalWirtschaftsprüfer Wirtschaftsprüfer
# 06
208 Merck 2012Auditor’s Report

216
209
# 07 More Information
210➝ Glossary215➝ Financial Calendar for 2013216➝ Awards and Recognitions
Merck 2012
Mor
e In
form
atio
n
5/5
I
Glossary
Affiliate A company that is not included in the scope of consolidation due to its minor importance.
Beta-blockers A collective term for similarly acting drugs that act as inverse agonists on the body’s beta receptors and thus inhibit the effect of stress hormones (notably, norepinephrine and epinephrine). They lower the heart rate and blood pressure, decrease the strength of heart beat, and reduce the heart’s excitability.BH4 Abbreviation for tetrahydrobiopterin, a key coenzyme in amino acid metabolism. BH4 lowers the blood phenylalanine levels in patients with BH4-responsive phenylketonuria.Biomarkers The term refers both to substances in the body and cell properties. Biomarkers can help doctors to identify a patient’s disease. Certain genes tend to play a role in the treatment of cancers, in terms of whether they are “normal” (wild type) or have undergone transformation (mutant). A predictive biomarker is a parameter or a status that can help to predict whether a patient’s disease, e.g. cancer, will respond to a certain treatment.Biosimilars A biosimilar medicine is a biological medicine that is developed to be similar to an existing biological medicine (the ‘reference medicine’). Biosimilars are not the same as generics, which have simpler chemical structures and are considered to be identical to their reference medicines. The active substance of a biosimilar and its reference medicine is essentially the same biological substance, though there may be minor differences due to their complex nature and production methods. Like the reference medicine, the biosimilar has a degree of natural variability.
Capital spending ratio Capital spending as a proportion of sales.Cash flow Equals cash receipts minus cash payments over a given period of time.CEFIC European Chemical Industry CouncilCHMP Committee for Medicinal Products for Human Use: a scientific committee of the European Medicines Agency. It prepares the Agency’s opinions and handles the authorization and risk assessment of medicinal products.Commercial paper program A commercial paper program provides the contractual framework for the issuance of commercial paper, which is a short-term debt instrument issued by a corporation.Compliance This term refers to compliance with laws and regulations as well as with voluntary codices that are internal to the Merck Group. Compliance is an element of diligent corporate governance.Corporate governance This term covers compliance with laws and regulations; the application of recognized standards and recommendations; the development of and adherence to internal guidelines; as well as the creation and implementation of guideline and control structures.
DAX ® Deutscher Aktienindex (German stock index): Its value is based on the stock prices of the 30 largest German companies by trading volume and free float market capitalization.Debt issuance program A debt issuance program provides the contractual framework for the issuance of bonds. Thanks to the current terms and conditions, the program allows the company flexibility when issuing bonds.Dividend yield The ratio of the dividend per share to the share price.
A /aB /b
C /c
D /d
210 Merck 2012More Information
Mor
e In
form
atio
n

5/5
I
Earnings per share Earnings per share are calculated as specified in IAS 33 by dividing the Group profit by the weighted average number of shares.EBIT Earnings before interest and taxes on income. Equals the operating result.EBITDA Earnings before interest, taxes, depreciation and amortization: depreciation and amortization are added back to EBIT.EBITDA pre EBITDA before one-time items.EGFR Epidermal Growth Factor Receptor: It is upregulated in various tumor types and/or present in mutated form, resulting in uncontrolled growth and replication of tumor cells. Novel cancer therapies are aimed at blocking EGFR’s oncogenic signal and hence stopping tumor growth.EMA European Medicines Agency: an official body of the European Union, headquartered in London. It is responsible for evaluating and monitoring medicines and plays a key role in the marketing authorization of medicinal products.Equity ratio Indicator that shows equity capital in proportion to total capital, serving to evaluate the financial stability and independence of a company.
FDA Food and Drug Administration: U.S. government agency responsible for protecting and advancing public health, especially as concerns food and drugs.Financial covenants Financial figures stipulated in loan contracts to which the company must adhere during the duration of the loan.First, second and third line therapy First-line therapy is the first therapy that patients receive after having been diagnosed. If they do not respond or cannot tolerate first-line therapy, second-line, or in a further step, third-line therapy follows.FPR technology Film patterned retarder (FPR) technology is used in 3D displays and permits the concurrent presentation of two images. FPR technology can be used not only for liquid crystal, but also LED and OLED displays and cell phones. Reactive mesogens from Merck, i.e. polymerizable liquid crystals, are used in film patterned retarder (FPR) products.Free cash flow Sum of the net cash flow from operating activities minus investments in intangible assets, property, plant and equipment, acquisitions as well as investments in other financial assets, plus proceeds from the disposal of assets and changes in securities.
E /e
F /f
211
Glossary
Merck 2012More Information

5/5
I
GDP Gross domestic product: The total value of all goods (products and services) intended for final consumption that are produced within a country’s borders in a given year.Gearing Ratio of net debt including pension provisions to net equity.GHS Globally Harmonized System of Classification and Labelling of Chemicals. An international standard system to classify chemicals, including labels and safety data sheets.Global Grade Merck is working with the Global Grading System developed by Towers Watson, a market-focused method to evaluate company positions.Goodwill Goodwill arises when a company acquires another company and primarily represents the difference between the fair value of the acquired net assets and the purchase price paid.GPHF Global Pharma Health Fund e.V. is a charitable organization funded by Merck. The organization’s goal is to promote health care within the scope of development assistance, especially with respect to the fight against counterfeit medicines through the use of the GPHF-Minilab ®.GPHF-Minilab ® With the GPHF-Minilab ®, the GPHF offers a unique mobile compact laboratory that is capable of testing the quality of medicines very quickly.Greenhouse Gas Protocol Most widely used accounting and reporting system for greenhouse gas emissions.
Hedging Protection against or limitation of certain clearly identified risks that might result from occurrences such as changes in foreign exchange rates or share prices. Fair value hedge: This primarily involves protecting against potential market value fluctuations of those assets and liabilities already recognized in the balance sheet. The primary purpose of a cash flow hedge is to protect against uncertain cash flows that especially result from future transactions.
ICCA International Council of Chemical Associations.IFRS International Financial Reporting Standards (until 2001 known as International Financial Account-ing Standards, IAS) are the standards that publicly traded companies must apply if their headquarters are domiciled in the European Union.IMF The International Monetary Fund, with headquarters in Washington, D.C., is a United Nations organization.Interest rate swap An interest rate swap is an agreement between two contractual parties to exchange various interest payments. Thus, a company can transform a variable interest item into a fixed interest item and vice-versa.ISO 14001 This international environmental management standard sets globally recognized requirements regarding an environmental management system.
Joint venture This is a joint undertaking in which at least two legal, economically separate enterprises participate.
G /g
H /h
I / i
J / j
212
Glossary
Merck 2012More Information
5/5
I
KRAS A biomarker that can show whether a patient with metastatic colorectal carcinoma is likely to respond to EGFR antibody therapy. This is done by testing the status of the KRAS gene in the tumor to see if it is normal (wild type) or abnormal (mutant). The KRAS acronym stands for Kirsten Rat Sarcoma.
LED A light-emitting diode (LED) is an electronic semiconductor device. When an electric current passes through it in the flow direction, it emits visible light, infrared radiation (IR diode) or ultraviolet radiation (UV diode). The wavelength of this depends on the semiconductor material used and the doping level.Liquid Crystals (LC) These specialty chemicals are used in LC displays (LCD), for example, in flat-panel televisions, notebooks, mobile telephones, etc.LTIR Lost time injury rate: indicator for workplace safety. The number of workplace accidents with one or more days of lost time per million hours worked.Lupus erythematosus (LE) An autoimmune disease linked to inflammatory rheumatic disease and classified as a collagen disease. There are two main types: lupus of the skin, and systemic lupus erythematosus (SLE). It may affect other organ systems apart from the skin and joints, e.g. the kidneys in lupus nephritis (LN).
Marketing and selling ratio Marketing and selling expenses as a proportion of sales.Metafolin ® Biologically active form of folate that occurs naturally in the human body and is utilized better by the body than folic acid. Folic acid and Metafolin ® are important for cell division and blood formation and therefore the development and growth of new life.Monoclonal antibodies Highly specialized targeted antibodies synthesized using biotechnological methods. What makes them special is their ability to activate the body’s natural mechanisms to fight disease. Monoclonal antibodies have mainly been used for cancer treatment and to suppress adverse immune responses.MUC1 Also known as PEM (polymorphic epithelial mucin), MUC1 is a glycoprotein group mucin embedded in cell membranes and occurring in all human organs. The MUC1 mucin is an established tumor marker. In oncology, this tumor marker is the starting point for several new cancer therapies.Multi-currency credit facility A contract between a company and a bank (or several banks) under which the bank gives the company the possibility to access a predefined amount of money at certain conditions. Depending on the agreement, payment can be made in different currencies.
OECD Organization for Economic Co-operation and Development, with headquarters in Paris, is a forum of 34 countries committed to the principles of democracy and market economy.OLED Organic light-emitting diodes. New technology for displays and lighting used, for example, in mobile telephones, MP3 players, and since recently also in televisions and lamps.Organic growth Organic growth is the part of a company’s growth that is not derived from acquisitions or currency effects.OTC Over-the-counter drugs is the term used for pharmaceuticals that are available at stores and pharmacies without a prescription.
K / l
L / l
M /m
O /o
213
Glossary
Merck 2012More Information
5/5
I
Progression-free survival In oncology, the amount of time between a patient’s enrollment in a clinical trial and disease progression or the patient’s death.Provisions/reserves Provisions are set aside for liabilities whose amount or maturity are uncertain. Reserves, on the other hand, are part of a company’s equity.PS-VA Polymer-stabilized vertical alignment: A polymer layer pre-aligns the molecules inside the display in a certain direction. In the black state, the liquid crystals are not exactly vertical, but slightly tilted: This allows the liquid crystals to switch more quickly. The light transmittance of the display is significantly higher, thus reducing the backlighting, one of the most costly components to produce.Purchase price allocation The purchase price allocation allows a company’s acquisition costs (purchase price) to be assigned to the tangible and intangible assets and liabilities that were acquired with it.
Randomized study In medical research, randomization refers to the random assignment of subjects to treatment groups. The goal is to prevent the investigator from influencing the trial and to ensure that known and unknown influencing factors are distributed evenly across all groups.REACH REACH stands for the Registration, Evaluation, Authorization and Restriction of Chemicals. This is an EU regulation that entered into force in mid-2007.Reactive mesogens Polymerizable liquid crystals that can be used, for example, as material for optical films. They help to enhance the display image quality.Recurrent In oncology, recurrent cancer means that the disease returns after it seems to have com-pletely disappeared. This is often caused by the incomplete removal of the tumor.Research spending ratio Research spending as a proportion of the sales of the company or division.
Schistosomiasis Schistosomiasis is a parasitic disease that is spread in warm lakes and ponds by snails that serve as intermediate hosts.Somatotropin A proteohormone occurring as a growth hormone in the human and animal organism. Somatotropin is essential to the achievement of normal height.
Tax rate The tax rate indicates the percentage rate by which Group profit before tax is to be multiplied in order to calculate the theoretical tax expense.Tax ratio The tax ratio indicates the ratio of total taxes to profit before tax.Total revenues Sum of sales as well as royalty, license and commission income. Royalties are earned primarily through patents held by the Merck Serono division.
VCI Verband der Chemischen Industrie (German Chemical Industry Association) represents the economic-political interests of 1,600 German chemical companies.
P /p
R /r
S /s
T /t
V /v
214
Glossary
Merck 2012More Information

FINANCIAL CALENDARMerck 2013
Febr
uary
M
arch
Ap
ril
May
Ju
ne
July
Au
gust
Se
ptem
ber
Octo
ber
Nove
mbe
r De
cem
ber
Janu
ary
5/5
I
ME
RC
K A
NN
UA
L R
Ep
oR
t 20
12 –
th
E R
oA
d t
o t
oM
oR
Ro
w –
ww
w.M
ER
CK
gR
oU
p.C
oM
Annual Press ConferenceThursday, 03/07/2013
Report on the First QuarterTuesday, 05/14/2013
Autumn Press Conference and Report on the Third QuarterThursday, 11/14/2013
Report on the First HalfTuesday, 08/06/2013
08/13
11/13
03/13
04/13Annual General MeetingFriday, 04/26/2013 05/13
215Merck 2012The road to tomorrow
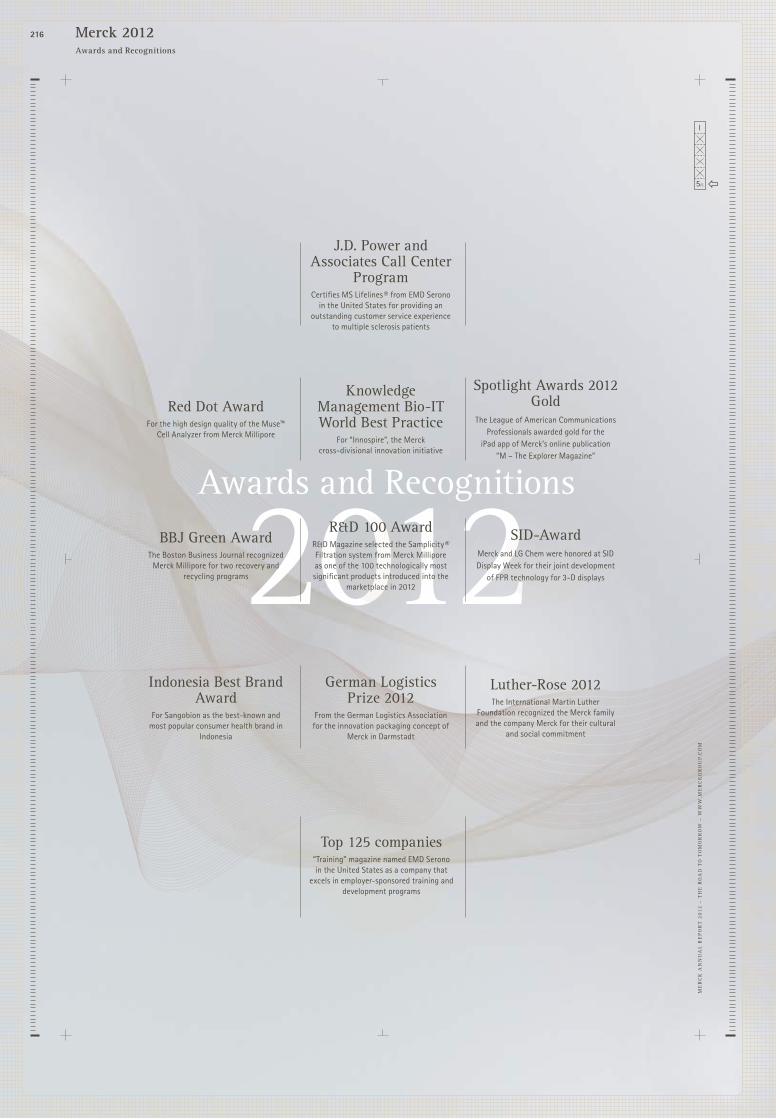
The road to tomorrow
The road to tomorrow
The road to tomorrow
The road to tomorrow
The road to tomorrow
The road to tomorrow
The road to tomorrow
The road to tomorrow
The road to tomorrow
The road to tomorrow
The road to tomorrow
The road to tomorrow
The road to tomorrow
The road to tomorrow
The road to tomorrow
The road to tomorrow
The road to tomorrow
The road to tomorrow
The road to tomorrow
The road to tomorrow
The road to tomorrow
The road to tomorrow
The road to tomorrow
The road to tom
orrow The road to tom
orrow The road to tom
orrow The road to tom
orrow The road to tom
orrow The road to tom
orrow The road to tom
orrow The road to tom
orrow The road to tom
orrow The road to tom
orrow The road to tom
orrow The road to tom
orrow The road to tom
orrow The road to tom
orrow The road to tom
orrow The road to tom
orrow The road to tom
orrow The road to tom
orrow The road to tom
orrow The road to tom
orrow The road to tom
orrow The road to tom
orrow The road to tom
orrow The road to tom
orrow The
road to tomorrow
The road to tomorrow
The road to tomorrow
The road to tomorrow
The road to tomorrow
The road to tomorrow
The road to tomorrow
The road to tomorrow
The road to tomorrow
The road to tomorrow
The road to tomorrow
The road to tomorrow
The road to tomorrow
The road to tomorrow
The road to tomorrow
The road to tomorrow
The road to tomorrow
The road to tomorrow
The road to tomorrow
The road to tomorrow
The road to tomorrow
The road to tomorrow
The road to tomorrow
The road to tomor-
row The road to tom
orrow The road to tom
orrow The road to tom
orrow The road to tom
orrow The road to tom
orrow The road to tom
orrow The road to tom
orrow The road to tom
orrow The road to tom
orrow The road to tom
orrow The road to tom
orrow The road to tom
orrow The road to tom
orrow The road to tom
orrow The road to tom
orrow The road to tom
orrow The road to tom
orrow The road to tom
orrow The road to tom
orrow The road to tom
orrow The road to tom
orrow The road to tom
orrow The road to tom
orrow The road
to tomorrow
The road to tomorrow
The road to tomorrow
The road to tomorrow
The road to tomorrow
The road to tomorrow
The road to tomorrow
The road to tomorrow
The road to tomorrow
The road to tomorrow
The road to tomorrow
The road to tomorrow
The road to tomorrow
The road to tomorrow
The road to tomorrow
The road to tomorrow
The road to tomorrow
The road to tomorrow
The road to tomorrow
The road to tomorrow
The road to tomorrow
The road to tomorrow
The road to tomorrow
The road to tomorrow
The road to tom
orrow The road to tom
orrow The road to tom
orrow The road to tom
orrow The road to tom
orrow The road to tom
orrow The road to tom
orrow The road to tom
orrow The road to tom
orrow The road to tom
orrow The road to tom
orrow The road to tom
orrow The road to tom
orrow The road to tom
orrow The road to tom
orrow The road to tom
orrow The road to tom
orrow The road to tom
orrow The road to tom
orrow The road to tom
orrow The road to tom
orrow The road to tom
orrow The road to tom
orrow The road to
tomorrow
The road to tomorrow
The road to tomorrow
The road to tomorrow
The road to tomorrow
The road to tomorrow
The road to tomorrow
The road to tomorrow
The road to tomorrow
The road to tomorrow
The road to tomorrow
The road to tomorrow
The road to tomorrow
The road to tomorrow
The road to tomorrow
The road to tomorrow
The road to tomorrow
The road to tomorrow
The road to tomorrow
The road to tomorrow
The road to tomorrow
The road to tomorrow
The road to tomorrow
The road to tomorrow
The road to tom
orrow The road to tom
orrow The road to tom
orrow The road to tom
orrow The road to tom
orrow The road to tom
orrow The road to tom
orrow The road to tom
orrow The road to tom
orrow The road to tom
orrow The road to tom
orrow The road to tom
orrow The road to tom
orrow The road to tom
orrow The road to tom
orrow The road to tom
orrow The road to tom
orrow The road to tom
orrow The road to tom
orrow The road to tom
orrow The road to tom
orrow The road to tom
orrow The road to tom
orrow The road to tom
or-row
The road to tomorrow
The road to tomorrow
The road to tomorrow
The road to tomorrow
The road to tomorrow
The road to tomorrow
The road to tomorrow
The road to tomorrow
The road to tomorrow
The road to tomorrow
The road to tomorrow
The road to tomorrow
The road to tomorrow
The road to tomorrow
The road to tomorrow
The road to tomorrow
The road to tomorrow
The road to tomorrow
The road to tomorrow
The road to tomorrow
The road to tomorrow
The road to tomorrow
The road to tomorrow
The road to tom
orrow The road to tom
orrow The road to tom
orrow The road to tom
orrow The road to tom
orrow The road to tom
orrow The road to tom
orrow The road to tom
orrow The road to tom
orrow The road to tom
orrow The road to tom
orrow The road to tom
orrow The road to tom
orrow The road to tom
orrow The road to tom
orrow The road to tom
orrow The road to tom
orrow The road to tom
orrow The road to tom
orrow The road to tom
orrow The road to tom
orrow The road to tom
orrow The road to tom
orrow The road to tom
orrow
row The road to tom
orrow The road to tom
orrow The road to tom
orrow
2012Awards and Recognitions
5/5
I
ME
RC
K A
NN
UA
L R
Ep
oR
t 20
12 –
th
E R
oA
d t
o t
oM
oR
Ro
w –
ww
w.M
ER
CK
gR
oU
p.C
oM
J.D. Power and Associates Call Center
ProgramCertifies MS Lifelines ® from EMD Serono
in the United States for providing an outstanding customer service experience
to multiple sclerosis patients
Red Dot AwardFor the high design quality of the Muse™
Cell Analyzer from Merck Millipore
SID-AwardMerck and LG Chem were honored at SID Display Week for their joint development
of FPR technology for 3-D displays
Top 125 companies “Training” magazine named EMD Serono in the United States as a company that
excels in employer-sponsored training and development programs
Indonesia Best Brand Award
For Sangobion as the best-known and most popular consumer health brand in
Indonesia
Luther-Rose 2012The International Martin Luther
Foundation recognized the Merck family and the company Merck for their cultural
and social commitment
German Logistics Prize 2012
From the German Logistics Association for the innovation packaging concept of
Merck in Darmstadt
Spotlight Awards 2012 Gold
The League of American Communications Professionals awarded gold for the
iPad app of Merck’s online publication “M – The Explorer Magazine”
Knowledge Management Bio-IT World Best Practice
For “Innospire”, the Merck cross-divisional innovation initiative
BBJ Green AwardThe Boston Business Journal recognized Merck Millipore for two recovery and
recycling programs
R&D 100 AwardR&D Magazine selected the Samplicity ® Filtration system from Merck Millipore as one of the 100 technologically most significant products introduced into the
marketplace in 2012
216 Merck 2012Awards and Recognitions

Business Development 2008 – 2012This overview may include historically adjusted values in order to ensure comparability with 2012.
€ million 2008 2009 2010 2011 2012Change
in %
Earnings performance
Total revenues 7,590 7,747 9,291 10,276 11,173 8.7Sales 7,202 7,378 8,929 9,906 10,741 8.4Operating result (EBIT) 731 621 1,113 1,1321 964 –14.9
Margin (in % of sales) 10.2 8.4 12.5 11.4 9.0EBITDA 1,947 1,625 2,457 2,7311 2,360 –13.6
Margin (in % of sales) 27.0 22.0 27.5 27.6 22.0One-time items –105 –28 –88 7 –605 –EBITDA pre one-time items 2,052 1,653 2,545 2,724 2,965 8.9
Margin (in % of sales) 28.5 22.4 28.5 27.5 27.6Profi t before tax 575 486 861 8391 709 –15.5Profi t after tax 379 377 642 6181 579 –6.3Earnings per share (in €) 1.69 1.68 2.91 2.791 2.61 –6.5
Asset positionTotal assets 15,645 16,713 22,388 22,1221 21,643 –2.2Non-current assets 11,286 11,181 16,724 15,7231 15,017 –4.5
– of which intangible assets (incl. goodwill) 8,203 7,598 12,484 11,764 10,945 –7.0– of which property, plant and equipment 2,440 2,608 3,241 3,113 2,954 –5.1
Current assets 4,359 5,532 5,664 6,3991 6,626 3.5– of which cash and cash equivalents 693 541 944 938 730 –22.2– of which trade accounts receivable 1,659 1,789 2,296 2,328 2,115 –9.2– of which inventories 1,407 1,368 1,674 1,691 1,534 –9.3
Financial liabilities 1,346 2,307 5,484 5,539 4,454 –19.6– of which current 266 705 356 1,394 1,091 –21.7– of which non-current 1,080 1,602 5,127 4,145 3,362 –18.9
Equity 9,563 9,514 10,372 10,4941 10,415 –0.8
Financial positionInvestments in intangible fi xed assets 2 141 97 104 80 144 80.9Investments in property, plant and equipment 2 395 467 396 366 329 –10.1Free cash fl ow 438 812 –3,522 1,436 2,040 42.0Net fi nancial debt 477 263 4,484 3,484 1,926 –44.7
Other key fi guresEquity ratio 61.1 56.9 46.3 47.41 48.1 –Research and development 1,234 1,345 1,397 1,5141 1,511 –0.2Dividend per share in € 1.50 1.00 1.25 1.50 1.70 13.3Employees (number as of December 31) 32,800 33,062 40,562 40,676 38,847 –4.51 Previous year‘s fi gures have been adjusted, see Note 5 of the Consolidated Financial Statements on page 138–139 2 According to the cash fl ow statement
Merck 2012The road to tomorrow
Business Development

Business Development 2008 – 2012This overview may include historically adjusted values in order to ensure comparability with 2012.
€ million 2008 2009 2010 2011 2012Change
in %
Earnings performance
Total revenues 7,590 7,747 9,291 10,276 11,173 8.7Sales 7,202 7,378 8,929 9,906 10,741 8.4Operating result (EBIT) 731 621 1,113 1,1321 964 –14.9
Margin (in % of sales) 10.2 8.4 12.5 11.4 9.0EBITDA 1,947 1,625 2,457 2,7311 2,360 –13.6
Margin (in % of sales) 27.0 22.0 27.5 27.6 22.0One-time items –105 –28 –88 7 –605 –EBITDA pre one-time items 2,052 1,653 2,545 2,724 2,965 8.9
Margin (in % of sales) 28.5 22.4 28.5 27.5 27.6Profi t before tax 575 486 861 8391 709 –15.5Profi t after tax 379 377 642 6181 579 –6.3Earnings per share (in €) 1.69 1.68 2.91 2.791 2.61 –6.5
Asset positionTotal assets 15,645 16,713 22,388 22,1221 21,643 –2.2Non-current assets 11,286 11,181 16,724 15,7231 15,017 –4.5
– of which intangible assets (incl. goodwill) 8,203 7,598 12,484 11,764 10,945 –7.0– of which property, plant and equipment 2,440 2,608 3,241 3,113 2,954 –5.1
Current assets 4,359 5,532 5,664 6,3991 6,626 3.5– of which cash and cash equivalents 693 541 944 938 730 –22.2– of which trade accounts receivable 1,659 1,789 2,296 2,328 2,115 –9.2– of which inventories 1,407 1,368 1,674 1,691 1,534 –9.3
Financial liabilities 1,346 2,307 5,484 5,539 4,454 –19.6– of which current 266 705 356 1,394 1,091 –21.7– of which non-current 1,080 1,602 5,127 4,145 3,362 –18.9
Equity 9,563 9,514 10,372 10,4941 10,415 –0.8
Financial positionInvestments in intangible fi xed assets 2 141 97 104 80 144 80.9Investments in property, plant and equipment 2 395 467 396 366 329 –10.1Free cash fl ow 438 812 –3,522 1,436 2,040 42.0Net fi nancial debt 477 263 4,484 3,484 1,926 –44.7
Other key fi guresEquity ratio 61.1 56.9 46.3 47.41 48.1 –Research and development 1,234 1,345 1,397 1,5141 1,511 –0.2Dividend per share in € 1.50 1.00 1.25 1.50 1.70 13.3Employees (number as of December 31) 32,800 33,062 40,562 40,676 38,847 –4.51 Previous year‘s fi gures have been adjusted, see Note 5 of the Consolidated Financial Statements on page 138–139 2 According to the cash fl ow statement

W 8
40 5
7035
0313
Id-No. 1326863www.bvdm-online.de
Published on March 7, 2013 byMerck KGaA, Group CommunicationsFrankfurter Strasse 250, 64293 Darmstadt, GermanyTelephone: +49 (0) 6151-72 0Fax: +49 (0) 6151-72 5577E-Mail: [email protected]: www.merckgroup.com
Concept and designStrichpunkt, Stuttgart / Berlinwww.strichpunkt-design.de
PhotosCatrin Moritz / Essen (cover, p. 4, 8, 12, 16, 22, 26)Matthias Ziegler / Munich (p. 7, 11, 15, 19)
Employee photosKS Ananthasvian / Performance MaterialsFalk-Felix Passarge / Strategic PlanningTara Smith / Consumer HealthSiv-Hung Sy / Performance MaterialsEric Walter / Merck Millipore
Paper: LuxoArtPrinting: Franz Kuthal GmbH & Co. KG
The Merck Annual Report for 2012 was published in German and English. The report is also available as navigable online version www.merckgroup.com/annualreport2012.
More information about Merck can be found on the Web at www.merckgroup.com and in the following publication, which you may read or order at (www.merckgroup.com/publications):
The Merck Group. An overview in German, English, French and Spanish.
You can order these publications from Group Communications,Merck KGaA, 64271 Darmstadt [email protected]
Information and Service
Mer
ckA
nnua
l Rep
ort 2
012
The
road
to to
mor
row
www.merckgroup.com

W 8
40 5
7035
0313
Id-No. 1326863www.bvdm-online.de
Published on March 7, 2013 byMerck KGaA, Group CommunicationsFrankfurter Strasse 250, D-64293 DarmstadtTelephone: +49 (0) 6151-72 0Fax: +49 (0) 6151-72 5577E-Mail: [email protected]: www.merckgroup.com
Concept and designStrichpunkt, Stuttgart / Berlinwww.strichpunkt-design.de
PhotosCatrin Moritz / Essen (cover, p. 4, 8, 12, 16, 22, 26)Matthias Ziegler / Munich (p. 7, 11, 15, 19)
Employees photosKS Ananthasvian / Performance MaterialsFalk-Felix Passarge / Strategic PlanningTara Smith / Consumer HealthSiv-Hung Sy / Performance MaterialsEric Walter / Merck Millipore
Paper: LuxoArtPrinting: Franz Kuthal GmbH & Co. KG
The Merck Annual Report for 2012 was published in German and English. The report is also available as navigable online version www.merckgroup.com/annualreport2012.
More information about Merck can be found on the Web at www.merckgroup.com and in the following publication, which you may read or order at (www.merckgroup.com/publications):
The Merck Group. An overview in German, English, French and Spanish.
You can order these publications from Group Communications,Merck KGaA, 64271 Darmstadt [email protected]
Information and Service
Mer
ckA
nnua
l Rep
ort 2
012
The
road
to to
mor
row
www.merckgroup.com