˘ ˇˆ - NTNUcurtis/courses/PVT-Flow/2013-TPG4145/e... · 2013-08-21 · VOLUMETRIC AND PHASE...
13
VOLUMETRIC AND PHASE BEHAVIOR OF OIL AND GAS SYSTEMS 1 Chapter 2 Volumetric and Phase Behavior of Oil and Gas Systems 2.1 Introduction Petroleum reservoir fluids are naturally occurring mixtures of natu- ral gas and crude oil that exist in the reservoir at elevated tempera- tures and pressures. Reservoir-fluid compositions typically include hundreds or thousands of hydrocarbons and a few nonhydrocar- bons, such as nitrogen, CO 2 , and hydrogen sulfide. The physical properties of these mixtures depend primarily on composition and temperature and pressure conditions. Reservoir temperature can usually be assumed to be constant in a given reservoir or to be a weak function of depth. As oil and gas are produced, reservoir pressure decreases and the remaining hydrocarbon mixtures change in com- position, volumetric properties, and phase behavior. Gas injection also may change reservoir-fluid composition and properties. Katz and Williams 1 give an excellent review of reservoir fluids and their general behavior under different operating conditions. The hydrocarbon phases and connate water sharing the pore vol- ume (PV) in a reservoir are in thermodynamic equilibrium. Strictly speaking, hydrocarbons and water should be treated simultaneously in phase-behavior calculations. At typical reservoir conditions, the ef- fect of connate water on hydrocarbon phase behavior can usually be neglected. Water can, however, affect the total-system phase behavior (for example, when hydrates form from natural-gas/water mixtures). This chapter covers only two-phase, vapor/liquid phase behavior. Chap. 8 briefly covers three- and four-phase systems (vapor/liquid/ liquid and vapor/liquid/liquid/solids) for low-temperature CO 2 /oil and rich-gas/oil mixtures, and Chap. 9 gives the behavior of vapor and solids related to hydrates. Sec. 2.1 introduces the composition of petroleum reservoir fluids and emphasizes their chemical complexity. Because reservoir fluids are made up of many components, a detailed quantitative analysis is difficult to perform. Organic compounds found in reservoir fluids are expressed by a general formula that classifies even high-molec- ular-weight compounds containing sulfur, nitrogen, and oxygen. This chapter also gives a historical review of the American Petro- leum Inst. (API) -supported projects that defined many of the com- pounds known today. Simple one- and two-component phase behavior can be helpful in describing the effects of pressure, temperature, and composition on the reservoir-fluid phase behavior. Sec. 2.2 presents pressure/temper- ature ( p-T ), pressure/volume ( p-V ), and pressure/composition ( p-x) phase diagrams of simple systems. The behavior of these idealized systems is qualitatively similar to the behavior of complex reservoir fluids, as Sec. 2.3 shows. Retrograde condensation is perhaps the most unusual phase be- havior that petroleum reservoir fluids exhibit.* Sec. 2.4 discusses the definition of retrograde condensation and the effect of retro- grade condensation on the behavior of gas-condensate reservoirs. Petroleum reservoir fluids can be divided into five general cate- gories, in increasing order of chemical complexity: dry gas, wet gas, gas condensate, volatile oil, and black oil. However, the phase be- haviors of gas condensates and volatile oils are considerably more complex than those of black oils. The component distribution in a reservoir fluid, not simply the number of components, determines how close a fluid is to a critical state. Complex phase behavior is typ- ically associated with systems that are “near critical”: systems that usually contain 10 to 15 mol% of components that are heptanes and heavier (C 7+ ). Since the early 1930’s, experimental data have been measured on- fluids of each type listed above. Sec. 2.5 defines each fluid type by its p-T diagram. Also, general characteristics of reservoir fluids are summarized in terms of composition and surface properties, such as GOR and stock-tank-oil gravity. 2.2 ReservoirĆFluid Composition The nature and composition of a reservoir fluid depends somewhat on the depositional environment of the formation from which the fluid is produced. Geologic maturation also influences reservoir-fluid composition. Several theories offer explanations for the origin and formation of petroleum over geologic time; no single theory suffices to explain how oil and gas were formed in all reservoirs. One theory portrays reservoirs as giant high-temperature/high-pressure reactors with catalytic rock surfaces that slowly convert deposited organic matter into oil and gas. Other theories hypothesize that oil and gas were formed from bacterial action on deposited organic matter. Other investigators maintain that oil and gas may be formed in the same geologic formation but that each fluid migrates to “traps” at different elevations because of fluid-density differences and gravity forces. Crude oil and natural gas are composed of many chemical com- pounds with a wide range of molecular weights. Some estimates 2-4 suggest that perhaps 3,000 organic compounds can exist in a single *Historically, retrograde condensation has been considered the most complex phase-behav- ior phenomenon observed by reservoir fluids. Perhaps equally intriguing are the phenomena of strong compositional gradients, the condensing/vaporizing miscible mechanism (Chap. 8), asphaltene precipitation, and low-temperature, multiphase CO 2 behavior.
Transcript of ˘ ˇˆ - NTNUcurtis/courses/PVT-Flow/2013-TPG4145/e... · 2013-08-21 · VOLUMETRIC AND PHASE...
VOLUMETRIC AND PHASE BEHAVIOR OF OIL AND GAS SYSTEMS 1
������� �
�� ����� ��� ����� �������� ��� ��� ��� ����� �
��� ����������
Petroleum reservoir fluids are naturally occurring mixtures of natu-ral gas and crude oil that exist in the reservoir at elevated tempera-tures and pressures. Reservoir-fluid compositions typically includehundreds or thousands of hydrocarbons and a few nonhydrocar-bons, such as nitrogen, CO2, and hydrogen sulfide. The physicalproperties of these mixtures depend primarily on composition andtemperature and pressure conditions. Reservoir temperature canusually be assumed to be constant in a given reservoir or to be a weakfunction of depth. As oil and gas are produced, reservoir pressuredecreases and the remaining hydrocarbon mixtures change in com-position, volumetric properties, and phase behavior. Gas injectionalso may change reservoir-fluid composition and properties. Katzand Williams1 give an excellent review of reservoir fluids and theirgeneral behavior under different operating conditions.
The hydrocarbon phases and connate water sharing the pore vol-ume (PV) in a reservoir are in thermodynamic equilibrium. Strictlyspeaking, hydrocarbons and water should be treated simultaneouslyin phase-behavior calculations. At typical reservoir conditions, the ef-fect of connate water on hydrocarbon phase behavior can usually beneglected. Water can, however, affect the total-system phase behavior(for example, when hydrates form from natural-gas/water mixtures).
This chapter covers only two-phase, vapor/liquid phase behavior.Chap. 8 briefly covers three- and four-phase systems (vapor/liquid/liquid and vapor/liquid/liquid/solids) for low-temperature CO2/oiland rich-gas/oil mixtures, and Chap. 9 gives the behavior of vaporand solids related to hydrates.
Sec. 2.1 introduces the composition of petroleum reservoir fluidsand emphasizes their chemical complexity. Because reservoir fluidsare made up of many components, a detailed quantitative analysisis difficult to perform. Organic compounds found in reservoir fluidsare expressed by a general formula that classifies even high-molec-ular-weight compounds containing sulfur, nitrogen, and oxygen.This chapter also gives a historical review of the American Petro-leum Inst. (API) -supported projects that defined many of the com-pounds known today.
Simple one- and two-component phase behavior can be helpful indescribing the effects of pressure, temperature, and composition onthe reservoir-fluid phase behavior. Sec. 2.2 presents pressure/temper-ature ( p-T), pressure/volume ( p-V), and pressure/composition ( p-x)phase diagrams of simple systems. The behavior of these idealizedsystems is qualitatively similar to the behavior of complex reservoirfluids, as Sec. 2.3 shows.
Retrograde condensation is perhaps the most unusual phase be-havior that petroleum reservoir fluids exhibit.* Sec. 2.4 discussesthe definition of retrograde condensation and the effect of retro-grade condensation on the behavior of gas-condensate reservoirs.
Petroleum reservoir fluids can be divided into five general cate-gories, in increasing order of chemical complexity: dry gas, wet gas,gas condensate, volatile oil, and black oil. However, the phase be-haviors of gas condensates and volatile oils are considerably morecomplex than those of black oils. The component distribution in areservoir fluid, not simply the number of components, determineshow close a fluid is to a critical state. Complex phase behavior is typ-ically associated with systems that are “near critical”: systems thatusually contain 10 to 15 mol% of components that are heptanes andheavier (C7+).
Since the early 1930’s, experimental data have been measured on-fluids of each type listed above. Sec. 2.5 defines each fluid type byits p-T diagram. Also, general characteristics of reservoir fluids aresummarized in terms of composition and surface properties, such asGOR and stock-tank-oil gravity.
��� ��������� ���� � ������
The nature and composition of a reservoir fluid depends somewhaton the depositional environment of the formation from which thefluid is produced. Geologic maturation also influences reservoir-fluidcomposition. Several theories offer explanations for the origin andformation of petroleum over geologic time; no single theory sufficesto explain how oil and gas were formed in all reservoirs. One theoryportrays reservoirs as giant high-temperature/high-pressure reactorswith catalytic rock surfaces that slowly convert deposited organicmatter into oil and gas. Other theories hypothesize that oil and gaswere formed from bacterial action on deposited organic matter. Otherinvestigators maintain that oil and gas may be formed in the samegeologic formation but that each fluid migrates to “traps” at differentelevations because of fluid-density differences and gravity forces.
Crude oil and natural gas are composed of many chemical com-pounds with a wide range of molecular weights. Some estimates2-4
suggest that perhaps 3,000 organic compounds can exist in a single
*Historically, retrograde condensation has been considered the most complex phase-behav-ior phenomenon observed by reservoir fluids. Perhaps equally intriguing are the phenomenaof strong compositional gradients, the condensing/vaporizing miscible mechanism (Chap. 8),asphaltene precipitation, and low-temperature, multiphase CO2 behavior.
2 PHASE BEHAVIOR
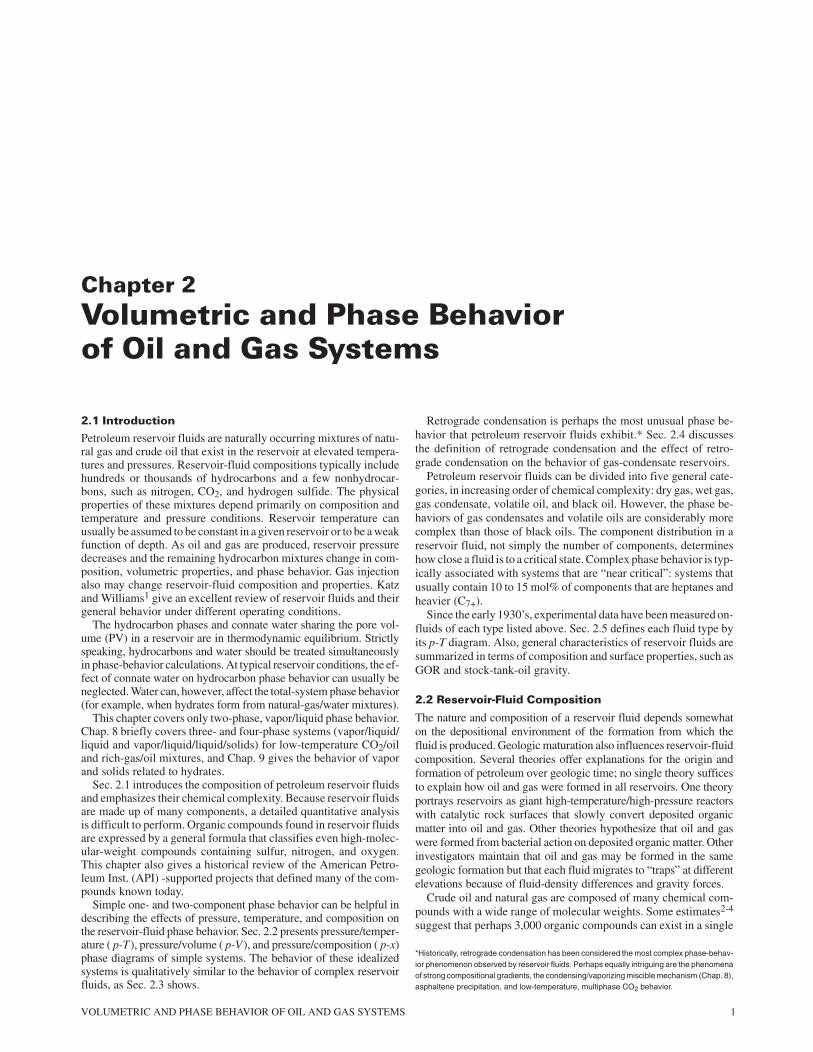
TABLE 2.1—COMPOSITION AND PROPERTIES OF SEVERAL RESERVOIR FLUIDS
Composition (mol%)
Component Dry Gas Wet Gas
Gas
Condensate
Near-Critical
Oil Volatile Oil Black Oil
CO2 0.10 1.41 2.37 1.30 0.93 0.02
N2 2.07 0.25 0.31 0.56 0.21 0.34
C1 86.12 92.46 73.19 69.44 58.77 34.62
C2 5.91 3.18 7.80 7.88 7.57 4.11
C3 3.58 1.01 3.55 4.26 4.09 1.01
i-C4 1.72 0.28 0.71 0.89 0.91 0.76
n-C4 0.24 1.45 2.14 2.09 0.49
i-C5 0.50 0.13 0.64 0.90 0.77 0.43
n-C5 0.08 0.68 1.13 1.15 0.21
C6(s) 0.14 1.09 1.46 1.75 1.61
C7 + 0.82 8.21 10.04 21.76 56.40
Properties
MC7�130 184 219 228 274
�C7�0.763 0.816 0.839 0.858 0.920
KwC712.00 11.95 11.98 11.83 11.47
GOR, scf/STB ∞ 105,000 5,450 3,650 1,490 300
OGR, STB/MMscf 0 10 180 275
�API 57 49 45 38 24
�g 0.61 0.70 0.71 0.70 0.63
psat, psia 3,430 6.560 7,015 5,420 2,810
Bsat, ft3/scf or bbl/STB 0.0051 0.0039 2.78 1.73 1.16
�sat, ������� 9.61 26.7 30.7 38.2 51.4
reservoir fluid. The lighter and simpler compounds are produced asnatural gas after surface separation, whereas the heavier and morecomplex compounds form crude oil at stock-tank conditions. Table2.1 gives typical oilfield molar compositions for reservoir mixtures.The heavier components are usually lumped into a “plus” fractioninstead of being identified individually. Chap. 5 discusses methodsof quantifying and characterizing the components that make up theplus fraction—usually heptanes-plus.
Natural gas is composed mainly of low-molecular-weight alka-nes (methane through butanes), CO2, hydrogen sulfide, nitrogen,and, in some cases, lesser quantities of helium, hydrogen, CO, andcarbonyl sulfide.5 Most crude oils are composed mainly of hydro-carbons (hydrogen and carbon compounds). The broad spectrum oforganic compounds found in petroleum during the formation ofcrude oil also includes sulfur, nitrogen, oxygen, and trace metals.Tars and asphalts are solid or semisolid mixtures that include bitu-men, pitch, waxes, and resins. These high-molecular-weight com-plex colloidal suspensions exhibit non-Newtonian rheology.
The temperature and pressure gradients in a formation may causereservoir-fluid properties to vary as a function of depth. “Composi-tional grading” is the continual change of composition as a functionof depth.6-8 In compositional grading, reservoir temperature may benear the critical temperature of reservoir fluid(s) at certain depths inthe reservoir. Physically, the thermodynamic forces of individualcomponents in a near-critical mixture are of the same order of mag-nitude as gravity forces that tend to separate the lighter from theheavier components. The result can be a transition from an undersat-urated gas condensate at the highest elevation to an undersaturatedoil at the lowest elevation, with or without a visible phase transitionfrom gas to oil (gas/oil contact).
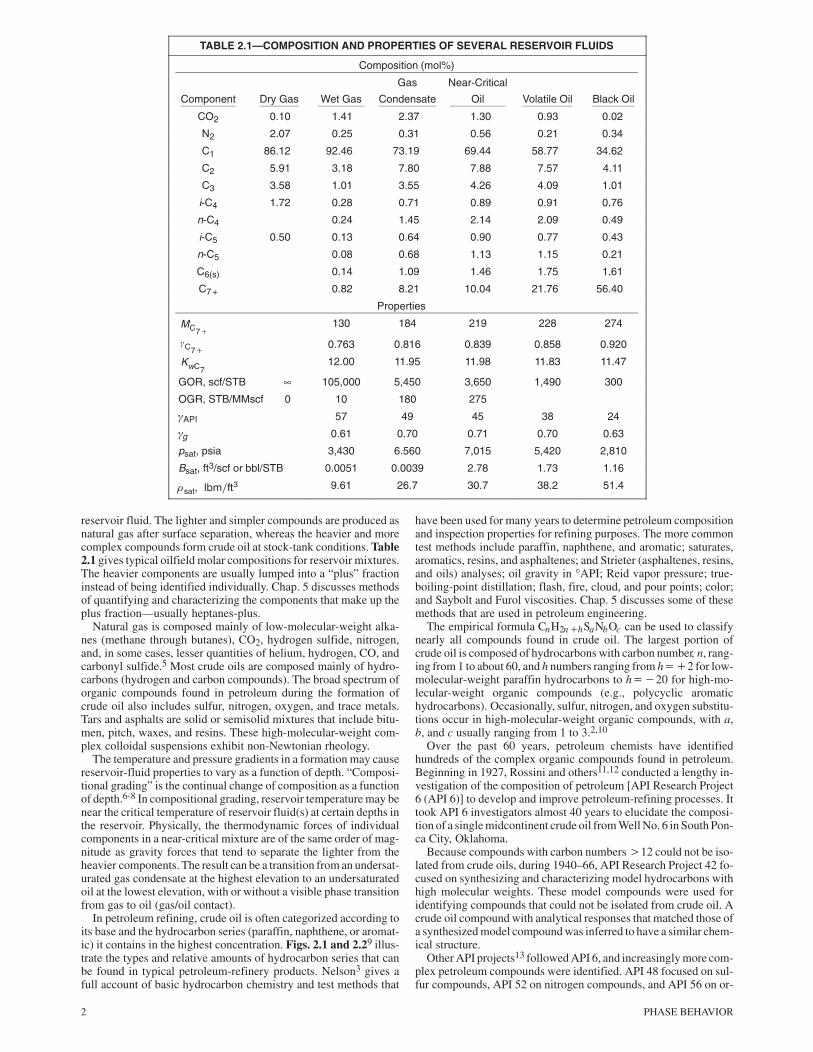
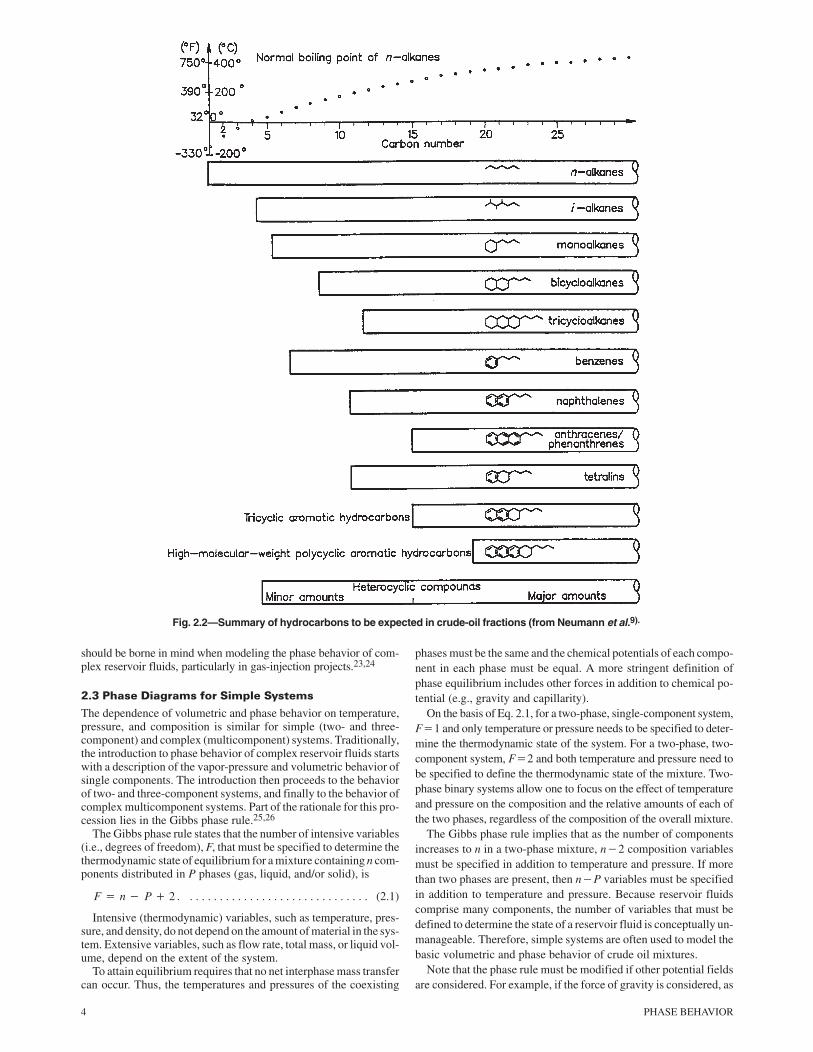
In petroleum refining, crude oil is often categorized according toits base and the hydrocarbon series (paraffin, naphthene, or aromat-ic) it contains in the highest concentration. Figs. 2.1 and 2.29 illus-trate the types and relative amounts of hydrocarbon series that canbe found in typical petroleum-refinery products. Nelson3 gives afull account of basic hydrocarbon chemistry and test methods that
have been used for many years to determine petroleum compositionand inspection properties for refining purposes. The more commontest methods include paraffin, naphthene, and aromatic; saturates,aromatics, resins, and asphaltenes; and Strieter (asphaltenes, resins,and oils) analyses; oil gravity in °API; Reid vapor pressure; true-boiling-point distillation; flash, fire, cloud, and pour points; color;and Saybolt and Furol viscosities. Chap. 5 discusses some of thesemethods that are used in petroleum engineering.
The empirical formula CnH2n�hSaNbOc can be used to classifynearly all compounds found in crude oil. The largest portion ofcrude oil is composed of hydrocarbons with carbon number, n, rang-ing from 1 to about 60, and h numbers ranging from h��2 for low-molecular-weight paraffin hydrocarbons to h��20 for high-mo-lecular-weight organic compounds (e.g., polycyclic aromatichydrocarbons). Occasionally, sulfur, nitrogen, and oxygen substitu-tions occur in high-molecular-weight organic compounds, with a,b, and c usually ranging from 1 to 3.2,10
Over the past 60 years, petroleum chemists have identifiedhundreds of the complex organic compounds found in petroleum.Beginning in 1927, Rossini and others11,12 conducted a lengthy in-vestigation of the composition of petroleum [API Research Project6 (API 6)] to develop and improve petroleum-refining processes. Ittook API 6 investigators almost 40 years to elucidate the composi-tion of a single midcontinent crude oil from Well No. 6 in South Pon-ca City, Oklahoma.
Because compounds with carbon numbers �12 could not be iso-lated from crude oils, during 1940–66, API Research Project 42 fo-cused on synthesizing and characterizing model hydrocarbons withhigh molecular weights. These model compounds were used foridentifying compounds that could not be isolated from crude oil. Acrude oil compound with analytical responses that matched those ofa synthesized model compound was inferred to have a similar chem-ical structure.
Other API projects13 followed API 6, and increasingly more com-plex petroleum compounds were identified. API 48 focused on sul-fur compounds, API 52 on nitrogen compounds, and API 56 on or-
VOLUMETRIC AND PHASE BEHAVIOR OF OIL AND GAS SYSTEMS 3
Fig. 2.1—Petroleum products identified according to carbon number.
ganometallic compounds. API 60 extended the work of API 6 toinclude petroleum heavy ends.
In 1975, API stopped sponsoring basic research into the composi-tion of petroleum. From 1975 to 1982, the petroleum engineeringindustry made additional advances in analytical techniques mainlybecause of the synfuels effort. The most sophisticated analyticaltechniques now in use include highly selective solvent extrac-tion14-16; simulated distillation; gel permeation, high-performanceliquid,17 and supercritical chromatography18; and mass infrared,13C nuclear magnetic resonance,19 and Fourier-transform infraredspectroscopy. The American Chemical Soc. Div. of PetroleumChemistry provides a comprehensive review of this area of researchevery 2 to 3 years.
Table 2.220 shows an example of a crude-oil distillate classifiedby h number (in the general formula CnH2n�hSaNbOc) and prob-able structural type, which determines the range of possible n num-bers. Within and across each hydrocarbon class, many isomers shareh and n numbers. The alkane (paraffin) series (h�2) has completelysaturated hydrocarbon chains that are chemically very stable. Thealkene (olefin) and alkyne (acetylene) series (h�0 and h��2) arecomposed of unsaturated, straight-chain hydrocarbons. Because al-kenes and alkynes are reactive, they are not usually found in natural-ly occurring petroleum deposits.
The naphthene series (h�0), saturated-ring or cyclic compounds,are found in nearly all crudes. The aromatic or “benzene” series(h��6) are unsaturated cyclic compounds. Low-boiling-point aro-matics, which are also reactive, are found in relatively low concentra-tions in crude oil. Heavier crude oils are characterized by unsaturatedpolycyclic aromatic hydrocarbons with increasingly negative h num-
bers. As molecular weight increases, these compounds assume vary-ing degrees of fused-ring saturation, with occasional hydrocarbonside chains. Sulfur, nitrogen, and oxygen can be substituted in thefused hydrocarbon rings to form heterocyclics or can occupy variouspositions on side chains.21 Metals, such as nickel and vanadium, canform organometallic compounds (porphyrins) in crude oil.2,10
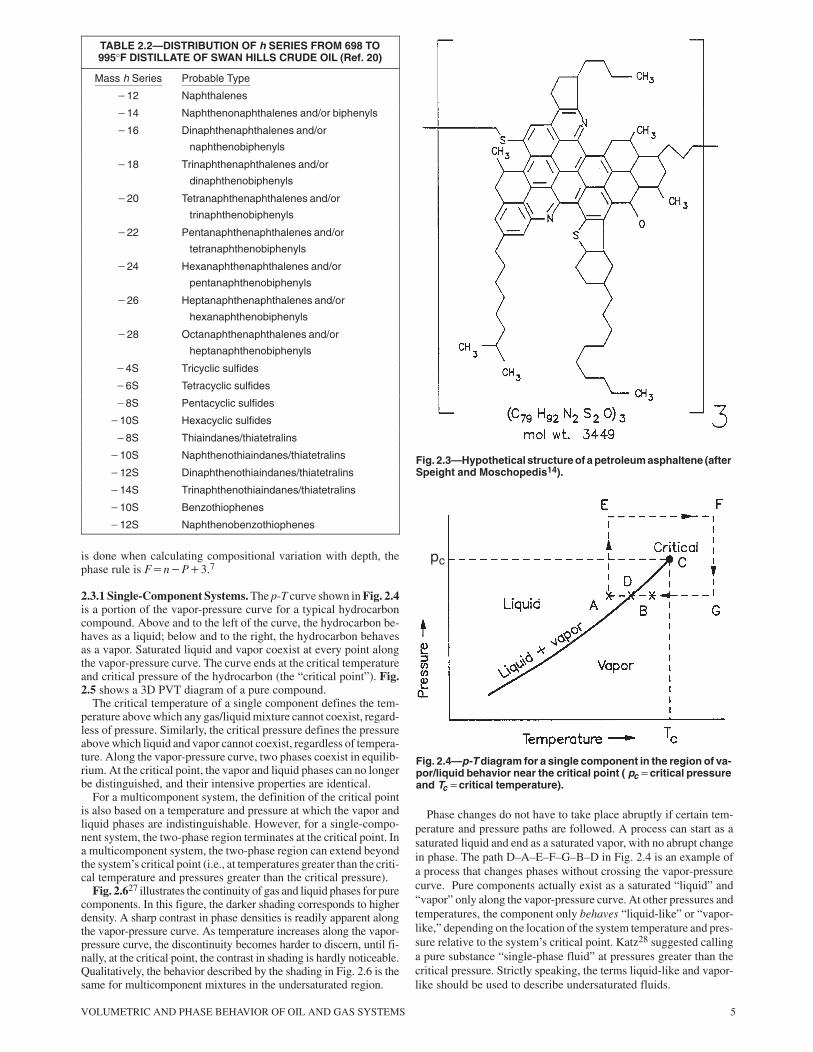
Asphalts, bitumens, and tars are complex colloidal mixtures of car-boids, carbenes, asphaltenes, and maltenes (resins and oils). Micellarstructures of carboids, carbenes, and asphaltenes are formed by aro-matic polycondensation reactions and are maintained in colloidal sus-pension by the maltenes. These fractions are separated according totheir solubility or lack of solubility in certain low-molecular-weightsolvents, such as propane, pentane, n-hexane, and carbon disulfide.
Fig. 2.316 shows a hypothetical chemical structure of an asphal-tene. The bracket around the structure implies that the structure isrepeated three times. Although asphalt mixtures are complex incomposition and rheology, they follow certain molecular-weightdistributions that can be characterized as discussed in Chap. 5.
Understanding the nature of asphaltenes is important in petroleumengineering because, even in low concentrations, asphaltenes canmarkedly affect reservoir-fluid phase behavior.22 Because asphal-tenes are polar and hydrogen bonding, they alter reservoir wettabilityby adsorbing onto the rock surface.23 This alteration of reservoirwettability may affect capillary pressure, relative-permeability rela-tions, residual oil saturations, waterflood behavior, dispersion, andelectrical properties. Figs. 2.2 and 2.3 vividly show that the composi-tion of crude oil is considerably more complex than the CnH2n�2straight-chain models commonly thought of as “oil.” This complexity
4 PHASE BEHAVIOR
Fig. 2.2—Summary of hydrocarbons to be expected in crude-oil fractions (from Neumann et al.9).
should be borne in mind when modeling the phase behavior of com-plex reservoir fluids, particularly in gas-injection projects.23,24
��! ����� "��#�� � �� �� ��� ����� �
The dependence of volumetric and phase behavior on temperature,pressure, and composition is similar for simple (two- and three-component) and complex (multicomponent) systems. Traditionally,the introduction to phase behavior of complex reservoir fluids startswith a description of the vapor-pressure and volumetric behavior ofsingle components. The introduction then proceeds to the behaviorof two- and three-component systems, and finally to the behavior ofcomplex multicomponent systems. Part of the rationale for this pro-cession lies in the Gibbs phase rule.25,26
The Gibbs phase rule states that the number of intensive variables(i.e., degrees of freedom), F, that must be specified to determine thethermodynamic state of equilibrium for a mixture containing n com-ponents distributed in P phases (gas, liquid, and/or solid), is
F � n � P � 2 . (2.1). . . . . . . . . . . . . . . . . . . . . . . . . . . . . .
Intensive (thermodynamic) variables, such as temperature, pres-sure, and density, do not depend on the amount of material in the sys-tem. Extensive variables, such as flow rate, total mass, or liquid vol-ume, depend on the extent of the system.
To attain equilibrium requires that no net interphase mass transfercan occur. Thus, the temperatures and pressures of the coexisting
phases must be the same and the chemical potentials of each compo-nent in each phase must be equal. A more stringent definition ofphase equilibrium includes other forces in addition to chemical po-tential (e.g., gravity and capillarity).
On the basis of Eq. 2.1, for a two-phase, single-component system,F�1 and only temperature or pressure needs to be specified to deter-mine the thermodynamic state of the system. For a two-phase, two-component system, F�2 and both temperature and pressure need tobe specified to define the thermodynamic state of the mixture. Two-phase binary systems allow one to focus on the effect of temperatureand pressure on the composition and the relative amounts of each ofthe two phases, regardless of the composition of the overall mixture.
The Gibbs phase rule implies that as the number of componentsincreases to n in a two-phase mixture, n�2 composition variablesmust be specified in addition to temperature and pressure. If morethan two phases are present, then n�P variables must be specifiedin addition to temperature and pressure. Because reservoir fluidscomprise many components, the number of variables that must bedefined to determine the state of a reservoir fluid is conceptually un-manageable. Therefore, simple systems are often used to model thebasic volumetric and phase behavior of crude oil mixtures.
Note that the phase rule must be modified if other potential fieldsare considered. For example, if the force of gravity is considered, as
VOLUMETRIC AND PHASE BEHAVIOR OF OIL AND GAS SYSTEMS 5
TABLE 2.2—DISTRIBUTION OF h SERIES FROM 698 TO995°F DISTILLATE OF SWAN HILLS CRUDE OIL (Ref. 20)
Mass h Series Probable Type
�12 Naphthalenes
�14 Naphthenonaphthalenes and/or biphenyls
�16 Dinaphthenaphthalenes and/or
naphthenobiphenyls
�18 Trinaphthenaphthalenes and/or
dinaphthenobiphenyls
�20 Tetranaphthenaphthalenes and/or
trinaphthenobiphenyls
�22 Pentanaphthenaphthalenes and/or
tetranaphthenobiphenyls
�24 Hexanaphthenaphthalenes and/or
pentanaphthenobiphenyls
�26 Heptanaphthenaphthalenes and/or
hexanaphthenobiphenyls
�28 Octanaphthenaphthalenes and/or
heptanaphthenobiphenyls
�4S Tricyclic sulfides
�6S Tetracyclic sulfides
�8S Pentacyclic sulfides
�10S Hexacyclic sulfides
�8S Thiaindanes/thiatetralins
�10S Naphthenothiaindanes/thiatetralins
�12S Dinaphthenothiaindanes/thiatetralins
�14S Trinaphthenothiaindanes/thiatetralins
�10S Benzothiophenes
�12S Naphthenobenzothiophenes
is done when calculating compositional variation with depth, thephase rule is F�n�P�3.7
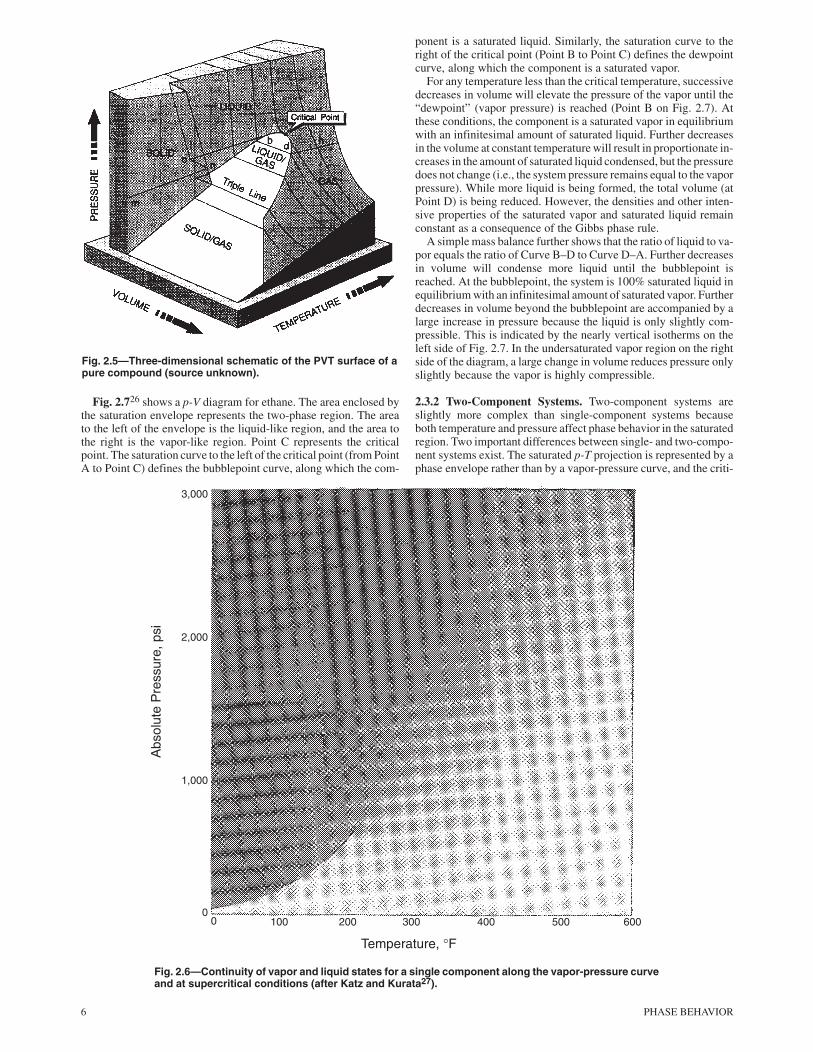
2.3.1 Single-Component Systems. The p-T curve shown in Fig. 2.4is a portion of the vapor-pressure curve for a typical hydrocarboncompound. Above and to the left of the curve, the hydrocarbon be-haves as a liquid; below and to the right, the hydrocarbon behavesas a vapor. Saturated liquid and vapor coexist at every point alongthe vapor-pressure curve. The curve ends at the critical temperatureand critical pressure of the hydrocarbon (the “critical point”). Fig.2.5 shows a 3D PVT diagram of a pure compound.
The critical temperature of a single component defines the tem-perature above which any gas/liquid mixture cannot coexist, regard-less of pressure. Similarly, the critical pressure defines the pressureabove which liquid and vapor cannot coexist, regardless of tempera-ture. Along the vapor-pressure curve, two phases coexist in equilib-rium. At the critical point, the vapor and liquid phases can no longerbe distinguished, and their intensive properties are identical.
For a multicomponent system, the definition of the critical pointis also based on a temperature and pressure at which the vapor andliquid phases are indistinguishable. However, for a single-compo-nent system, the two-phase region terminates at the critical point. Ina multicomponent system, the two-phase region can extend beyondthe system’s critical point (i.e., at temperatures greater than the criti-cal temperature and pressures greater than the critical pressure).
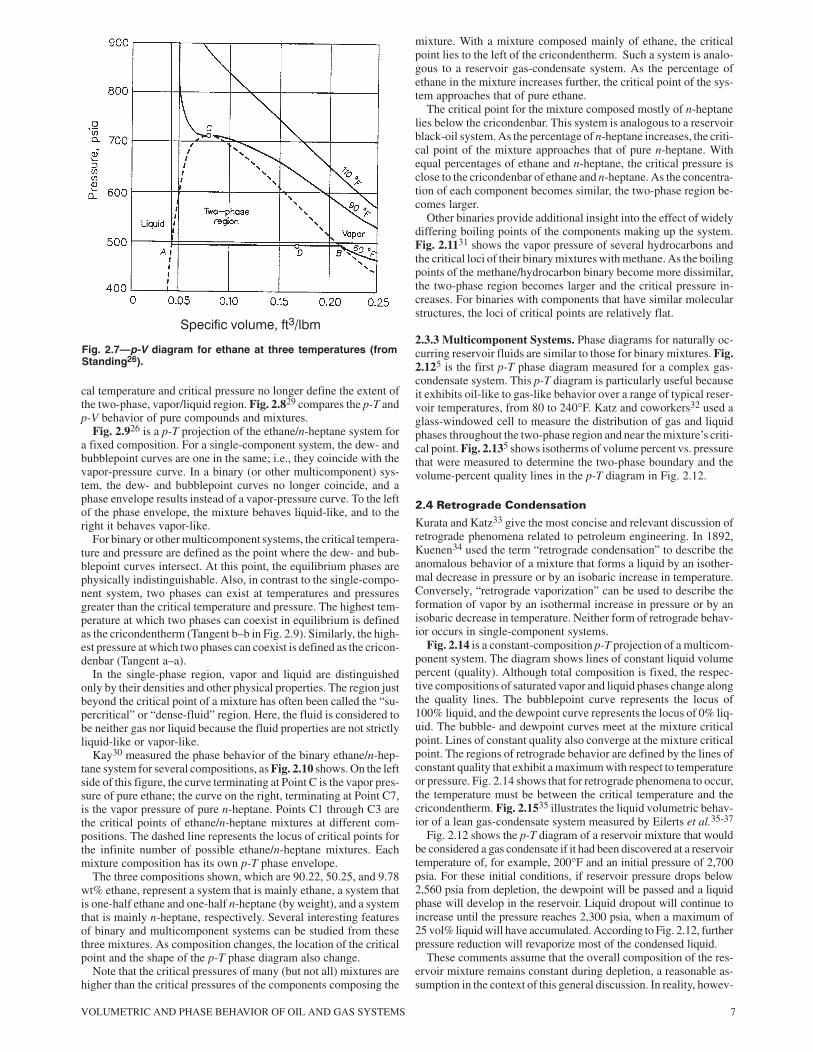
Fig. 2.627 illustrates the continuity of gas and liquid phases for purecomponents. In this figure, the darker shading corresponds to higherdensity. A sharp contrast in phase densities is readily apparent alongthe vapor-pressure curve. As temperature increases along the vapor-pressure curve, the discontinuity becomes harder to discern, until fi-nally, at the critical point, the contrast in shading is hardly noticeable.Qualitatively, the behavior described by the shading in Fig. 2.6 is thesame for multicomponent mixtures in the undersaturated region.
Fig. 2.3—Hypothetical structure of a petroleum asphaltene (afterSpeight and Moschopedis14).
Fig. 2.4—p-T diagram for a single component in the region of va-por/liquid behavior near the critical point ( pc�critical pressureand Tc�critical temperature).
��
Phase changes do not have to take place abruptly if certain tem-perature and pressure paths are followed. A process can start as asaturated liquid and end as a saturated vapor, with no abrupt changein phase. The path D–A–E–F–G–B–D in Fig. 2.4 is an example ofa process that changes phases without crossing the vapor-pressurecurve. Pure components actually exist as a saturated “liquid” and“vapor” only along the vapor-pressure curve. At other pressures andtemperatures, the component only behaves “liquid-like” or “vapor-like,” depending on the location of the system temperature and pres-sure relative to the system’s critical point. Katz28 suggested callinga pure substance “single-phase fluid” at pressures greater than thecritical pressure. Strictly speaking, the terms liquid-like and vapor-like should be used to describe undersaturated fluids.
6 PHASE BEHAVIOR
Fig. 2.5—Three-dimensional schematic of the PVT surface of apure compound (source unknown).
Fig. 2.726 shows a p-V diagram for ethane. The area enclosed bythe saturation envelope represents the two-phase region. The areato the left of the envelope is the liquid-like region, and the area tothe right is the vapor-like region. Point C represents the criticalpoint. The saturation curve to the left of the critical point (from PointA to Point C) defines the bubblepoint curve, along which the com-
ponent is a saturated liquid. Similarly, the saturation curve to theright of the critical point (Point B to Point C) defines the dewpointcurve, along which the component is a saturated vapor.
For any temperature less than the critical temperature, successivedecreases in volume will elevate the pressure of the vapor until the“dewpoint” (vapor pressure) is reached (Point B on Fig. 2.7). Atthese conditions, the component is a saturated vapor in equilibriumwith an infinitesimal amount of saturated liquid. Further decreasesin the volume at constant temperature will result in proportionate in-creases in the amount of saturated liquid condensed, but the pressuredoes not change (i.e., the system pressure remains equal to the vaporpressure). While more liquid is being formed, the total volume (atPoint D) is being reduced. However, the densities and other inten-sive properties of the saturated vapor and saturated liquid remainconstant as a consequence of the Gibbs phase rule.
A simple mass balance further shows that the ratio of liquid to va-por equals the ratio of Curve B–D to Curve D–A. Further decreasesin volume will condense more liquid until the bubblepoint isreached. At the bubblepoint, the system is 100% saturated liquid inequilibrium with an infinitesimal amount of saturated vapor. Furtherdecreases in volume beyond the bubblepoint are accompanied by alarge increase in pressure because the liquid is only slightly com-pressible. This is indicated by the nearly vertical isotherms on theleft side of Fig. 2.7. In the undersaturated vapor region on the rightside of the diagram, a large change in volume reduces pressure onlyslightly because the vapor is highly compressible.
2.3.2 Two-Component Systems. Two-component systems areslightly more complex than single-component systems becauseboth temperature and pressure affect phase behavior in the saturatedregion. Two important differences between single- and two-compo-nent systems exist. The saturated p-T projection is represented by aphase envelope rather than by a vapor-pressure curve, and the criti-
Fig. 2.6—Continuity of vapor and liquid states for a single component along the vapor-pressure curveand at supercritical conditions (after Katz and Kurata27).
00 100 200 300 400 500 600
Temperature, °F
3,000
2,000
1,000
VOLUMETRIC AND PHASE BEHAVIOR OF OIL AND GAS SYSTEMS 7
Fig. 2.7—p-V diagram for ethane at three temperatures (fromStanding26).
������ � ���� �������
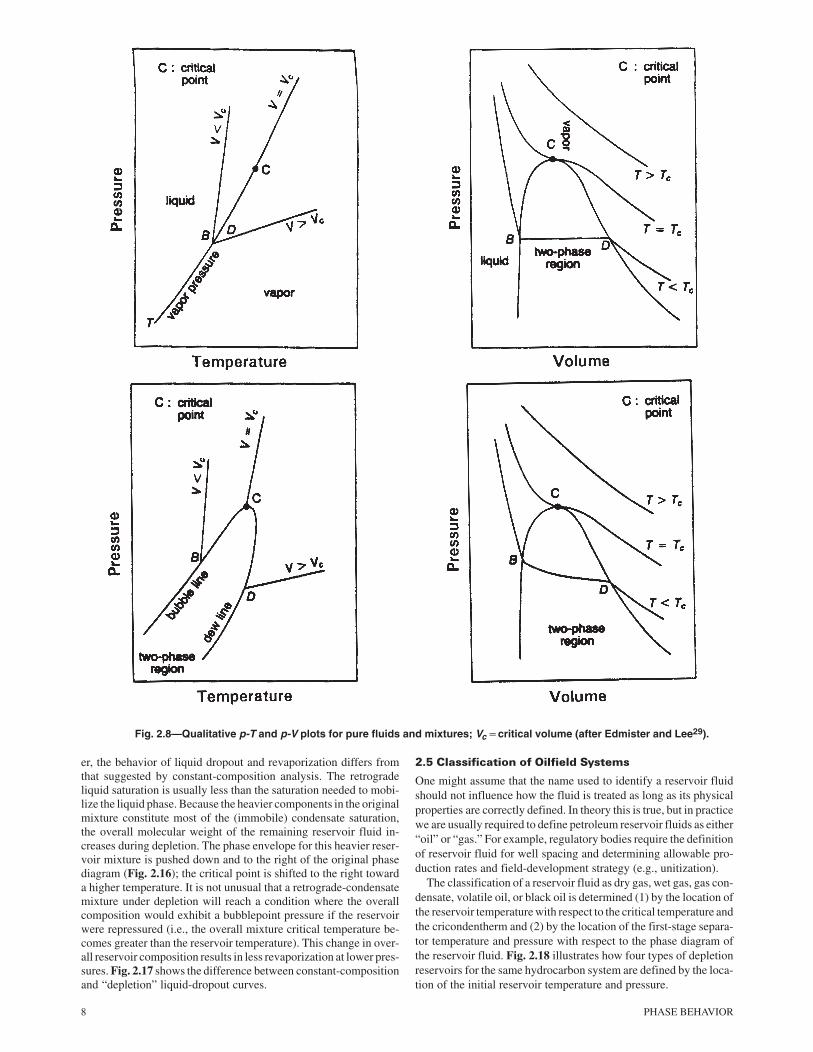
cal temperature and critical pressure no longer define the extent ofthe two-phase, vapor/liquid region. Fig. 2.829 compares the p-T andp-V behavior of pure compounds and mixtures.
Fig. 2.926 is a p-T projection of the ethane/n-heptane system fora fixed composition. For a single-component system, the dew- andbubblepoint curves are one in the same; i.e., they coincide with thevapor-pressure curve. In a binary (or other multicomponent) sys-tem, the dew- and bubblepoint curves no longer coincide, and aphase envelope results instead of a vapor-pressure curve. To the leftof the phase envelope, the mixture behaves liquid-like, and to theright it behaves vapor-like.
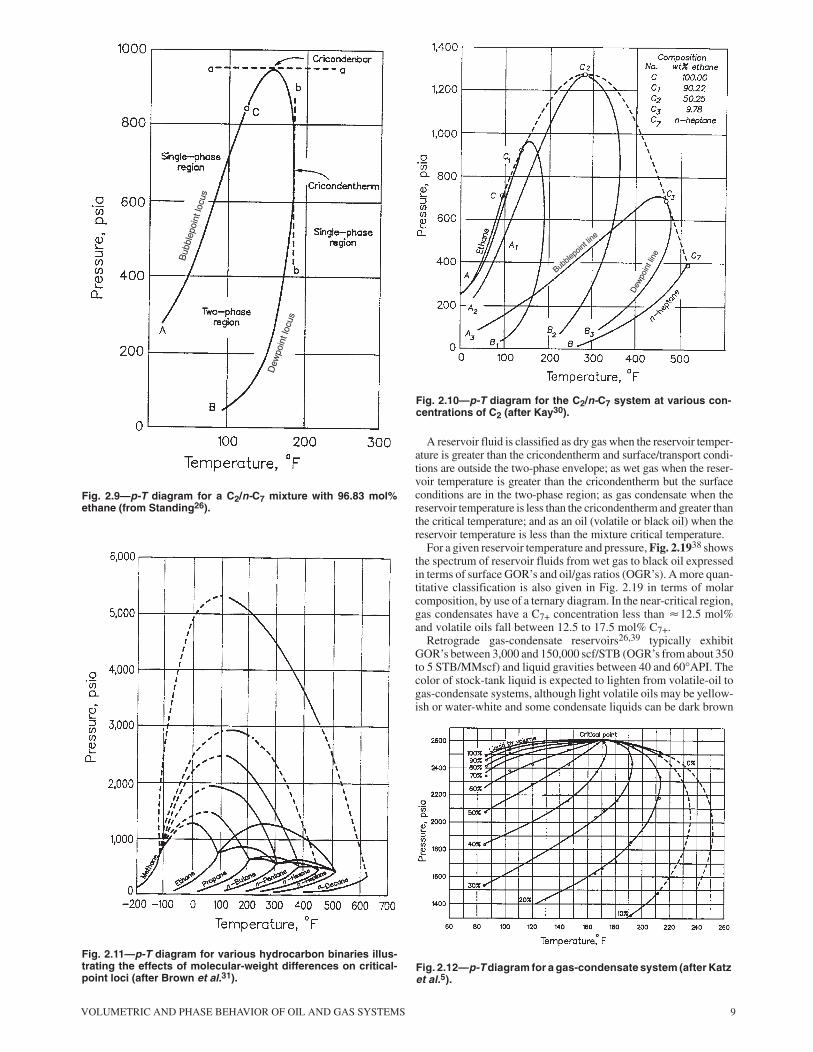
For binary or other multicomponent systems, the critical tempera-ture and pressure are defined as the point where the dew- and bub-blepoint curves intersect. At this point, the equilibrium phases arephysically indistinguishable. Also, in contrast to the single-compo-nent system, two phases can exist at temperatures and pressuresgreater than the critical temperature and pressure. The highest tem-perature at which two phases can coexist in equilibrium is definedas the cricondentherm (Tangent b–b in Fig. 2.9). Similarly, the high-est pressure at which two phases can coexist is defined as the cricon-denbar (Tangent a–a).
In the single-phase region, vapor and liquid are distinguishedonly by their densities and other physical properties. The region justbeyond the critical point of a mixture has often been called the “su-percritical” or “dense-fluid” region. Here, the fluid is considered tobe neither gas nor liquid because the fluid properties are not strictlyliquid-like or vapor-like.
Kay30 measured the phase behavior of the binary ethane/n-hep-tane system for several compositions, as Fig. 2.10 shows. On the leftside of this figure, the curve terminating at Point C is the vapor pres-sure of pure ethane; the curve on the right, terminating at Point C7,is the vapor pressure of pure n-heptane. Points C1 through C3 arethe critical points of ethane/n-heptane mixtures at different com-positions. The dashed line represents the locus of critical points forthe infinite number of possible ethane/n-heptane mixtures. Eachmixture composition has its own p-T phase envelope.
The three compositions shown, which are 90.22, 50.25, and 9.78wt% ethane, represent a system that is mainly ethane, a system thatis one-half ethane and one-half n-heptane (by weight), and a systemthat is mainly n-heptane, respectively. Several interesting featuresof binary and multicomponent systems can be studied from thesethree mixtures. As composition changes, the location of the criticalpoint and the shape of the p-T phase diagram also change.
Note that the critical pressures of many (but not all) mixtures arehigher than the critical pressures of the components composing the
mixture. With a mixture composed mainly of ethane, the criticalpoint lies to the left of the cricondentherm. Such a system is analo-gous to a reservoir gas-condensate system. As the percentage ofethane in the mixture increases further, the critical point of the sys-tem approaches that of pure ethane.
The critical point for the mixture composed mostly of n-heptanelies below the cricondenbar. This system is analogous to a reservoirblack-oil system. As the percentage of n-heptane increases, the criti-cal point of the mixture approaches that of pure n-heptane. Withequal percentages of ethane and n-heptane, the critical pressure isclose to the cricondenbar of ethane and n-heptane. As the concentra-tion of each component becomes similar, the two-phase region be-comes larger.
Other binaries provide additional insight into the effect of widelydiffering boiling points of the components making up the system.Fig. 2.1131 shows the vapor pressure of several hydrocarbons andthe critical loci of their binary mixtures with methane. As the boilingpoints of the methane/hydrocarbon binary become more dissimilar,the two-phase region becomes larger and the critical pressure in-creases. For binaries with components that have similar molecularstructures, the loci of critical points are relatively flat.
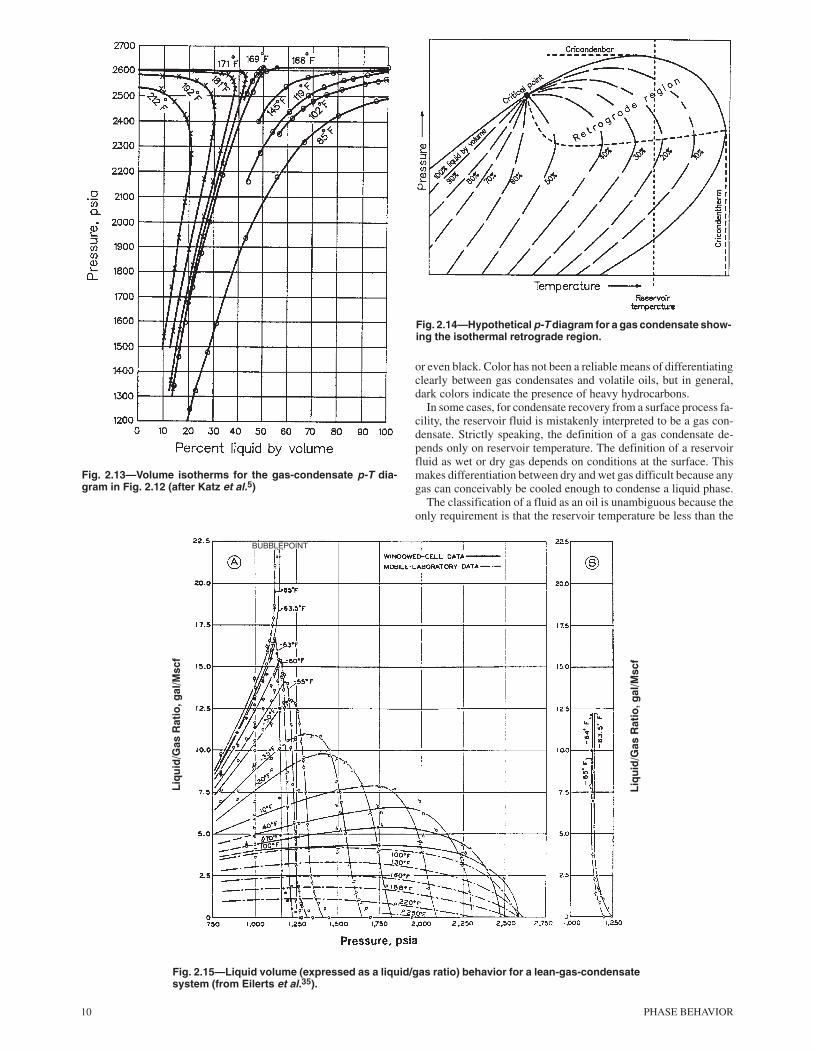
2.3.3 Multicomponent Systems. Phase diagrams for naturally oc-curring reservoir fluids are similar to those for binary mixtures. Fig.2.125 is the first p-T phase diagram measured for a complex gas-condensate system. This p-T diagram is particularly useful becauseit exhibits oil-like to gas-like behavior over a range of typical reser-voir temperatures, from 80 to 240°F. Katz and coworkers32 used aglass-windowed cell to measure the distribution of gas and liquidphases throughout the two-phase region and near the mixture’s criti-cal point. Fig. 2.135 shows isotherms of volume percent vs. pressurethat were measured to determine the two-phase boundary and thevolume-percent quality lines in the p-T diagram in Fig. 2.12.
��$ ����#���� ����������
Kurata and Katz33 give the most concise and relevant discussion ofretrograde phenomena related to petroleum engineering. In 1892,Kuenen34 used the term “retrograde condensation” to describe theanomalous behavior of a mixture that forms a liquid by an isother-mal decrease in pressure or by an isobaric increase in temperature.Conversely, “retrograde vaporization” can be used to describe theformation of vapor by an isothermal increase in pressure or by anisobaric decrease in temperature. Neither form of retrograde behav-ior occurs in single-component systems.
Fig. 2.14 is a constant-composition p-T projection of a multicom-ponent system. The diagram shows lines of constant liquid volumepercent (quality). Although total composition is fixed, the respec-tive compositions of saturated vapor and liquid phases change alongthe quality lines. The bubblepoint curve represents the locus of100% liquid, and the dewpoint curve represents the locus of 0% liq-uid. The bubble- and dewpoint curves meet at the mixture criticalpoint. Lines of constant quality also converge at the mixture criticalpoint. The regions of retrograde behavior are defined by the lines ofconstant quality that exhibit a maximum with respect to temperatureor pressure. Fig. 2.14 shows that for retrograde phenomena to occur,the temperature must be between the critical temperature and thecricondentherm. Fig. 2.1535 illustrates the liquid volumetric behav-ior of a lean gas-condensate system measured by Eilerts et al.35-37
Fig. 2.12 shows the p-T diagram of a reservoir mixture that wouldbe considered a gas condensate if it had been discovered at a reservoirtemperature of, for example, 200°F and an initial pressure of 2,700psia. For these initial conditions, if reservoir pressure drops below2,560 psia from depletion, the dewpoint will be passed and a liquidphase will develop in the reservoir. Liquid dropout will continue toincrease until the pressure reaches 2,300 psia, when a maximum of25 vol% liquid will have accumulated. According to Fig. 2.12, furtherpressure reduction will revaporize most of the condensed liquid.
These comments assume that the overall composition of the res-ervoir mixture remains constant during depletion, a reasonable as-sumption in the context of this general discussion. In reality, howev-
8 PHASE BEHAVIOR
Fig. 2.8—Qualitative p-T and p-V plots for pure fluids and mixtures; Vc�critical volume (after Edmister and Lee29).
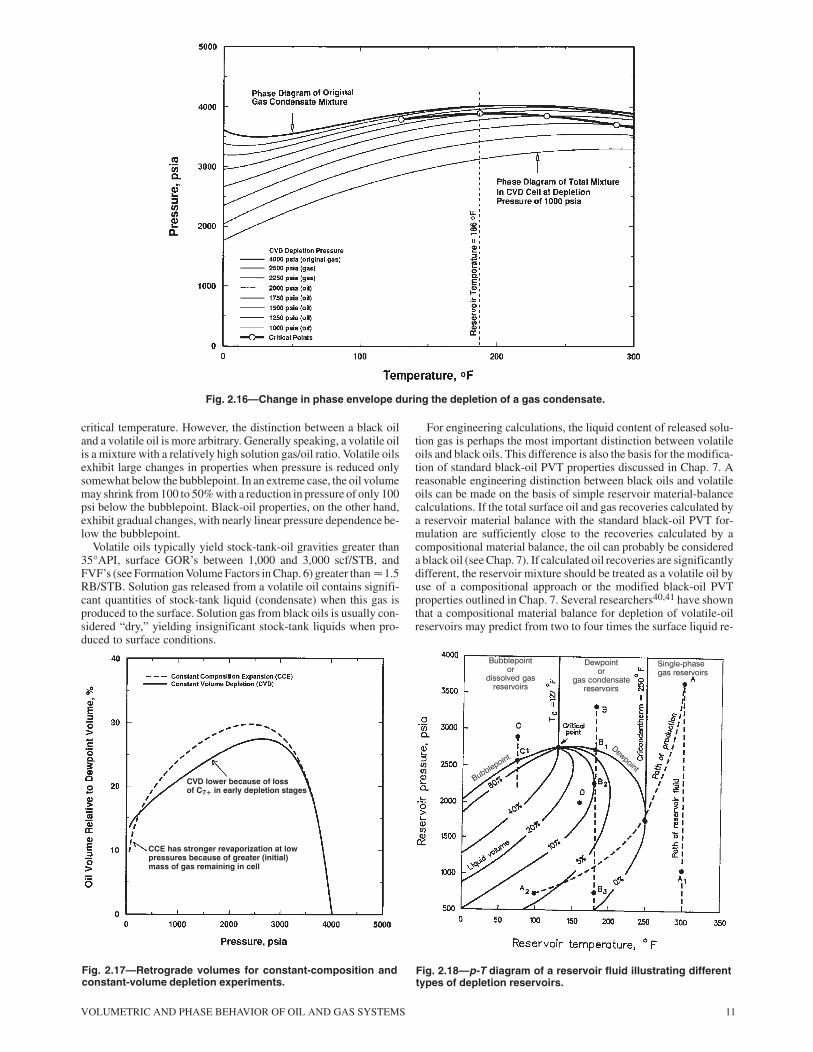
er, the behavior of liquid dropout and revaporization differs fromthat suggested by constant-composition analysis. The retrogradeliquid saturation is usually less than the saturation needed to mobi-lize the liquid phase. Because the heavier components in the originalmixture constitute most of the (immobile) condensate saturation,the overall molecular weight of the remaining reservoir fluid in-creases during depletion. The phase envelope for this heavier reser-voir mixture is pushed down and to the right of the original phasediagram (Fig. 2.16); the critical point is shifted to the right towarda higher temperature. It is not unusual that a retrograde-condensatemixture under depletion will reach a condition where the overallcomposition would exhibit a bubblepoint pressure if the reservoirwere repressured (i.e., the overall mixture critical temperature be-comes greater than the reservoir temperature). This change in over-all reservoir composition results in less revaporization at lower pres-sures. Fig. 2.17 shows the difference between constant-compositionand “depletion” liquid-dropout curves.
��% ������������� � �������� ����� �
One might assume that the name used to identify a reservoir fluidshould not influence how the fluid is treated as long as its physicalproperties are correctly defined. In theory this is true, but in practicewe are usually required to define petroleum reservoir fluids as either“oil” or “gas.” For example, regulatory bodies require the definitionof reservoir fluid for well spacing and determining allowable pro-duction rates and field-development strategy (e.g., unitization).
The classification of a reservoir fluid as dry gas, wet gas, gas con-densate, volatile oil, or black oil is determined (1) by the location ofthe reservoir temperature with respect to the critical temperature andthe cricondentherm and (2) by the location of the first-stage separa-tor temperature and pressure with respect to the phase diagram ofthe reservoir fluid. Fig. 2.18 illustrates how four types of depletionreservoirs for the same hydrocarbon system are defined by the loca-tion of the initial reservoir temperature and pressure.
VOLUMETRIC AND PHASE BEHAVIOR OF OIL AND GAS SYSTEMS 9
Fig. 2.9—p-T diagram for a C2/n-C7 mixture with 96.83 mol%ethane (from Standing26).
Fig. 2.11—p-T diagram for various hydrocarbon binaries illus-trating the effects of molecular-weight differences on critical-point loci (after Brown et al.31).
Fig. 2.10—p-T diagram for the C2/n-C7 system at various con-centrations of C2 (after Kay30).
A reservoir fluid is classified as dry gas when the reservoir temper-ature is greater than the cricondentherm and surface/transport condi-tions are outside the two-phase envelope; as wet gas when the reser-voir temperature is greater than the cricondentherm but the surfaceconditions are in the two-phase region; as gas condensate when thereservoir temperature is less than the cricondentherm and greater thanthe critical temperature; and as an oil (volatile or black oil) when thereservoir temperature is less than the mixture critical temperature.
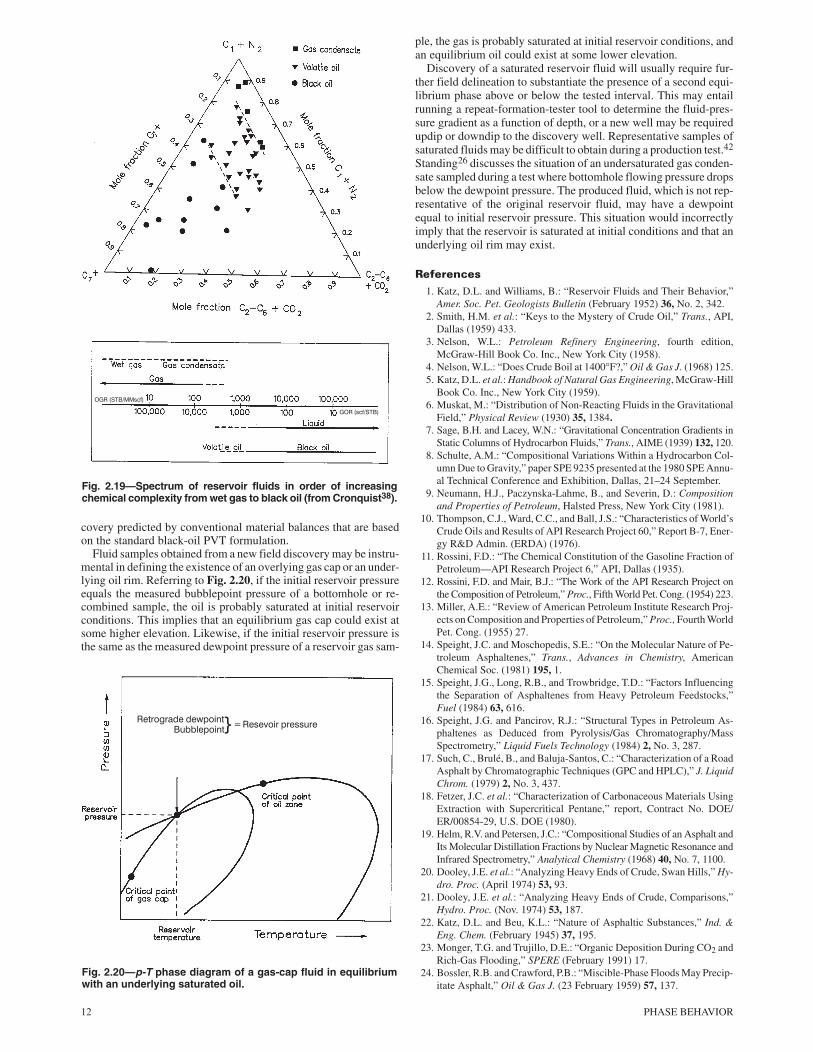
For a given reservoir temperature and pressure, Fig. 2.1938 showsthe spectrum of reservoir fluids from wet gas to black oil expressedin terms of surface GOR’s and oil/gas ratios (OGR’s). A more quan-titative classification is also given in Fig. 2.19 in terms of molarcomposition, by use of a ternary diagram. In the near-critical region,gas condensates have a C7+ concentration less than �12.5 mol%and volatile oils fall between 12.5 to 17.5 mol% C7+.
Retrograde gas-condensate reservoirs26,39 typically exhibitGOR’s between 3,000 and 150,000 scf/STB (OGR’s from about 350to 5 STB/MMscf) and liquid gravities between 40 and 60°API. Thecolor of stock-tank liquid is expected to lighten from volatile-oil togas-condensate systems, although light volatile oils may be yellow-ish or water-white and some condensate liquids can be dark brown
Fig. 2.12—p-T diagram for a gas-condensate system (after Katzet al.5).
10 PHASE BEHAVIOR
Fig. 2.13—Volume isotherms for the gas-condensate p-T dia-gram in Fig. 2.12 (after Katz et al.5)
Fig. 2.14—Hypothetical p-T diagram for a gas condensate show-ing the isothermal retrograde region.
or even black. Color has not been a reliable means of differentiatingclearly between gas condensates and volatile oils, but in general,dark colors indicate the presence of heavy hydrocarbons.
In some cases, for condensate recovery from a surface process fa-cility, the reservoir fluid is mistakenly interpreted to be a gas con-densate. Strictly speaking, the definition of a gas condensate de-pends only on reservoir temperature. The definition of a reservoirfluid as wet or dry gas depends on conditions at the surface. Thismakes differentiation between dry and wet gas difficult because anygas can conceivably be cooled enough to condense a liquid phase.
The classification of a fluid as an oil is unambiguous because theonly requirement is that the reservoir temperature be less than the
Fig. 2.15—Liquid volume (expressed as a liquid/gas ratio) behavior for a lean-gas-condensatesystem (from Eilerts et al.35).
BUBBLEPOINT
VOLUMETRIC AND PHASE BEHAVIOR OF OIL AND GAS SYSTEMS 11
Fig. 2.16—Change in phase envelope during the depletion of a gas condensate.
critical temperature. However, the distinction between a black oiland a volatile oil is more arbitrary. Generally speaking, a volatile oilis a mixture with a relatively high solution gas/oil ratio. Volatile oilsexhibit large changes in properties when pressure is reduced onlysomewhat below the bubblepoint. In an extreme case, the oil volumemay shrink from 100 to 50% with a reduction in pressure of only 100psi below the bubblepoint. Black-oil properties, on the other hand,exhibit gradual changes, with nearly linear pressure dependence be-low the bubblepoint.
Volatile oils typically yield stock-tank-oil gravities greater than35°API, surface GOR’s between 1,000 and 3,000 scf/STB, andFVF’s (see Formation Volume Factors in Chap. 6) greater than �1.5RB/STB. Solution gas released from a volatile oil contains signifi-cant quantities of stock-tank liquid (condensate) when this gas isproduced to the surface. Solution gas from black oils is usually con-sidered “dry,” yielding insignificant stock-tank liquids when pro-duced to surface conditions.
Fig. 2.17—Retrograde volumes for constant-composition andconstant-volume depletion experiments.
��� ����� ��� � �� �� �� ��� �� ����� ��������� ����
CCE has stronger revaporization at lowpressures because of greater (initial)mass of gas remaining in cell
For engineering calculations, the liquid content of released solu-tion gas is perhaps the most important distinction between volatileoils and black oils. This difference is also the basis for the modifica-tion of standard black-oil PVT properties discussed in Chap. 7. Areasonable engineering distinction between black oils and volatileoils can be made on the basis of simple reservoir material-balancecalculations. If the total surface oil and gas recoveries calculated bya reservoir material balance with the standard black-oil PVT for-mulation are sufficiently close to the recoveries calculated by acompositional material balance, the oil can probably be considereda black oil (see Chap. 7). If calculated oil recoveries are significantlydifferent, the reservoir mixture should be treated as a volatile oil byuse of a compositional approach or the modified black-oil PVTproperties outlined in Chap. 7. Several researchers40,41 have shownthat a compositional material balance for depletion of volatile-oilreservoirs may predict from two to four times the surface liquid re-
Fig. 2.18—p-T diagram of a reservoir fluid illustrating differenttypes of depletion reservoirs.
������ ���
�
���� ��� ���
���� ���
��� ���
�
��� � ������
���� ���
���������
��� ���� ���
12 PHASE BEHAVIOR
Fig. 2.19—Spectrum of reservoir fluids in order of increasingchemical complexity from wet gas to black oil (from Cronquist38).
��� � ��!!���"
��� ����� �"
covery predicted by conventional material balances that are basedon the standard black-oil PVT formulation.
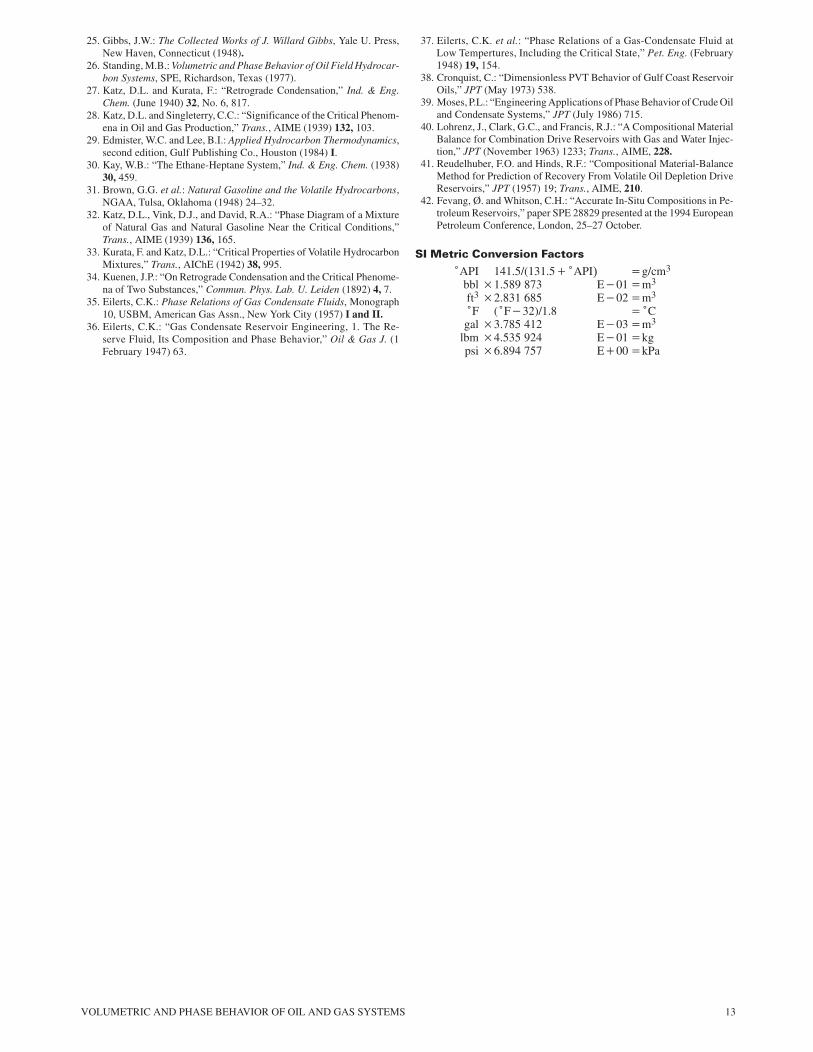
Fluid samples obtained from a new field discovery may be instru-mental in defining the existence of an overlying gas cap or an under-lying oil rim. Referring to Fig. 2.20, if the initial reservoir pressureequals the measured bubblepoint pressure of a bottomhole or re-combined sample, the oil is probably saturated at initial reservoirconditions. This implies that an equilibrium gas cap could exist atsome higher elevation. Likewise, if the initial reservoir pressure isthe same as the measured dewpoint pressure of a reservoir gas sam-
Fig. 2.20—p-T phase diagram of a gas-cap fluid in equilibriumwith an underlying saturated oil.
��� ���� ��� ���
������ ���#��� �� ������$
ple, the gas is probably saturated at initial reservoir conditions, andan equilibrium oil could exist at some lower elevation.
Discovery of a saturated reservoir fluid will usually require fur-ther field delineation to substantiate the presence of a second equi-librium phase above or below the tested interval. This may entailrunning a repeat-formation-tester tool to determine the fluid-pres-sure gradient as a function of depth, or a new well may be requiredupdip or downdip to the discovery well. Representative samples ofsaturated fluids may be difficult to obtain during a production test.42
Standing26 discusses the situation of an undersaturated gas conden-sate sampled during a test where bottomhole flowing pressure dropsbelow the dewpoint pressure. The produced fluid, which is not rep-resentative of the original reservoir fluid, may have a dewpointequal to initial reservoir pressure. This situation would incorrectlyimply that the reservoir is saturated at initial conditions and that anunderlying oil rim may exist.
����������
1. Katz, D.L. and Williams, B.: “Reservoir Fluids and Their Behavior,”Amer. Soc. Pet. Geologists Bulletin (February 1952) 36, No. 2, 342.
2. Smith, H.M. et al.: “Keys to the Mystery of Crude Oil,” Trans., API,Dallas (1959) 433.
3. Nelson, W.L.: Petroleum Refinery Engineering, fourth edition,McGraw-Hill Book Co. Inc., New York City (1958).
4. Nelson, W.L.: “Does Crude Boil at 1400°F?,” Oil & Gas J. (1968) 125.5. Katz, D.L. et al.: Handbook of Natural Gas Engineering, McGraw-Hill
Book Co. Inc., New York City (1959).6. Muskat, M.: “Distribution of Non-Reacting Fluids in the Gravitational
Field,” Physical Review (1930) 35, 1384.7. Sage, B.H. and Lacey, W.N.: “Gravitational Concentration Gradients in
Static Columns of Hydrocarbon Fluids,” Trans., AIME (1939) 132, 120.8. Schulte, A.M.: “Compositional Variations Within a Hydrocarbon Col-
umn Due to Gravity,” paper SPE 9235 presented at the 1980 SPE Annu-al Technical Conference and Exhibition, Dallas, 21–24 September.
9. Neumann, H.J., Paczynska-Lahme, B., and Severin, D.: Compositionand Properties of Petroleum, Halsted Press, New York City (1981).
10. Thompson, C.J., Ward, C.C., and Ball, J.S.: “Characteristics of World’sCrude Oils and Results of API Research Project 60,” Report B-7, Ener-gy R&D Admin. (ERDA) (1976).
11. Rossini, F.D.: “The Chemical Constitution of the Gasoline Fraction ofPetroleum—API Research Project 6,” API, Dallas (1935).
12. Rossini, F.D. and Mair, B.J.: “The Work of the API Research Project onthe Composition of Petroleum,” Proc., Fifth World Pet. Cong. (1954) 223.
13. Miller, A.E.: “Review of American Petroleum Institute Research Proj-ects on Composition and Properties of Petroleum,” Proc., Fourth WorldPet. Cong. (1955) 27.
14. Speight, J.C. and Moschopedis, S.E.: “On the Molecular Nature of Pe-troleum Asphaltenes,” Trans., Advances in Chemistry, AmericanChemical Soc. (1981) 195, 1.
15. Speight, J.G., Long, R.B., and Trowbridge, T.D.: “Factors Influencingthe Separation of Asphaltenes from Heavy Petroleum Feedstocks,”Fuel (1984) 63, 616.
16. Speight, J.G. and Pancirov, R.J.: “Structural Types in Petroleum As-phaltenes as Deduced from Pyrolysis/Gas Chromatography/MassSpectrometry,” Liquid Fuels Technology (1984) 2, No. 3, 287.
17. Such, C., Brulé, B., and Baluja-Santos, C.: “Characterization of a RoadAsphalt by Chromatographic Techniques (GPC and HPLC),” J. LiquidChrom. (1979) 2, No. 3, 437.
18. Fetzer, J.C. et al.: “Characterization of Carbonaceous Materials UsingExtraction with Supercritical Pentane,” report, Contract No. DOE/ER/00854-29, U.S. DOE (1980).
19. Helm, R.V. and Petersen, J.C.: “Compositional Studies of an Asphalt andIts Molecular Distillation Fractions by Nuclear Magnetic Resonance andInfrared Spectrometry,” Analytical Chemistry (1968) 40, No. 7, 1100.
20. Dooley, J.E. et al.: “Analyzing Heavy Ends of Crude, Swan Hills,” Hy-dro. Proc. (April 1974) 53, 93.
21. Dooley, J.E. et al.: “Analyzing Heavy Ends of Crude, Comparisons,”Hydro. Proc. (Nov. 1974) 53, 187.
22. Katz, D.L. and Beu, K.L.: “Nature of Asphaltic Substances,” Ind. &Eng. Chem. (February 1945) 37, 195.
23. Monger, T.G. and Trujillo, D.E.: “Organic Deposition During CO2 andRich-Gas Flooding,” SPERE (February 1991) 17.
24. Bossler, R.B. and Crawford, P.B.: “Miscible-Phase Floods May Precip-itate Asphalt,” Oil & Gas J. (23 February 1959) 57, 137.
VOLUMETRIC AND PHASE BEHAVIOR OF OIL AND GAS SYSTEMS 13
25. Gibbs, J.W.: The Collected Works of J. Willard Gibbs, Yale U. Press,New Haven, Connecticut (1948).
26. Standing, M.B.: Volumetric and Phase Behavior of Oil Field Hydrocar-bon Systems, SPE, Richardson, Texas (1977).
27. Katz, D.L. and Kurata, F.: “Retrograde Condensation,” Ind. & Eng.Chem. (June 1940) 32, No. 6, 817.
28. Katz, D.L. and Singleterry, C.C.: “Significance of the Critical Phenom-ena in Oil and Gas Production,” Trans., AIME (1939) 132, 103.
29. Edmister, W.C. and Lee, B.I.: Applied Hydrocarbon Thermodynamics,second edition, Gulf Publishing Co., Houston (1984) I.
30. Kay, W.B.: “The Ethane-Heptane System,” Ind. & Eng. Chem. (1938)30, 459.
31. Brown, G.G. et al.: Natural Gasoline and the Volatile Hydrocarbons,NGAA, Tulsa, Oklahoma (1948) 24–32.
32. Katz, D.L., Vink, D.J., and David, R.A.: “Phase Diagram of a Mixtureof Natural Gas and Natural Gasoline Near the Critical Conditions,”Trans., AIME (1939) 136, 165.
33. Kurata, F. and Katz, D.L.: “Critical Properties of Volatile HydrocarbonMixtures,” Trans., AIChE (1942) 38, 995.
34. Kuenen, J.P.: “On Retrograde Condensation and the Critical Phenome-na of Two Substances,” Commun. Phys. Lab. U. Leiden (1892) 4, 7.
35. Eilerts, C.K.: Phase Relations of Gas Condensate Fluids, Monograph10, USBM, American Gas Assn., New York City (1957) I and II.
36. Eilerts, C.K.: “Gas Condensate Reservoir Engineering, 1. The Re-serve Fluid, Its Composition and Phase Behavior,” Oil & Gas J. (1February 1947) 63.
37. Eilerts, C.K. et al.: “Phase Relations of a Gas-Condensate Fluid atLow Tempertures, Including the Critical State,” Pet. Eng. (February1948) 19, 154.
38. Cronquist, C.: “Dimensionless PVT Behavior of Gulf Coast ReservoirOils,” JPT (May 1973) 538.
39. Moses, P.L.: “Engineering Applications of Phase Behavior of Crude Oiland Condensate Systems,” JPT (July 1986) 715.
40. Lohrenz, J., Clark, G.C., and Francis, R.J.: “A Compositional MaterialBalance for Combination Drive Reservoirs with Gas and Water Injec-tion,” JPT (November 1963) 1233; Trans., AIME, 228.
41. Reudelhuber, F.O. and Hinds, R.F.: “Compositional Material-BalanceMethod for Prediction of Recovery From Volatile Oil Depletion DriveReservoirs,” JPT (1957) 19; Trans., AIME, 210.
42. Fevang, Ø. and Whitson, C.H.: “Accurate In-Situ Compositions in Pe-troleum Reservoirs,” paper SPE 28829 presented at the 1994 EuropeanPetroleum Conference, London, 25–27 October.
�� &����� �������� �����
�API 141.5/(131.5��API� �g/cm3
bbl �1.589 873 E�01�m3
ft3 �2.831 685 E�02�m3
�F (�F�32)/1.8 ��Cgal �3.785 412 E�03�m3
lbm �4.535 924 E�01�kgpsi �6.894 757 E�00�kPa