) cultivars to water stress - - ResearchOnline@JCU
387
This file is part of the following reference: Saraswati, Prabawardani (2007) Physiological and growth responses of selected sweet potato (Ipomoea batatas (L.) Lam.) cultivars to water stress. PhD thesis, James Cook University. Access to this file is available from: http://eprints.jcu.edu.au/29800/ The author has certified to JCU that they have made a reasonable effort to gain permission and acknowledge the owner of any third party copyright material included in this document. If you believe that this is not the case, please contact [email protected] and quote http://eprints.jcu.edu.au/29800/ ResearchOnline@JCU
Transcript of ) cultivars to water stress - - ResearchOnline@JCU

This file is part of the following reference:
Saraswati, Prabawardani (2007) Physiological and
growth responses of selected sweet potato (Ipomoea
batatas (L.) Lam.) cultivars to water stress. PhD thesis,
James Cook University.
Access to this file is available from:
http://eprints.jcu.edu.au/29800/
The author has certified to JCU that they have made a reasonable effort to gain
permission and acknowledge the owner of any third party copyright material
included in this document. If you believe that this is not the case, please contact
[email protected] and quote http://eprints.jcu.edu.au/29800/
ResearchOnline@JCU

PHYSIOLOGICAL AND GROWTH RESPONSES OF SELECTED SWEET POTATO
(Ipomoea batatas (L.) Lam.) CULTIVARS TO WATER STRESS
Thesis submitted by
Saraswati Prabawardani (Ir, Cenderawasih University, Indonesia;
M.Sc, University of the Philippines, Los Banos, Philippines)
in June 2007
For the degree of Doctor of Philosophy in Tropical Plant Sciences
within the School of Marine and Tropical Biology James Cook University

STATEMENT OF ACCESS
I, the undersigned, the author of this thesis, understand that James Cook University will
make this thesis available for use within the University Library and, via the Australian
Digital Theses network (unless granted an exemption), for use elsewhere.
I understand that, as an unpublished work, a thesis has significant protection under the
Copyright Act and;
I do not wish to place any further restriction on access to work.
………………………………. ……………………………… Saraswati Prabawardani
ii

STATEMENT ON SOURCES
DECLARATION
I declare that this thesis is my own work and has not been submitted in any form for
another degree or diploma at any other university or other institution of tertiary
education. Information derived from the published or unpublished work of others has
been acknowledged in the text and a list of references is given.
………………………………… ….……………………………. Saraswati Prabawardani
iii

ELECTRONIC COPY
I, the undersigned, the author of this work, declare that the electronic copy of this thesis
provided to the James Cook University Library is an accurate copy of the print thesis
submitted, within the limits of the technology available.
…………………………………… …………………………………. Saraswati Prabawardani
iv

ACKNOWLEDGEMENTS
I would like to express my sincere appreciation to the following organizations and
people who have provided assistance and encouragement throughout the course of this
study.
Australian Agency for International Development (AusAID) and their Liaison Officer at
JCU, Mr Alex Salvador for providing and administrating the PhD scholarship that
enabled the study to proceed.
Dr Mark Johnston (principal supervisor), Assoc Prof Ross Coventry and Dr Joseph
Holtum (associate supervisors) for their invaluable guidance and assistance throughout
the course of this study. A special thanks is addressed to the late Assoc Prof Peter
Brownell for his helpful advice and support during the early stages of the project.
Prof Richard Pearson (Head, School of Marine and Tropical Biology, JCU) for his
support for the study. Dr Robert Congdon, JCU, for his suggestions in the nutrient use
aspects, and Dr Jane O’Sullivan (School of Land and Food Sciences, the University of
Queensland) for providing the plant materials and invaluable suggestions for the
nutrient trial and correction for a part of the thesis manuscript.
Mr Chris Gardiner for his assistance and support for the research and manuscript
preparation. Mrs Sue Reilly for her assistance in the use of electron microscope. Mr
Vincent Pullella and Mr Gordon Bailey for their help in the computer problems.
v

Mr Graham Kerven (Analytical Services, School of Land and Food Sciences, University
of Queensland) for his assistance in conducting tuber organic analysis, and also Mr
David Donald for the statistical help.
The Government of Papua Province and Manokwari District Regency, University of
Papua, Manokwari for granting me study leave and to pursue this study. The
International Potato Centre (CIP-ESEAP) Bogor, Indonesia, through Mrs Cecilia A.
Widyastuti provided the assistance during my research, and Mr. Alexander Yaku, and
Mrs Irnanda Djuuna for their help.
Mila, Ramon, Margaret for friendship and help. Obed, Ferry, Jack, Titin, Piter, Made,
Patrice, Mercy, Mudji, Yusuf and their families, Nonny, Win, Plato, and Linda
Lindongi for help, friendship and prayers. Kathy and Matthew, Lowell and Jeff, Dagona
and Ron for support and prayers.
My husband, Fred, for invaluable help throughout the whole of the research project
preparation, maintenance, data collection, data analysis, and writing. My children
(Andre, Indra and Fiona), and my parents for their encouragement, support and prayers
throughout the course of this study. I dedicate this thesis to them, with love.
vi

ABSTRACT
Drought is one of the most serious environmental problems affecting sweet potato
(Ipomoea batatas (L.) Lam.) growth and yield in many tropical countries including
Highland Papua of Eastern Indonesia, where it is grown as a staple crop under rainfed
conditions. Some genotypes survive during drought, while many others fail. This
condition regularly devastates sweet potato growth and threatens the lives of highland
Papuan people. On the other hand, research into the effects of drought and on the
growth, yield, and water relations of sweet potato remains limited. A series of pot and
field trials therefore was conducted to identify the drought tolerance of sweet potato
cultivars available in Australia. The influence of soil water regimes on the physiology,
growth, and yield of sweet potato was studied to determine the critical soil water levels
that sweet potato could tolerate and produce acceptable yields. The influence of nutrient
supply (N and K) on water use efficiency in sweet potato was also studied. A grafting
trial was carried out to examine the nature of the physiological signal between shoot and
root in relation to transpiration efficiency and yield responses in sweet potato.
The cultivars Lole and Hawaii showed more strongly developed drought resistant
characters than all of the other cultivars. They have better water use efficiency, maintain
higher plant water status under drought stress by delaying wilting, and lower percentage
decrease in leaf water potential indicating their greater tolerance to water stress at the
stage of vegetative growth.
Field trials were conducted to determine tuber yields from the same 15 sweet potato
cultivars under well-watered conditions. The Lole and Hawaii cultivars produced low
vii
tuber yields, whereas the Beerwah Gold and Wanmun cultivars produced the greatest
yields when not water stressed.
The Lole cultivar representing the vegetative tolerant and Wanmun cv representing the
susceptible genotypes were grown in a glasshouse to observe the degree to which sweet
potato cultivars could withstand water stress conditions and still produce good tuber
yields. The Wanmun cultivar, which grew and produced good yields under well-watered
conditions, was strongly affected by water stress. On the other hand, the Lole cultivar
showed more drought tolerance, indicated by greater plant water status, including leaf
water potential and relative water contents. At maturity, tuber sucrose contents
increased while the starch contents decreased. Under drought conditions, cv Lole tubers
had higher sucrose and lower starch contents than cv Wanmun. Tuber yields were
greater in cv Wanmun when not stressed; Lole on the other hand produced marketable
tuber size when water was restricted to ≥ 40% of soil field capacity. The overall results
suggested greater drought tolerance of the Lole cultivar.
Results of a study of the influence of nitrogen and potassium on water stress and
productivity showed that a greater nitrogen supply resulted in greater shoot dry weight,
leaf weight, and leaf area. Increasing the soil nitrogen content beyond 100 kg per ha
reduced tuber yields, due to greater top growth and inefficient carbon translocation for
tuber development. Low soil nitrogen contents (20 kg of N/ha), on the other hand,
lowered the biomass production, reducing tuber formation and development. Potassium
had a significant effect in increasing tuber yields when nitrogen supply was optimal.
Although cv Wanmun consistently produced greater tuber yields than cv Lole under
well-watered conditions, the Lole cultivar supplied with 100 kg of N/ha and 160 kg of
viii

K/ha produced greater tuber yields under water stress. The lower transpiration under
higher soil potassium contents suggest that potassium plays an important role in
improving water use efficiency.
Grafting was conducted with the aim of producing plants that embody cv Lole’s
tolerance to drought and cv Wanmun’s high tuber yields. The results showed that
growth and physiological aspects of the Lole and Wanmun cultivars and their grafted
combinations decreased with water stress. Wanmun scions when grafted onto Lole
rootstocks grew very poorly, however, Lole scions grafted onto Wanmun rootstocks
grew well and produced higher tuber yields than the parent plants, especially under
water stressed conditions. Therefore, cv Wanmun and cv Lole are recommended to be
independently propagated under good rainfall and drought condition, respectively, and
combinations of drought tolerant cv Lole scions grafted onto good storage root capacity
of cv Wanmun rootstocks improved tuber yields under water stress condition.
Productivity of sweet potato, as measured by tuber production, was reduced by soil
water stress. Under well-watered conditions, cv Wanmun (drought sensitive) produced
high tuber yields. Nitrogen and potassium at optimal application levels increased yields
of both drought sensitive and tolerant cultivars under both well watered and water
stressed conditions. Under drought conditions, cv Lole (drought tolerant) produced
good tuber yields, and Lole scions grafted onto Wanmun rootstocks produced even
better tuber yields.
ix

The interactions between genotype and environmental constraints, including drought,
require further study to produce sweet potato cultivars with high tuber yield potentials
that are well suited to different local conditions.
x

TABLE OF CONTENTS
Page
Title i
Statement of access ii
Statement on sources declaration iii
Electronic copy iv
Acknowledgement v
Abstract vii
Table of contents xi
List of tables xvi
List of figures xix
Glossary and abbreviation xxvi
CHAPTER 1
GENERAL INTRODUCTION
1.1 Introduction to the research approach 11.2 Objectives of the thesis 31.3 The sweet potato 4 1.3.1 Introduction 4 1.3.2 Origin, distribution, and botany 4 1.3.3 Ecophysiology 61.4 Role of water in plants 8 1.4.1 Physiological functions 8 1.4.2 Plant water status 10 1.4.3 Water uptake by plants 121.5 Mechanisms of drought resistance 13 1.5.1 Drought escape 14 1.5.2 Drought avoidance 15 1.5.3 Drought tolerance 15 1.5.4 Drought recovery 161.6 Effect of drought on plant growth and development 17 1.6.1 Effect of drought on photosynthesis 17 1.6.2 Leaf area and canopy development 18 1.6.3 Root growth and tuber development 191.7 Drought tolerance mechanisms 19 1.7.1 Morphology and anatomy 20 1.7.2 Physiology 211.8 Implications of plant responses in improving water use efficiency 22
xi

1.8.1 Plant propagation strategy 22 1.8.2 Nutrient application 231.9 Nature of the present research 25 1.9.1 Research materials 25 1.9.2 Experimental sites and climatic conditions 26 1.9.3 Statistical analyses 261.10 Papers produced during the course of study 27
CHAPTER 2 IDENTIFICATION OF DROUGHT TOLERANT
SWEET POTATO CULTIVARS
2.1 Introduction 282.2 Materials and methods 30 2.2.1 Experimental sites and climatic conditions 30 2.2.2 Glasshouse trials 30 2.2.2.1 Experimental design 30 2.2.2.2 Research procedures 31 2.2.2.3 Experimental variables 33 2.2.3 Field trial with non-limiting water 35 2.2.3.1 Experimental design 35 2.2.3.2 Experimental procedure 36 2.2.3.3 Experimental variables 36 2.2.3.4 Statistical analyses 372.3 Results and discussion 37 2.3.1 Climatic conditions 37 2.3.2 Shadehouse Trial 39 2.3.2.1 Plant growth and morpho-physiological characters 39 2.3.2.1.1 Main stem length 40 2.3.2.1.2 Internode length and diameter 44 2.3.2.1.3 Dry biomass 45 2.3.2.1.4 Dry leaf mass 47 2.3.2.1.5 Root masses 50 2.3.2.2 Leaf shape and area 51 2.3.2.3 Leaf dry matter content and specific leaf area 54 2.3.2.4 Water relations 56 2.3.2.4.1 Soil water content 56 2.3.2.4.2 Leaf water potential 62 2.3.3 Field trials 64 2.3.3.1 Shoot mass and tuber yield components 65 2.3.3.1.1 Fresh shoot mass 66 2.3.3.1.2 Numbers and yield of marketable tubers 672.4 Conclusions 69
xii

CHAPTER 3 EFFECTS OF SOIL WATER REGIMES ON THE GROWTH, PHYSIOLOGY,
AND YIELD OF THE SWEET POTATO CULTIVARS
3.1 Introduction 723.2 Experimental materials and methods 73 3.2.1 Experimental location 73 3.2.2 Experimental materials 73 3.2.3 Experimental design 74 3.2.4 Experimental procedures 753.3 Experimental variables 763.4 Statistical analyses 773.5 Results and discussions 77 3.5.1 Climatic conditions 77 3.5.2 Plant growth characters 79 3.5.2.1 Main stem length 80 3.5.2.2 Number of branches 81 3.5.2.3 Fresh and dry shoot mass 82 3.5.2.4 Fresh and dry masses of leaves 86 3.5.2.5 Leaf area 88 3.5.2.6 Leaf senescence 90 3.5.2.7 Fresh and dry masses of roots 92 3.5.3 Water relations 94 3.5.3.1 Transpiration 95 3.5.3.2 Leaf water potential 97 3.5.3.3 Leaf relative water contents 101 3.5.4 Pigments, stomatal density, and tuber organic contents 103 3.5.4.1 Pigment contents 103 3.5.4.2 Leaf anatomy (stomatal density) 108 3.5.4.3 Tuber starch and sucrose concentrations 111 3.5.5 Tuber yield components 114 3.5.5.1 Tuber mass 114 4.5.5.2 Tuber numbers 115 3.5.6 Relationships between leaf area and tuber components 1203.4 Conclusions 121
CHAPTER 4 EFFECTS OF NITROGEN AND POTASSIUM ON WATER RELATIONS,
GROWTH, PHYSIOLOGICAL CHARACTERISTICS AND YIELD OF SWEET POTATO
4.1 Introduction 1254.2 Materials and methods 128 4.2.1 Experimental location 128 4.2.2 Experimental design 128 4.2.3 Research procedure 130 4.2.4 Experimental measurements 131
xiii

4.2.5 Statistical analyses 1324.3 Results and discussions 132 4.3.1 Climatic conditions 132 4.3.2 Plant growth characters 134 4.3.2.1 Dry shoot mass 135 4.3.2.2 Dry leaf mass 138 4.3.2.3 Leaf area 140 4.3.2.4 Specific leaf weight 141 4.3.3 Root growth and tuber yields 144 4.3.3.1 Dry root mass 144 4.3.3.2 Tuber yield 146 4.3.4 Pigment contents 150 4.3.4.1 Total chlorophyll 150 4.3.4.2 Carotene 153 4.3.4.3 Chlorophyll a/b ratio 155 4.3.5 Plant water relations 158 4.3.5.1 Daily transpiration 158 4.3.5.2 Water use efficiency 1634.4 Conclusions 165
CHAPTER 5 GRAFTING TO IMPROVE WATER USE EFFICIENCY IN
SWEET POTATO GENOTYPES
5.1 Introduction 1685.2 Experimental materials and methods 170 5.2.1 Experimental location 170 5.2.2 Research preparation 170 5.2.3 Experimental design 1725.3 Experimental variables 173 5.3.1 Plant growth and tuber yields 173 5.3.2 Water relations 173 5.3.3 Leaf pigment contents 174 5.3.4 Leaf anatomy 1745.4 Statistical analyses 1745.5 Results and discussion 175 5.5.1 Climatic conditions 175 5.5.2 Success of grafting technique 177 5.5.3 Plant growth characters 178 5.5.3.1 Fresh and dry shoot mass 179 5.5.3.2 Fresh and dry leaf mass 181 5.5.3.3 Leaf area 182 5.5.3.4 Specific leaf weight 183 5.5.3.5 Fresh and dry root masses 185 5.5.4 Tuber components 187 5.5.4.1 Tuber weight 187 5.5.4.2 Tuber numbers 189 5.5.4.3 Harvest index 192
xiv

5.5.5 Physiological traits 193 5.5.5.1 Leaf pigments 195 5.5.5.1.1 Chlorophyll a and b 196 5.5.5.1.2 Total chlorophyll 196 5.5.5.1.3 Chlorophyll a/b ratio 197 5.5.5.1.4 Carotene 197 5.5.5.2 Leaf anatomy 198 5.5.5.2.1 Stomatal density 198 5.5.5.2.2 Lengths of guard cells 199 5.5.5.2.3 Cuticular thickness 200 5.5.6 Plant water relations 202 5.5.6.1 Leaf water potential 202 5.5.6.2 Leaf relative water content 203 5.5.6.3 Transpiration 204 5.5.6.4 Water use efficiency 2075.6 Conclusions 209
CHAPTER 6 SWEET POTATO CULTIVATION IN PAPUA:
POTENTIAL FOR DEVELOPMENT
6.1 Introduction 2156.2 Sweet potato genetic resources 2166.3 Possible grafting combinations 2216.4 Improvements to local sweet potato cultivation system 221 6.4.1 Use of local soil amendments 221 6.4.2 Use of better adapted cultivars 223 6.4.3 Other agronomic practices 223
CHAPTER 7 GENERAL CONCLUSIONS AND FUTURE
RESEARCH DIRECTIONS
7.1 General conclusion 2257.2 Future research directions 2297.3 Extension of research results 232
REFERENCES 234
APPENDICES 251
xv

LIST OF TABLES
Tables Page
1.1 The country of origin of the sweet potato cultivars used in the drought tolerance screening trials.
25
2.1 Summary of the effects of soil water, cultivars, and their interactions with plant growth parameters.
40
2.2 Internode length (cm) and diameter (mm) of sweet potato cultivars as affected by soil water condition 3 weeks after planting in Experiment 1b.
45
2.3 Dry leaf masses (g) of sweet potato cultivars as affected by soil water condition in Experiment 1a. The control plants were grown in the field under non-limiting water conditions.
47
2.4 Dry leaf mass (g) of sweet potato cultivars as affected by soil water conditions in Experiment 1b. The control plants were grown in the field under non-limiting water conditions.
49
2.5 Fresh and dry masses of roots of sweet potato cultivars (g) as affected by soil water condition in Experiment 1b.
50
2.6 Leaf area of sweet potato cultivars (cm2 / plant) as affected by soil water conditions in Experiment 1a and 1b.
53
2.7 Effect of water stress on leaf dry matter content and specific leaf area of fifteen sweet potato cultivars in Experiment 1b.
55
2.8 Evaluation of drought tolerance characters of 15 sweet potato cultivars based on the amount of water remaining in the growing media when the plants reached permanent wilting point and the number of days to reach permanent wilting point in the water stressed plants. Data are from Experiment 1b.
61
2.9 Morphological characteristics of 15 sweet potato cultivars grown in the field under non-limiting water conditions.
65
2.10 Summary of the effects of different cultivars on the plant growth parameters and tuber yield.
66
3.1 Effects of soil water contents and their interactions on the growth of the Lole and Wanmun cultivars.
80
3.2 Effects of soil water contents (20, 40, and 80% of soil field 81
xvi

capacity) on the length of the main stem of the sweet potato cultivars Lole and Wanmun from 1 to 5 months. Number of replicates for each treatment = 4.
3.3 Effects of soil water contents (20, 40, and 80% of soil field capacity) on the fresh shoot masses of two sweet potato cultivars (Lole and Wanmun) from 1 to 5 months after planting. Number of replicates for each treatment = 4.
84
3.4 Effects of soil water contents (20, 40, and 80% soil field capacity) on the shoot dry mass of two sweet potato cultivars (Lole and Wanmun) from 1 to 5 months after planting. Number of replicates for each treatment = 4.
85
3.5 Effects of soil water contents (20, 40, and 80% of soil field capacity) on the leaf fresh mass of two sweet potato cultivars (Lole and Wanmun) from 1 to 5 months after planting. Number of replicates for each treatment = 4.
87
3.6 Effects of soil water contents (20, 40, and 80% of soil field capacity) on the leaf dry masses of two sweet potato cultivars (Lole and Wanmun) from 1 month to 5 months after planting. Number of replicates for each treatment = 4.
88
3.7 Effects of soil water contents (20, 40, and 80% of soil field capacity) on the fresh root masses of two sweet potato cultivars (Lole and Wanmun) from 1 to 5 months after planting. Number of replicates for each treatment = 4.
93
3.8 Effects of soil water contents (20, 40, and 80% of soil field capacity) on the dry root masses of two sweet potato cultivars (Lole and Wanmun) from 1 to 5 months after planting. Number of replicates for each treatment = 4.
94
3.9 Summary of the effects of soil water contents (20, 40, and 80% of soil field capacity) on two sweet potato cultivars (Lole and Wanmun) and their interaction effects on plant water relation parameters.
95
3.10 Effects of soil water contents (20, 40, and 80% of soil field capacity) on the daily transpiration rate (g of water/day) of Lole and Wanmun cultivars.
96
3.11 Effects of soil water contents, cultivars, and their interactions on pigment concentrations, stomatal density, and tuber production.
104
3.12 Correlation coefficient (R2) between leaf area and the total harvested tuber yields (g / plant) from Lole and Wanmun cultivars.
120
xvii
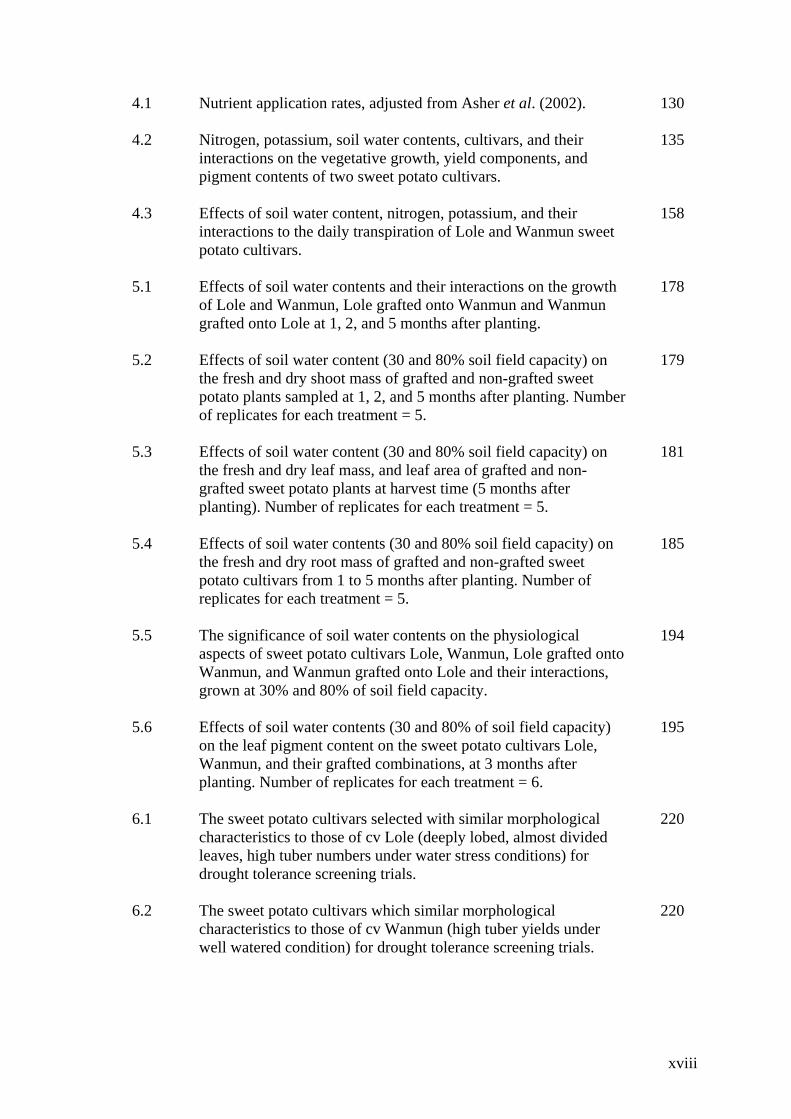
4.1 Nutrient application rates, adjusted from Asher et al. (2002).
130
4.2 Nitrogen, potassium, soil water contents, cultivars, and their interactions on the vegetative growth, yield components, and pigment contents of two sweet potato cultivars.
135
4.3 Effects of soil water content, nitrogen, potassium, and their interactions to the daily transpiration of Lole and Wanmun sweet potato cultivars.
158
5.1 Effects of soil water contents and their interactions on the growth of Lole and Wanmun, Lole grafted onto Wanmun and Wanmun grafted onto Lole at 1, 2, and 5 months after planting.
178
5.2 Effects of soil water content (30 and 80% soil field capacity) on the fresh and dry shoot mass of grafted and non-grafted sweet potato plants sampled at 1, 2, and 5 months after planting. Number of replicates for each treatment = 5.
179
5.3 Effects of soil water content (30 and 80% soil field capacity) on the fresh and dry leaf mass, and leaf area of grafted and non-grafted sweet potato plants at harvest time (5 months after planting). Number of replicates for each treatment = 5.
181
5.4 Effects of soil water contents (30 and 80% soil field capacity) on the fresh and dry root mass of grafted and non-grafted sweet potato cultivars from 1 to 5 months after planting. Number of replicates for each treatment = 5.
185
5.5 The significance of soil water contents on the physiological aspects of sweet potato cultivars Lole, Wanmun, Lole grafted onto Wanmun, and Wanmun grafted onto Lole and their interactions, grown at 30% and 80% of soil field capacity.
194
5.6 Effects of soil water contents (30 and 80% of soil field capacity) on the leaf pigment content on the sweet potato cultivars Lole, Wanmun, and their grafted combinations, at 3 months after planting. Number of replicates for each treatment = 6.
195
6.1 The sweet potato cultivars selected with similar morphological characteristics to those of cv Lole (deeply lobed, almost divided leaves, high tuber numbers under water stress conditions) for drought tolerance screening trials.
220
6.2 The sweet potato cultivars which similar morphological characteristics to those of cv Wanmun (high tuber yields under well watered condition) for drought tolerance screening trials.
220
xviii

LIST OF FIGURES
Figures Page
2.1a Double bag technique used to determine the permanent wilting point in sweet potato cultivars.
32
2.1b Cross-section through the double bag technique used to determine permanent wilting point at sweet potatoes.
33
2.2 Sweet potato cultivars grown under non-limiting water conditions in the Genetic Garden of the School of Marine and Tropical Biology, James Cook University, Townsville. Photograph taken on 30 January 2001.
35
2.3 Experiment 1a: Weekly mean maximum and minimum air temperatures (oC), and relative humidity measured at 3.00 pm (%) at Townsville area, from November to December 2000. Source: Bureau of Meteorology, Australia.
38
2.4 Experiment 1b: Weekly mean maximum and minimum air temperatures, and relative humidity at Townsville area, from February to March 2001. Source: Bureau of Meteorology, Australia.
38
2.5 The length of main stem of 15 sweet potato cultivars as affected by soil water conditions. The control relates to the field trial in which water was non-limiting, the stressed conditions relate to the glasshouse trials of Experiments 1a and 1b in which water was withheld until permanent wilting point was achieved. Error bars represent standard errors of means with 3 and 4 replications in experiment 1a and 1b, respectively. (a) Experiment 1a (27 November – 18 December 2000) terminated after 3 weeks of growth because of a leaking glasshouse roof. (b) Experiment 1b (11 February to 12 March 2001) after 4 weeks of growth.
41
2.6 The length of main stem of 15 sweet potato cultivars affected by soil water conditions recorded at 2, 3, and 4 weeks after planting from the Experiment 1a and 1b.
43
2.7 Total dry plant biomass (sum of dry shoots and dry roots) of 15 sweet potato cultivars affected by soil water conditions (Experiments 1a and 1b).
46
2.8 Leaf morphological characters of 15 sweet potato cultivars studied.
48
xix

2.9 The general leaf shapes of sweet potato cultivars (Huaman, 1997).
51
2.10 Water content (g of water /kg of soil) of the growing media of 15 sweet potato cultivars under water stress conditions, recorded from 7 days after planting until the day on which the plants permanently wilted in Experiments 1a and 1b.
58
2.11 Cumulative transpiration (g of water / kg of soil) of 15 sweet potato cultivars recorded from 7 days to 21 days after planting grown under well watered conditions in Experiments 1a and 1b.
60
2.12 Leaf water potential of 15 sweet potato cultivars, grown under well watered and water stressed conditions, at the time that the cultivars reached the permanent wilting point. Vertical bars are standard errors of means (Data are from Experiment 1b).
63
2.13 Fresh shoot mass of 15 sweet potato cultivars grown under non-water stressed field conditions. Error bars represent standard errors of means with 6 replications.
66
2.14 The number of marketable tubers produced by 15 sweet potato cultivars grown under non-limiting water conditions in the field. Error bars represent standard errors of means with 6 replications.
68
2.15 Mass of tubers of 15 sweet potato cultivars grown under non-limiting water conditions in the field.
68
3.1 The Lole (left) and Wanmun cultivars (right).
74
3.2 Weekly mean maximum and minimum air temperatures (oC) at Townsville Airport, from 1 August to 31 December 2001. Source: Bureau of Meteorology, Queensland.
78
3.3 Relative humidities at 9.00 am and 3.00 pm at Townsville Airport, from 1 August to 31 December 2001. Source: Bureau of Meteorology, Queensland.
78
3.4 Effects of soil water contents (20, 40, and 80% of soil field capacity) on the number of branches in the sweet potato cultivars Lole and Wanmun from 1 to 5 months after planting. Error bars represent standard errors of means with 4 replications.
82
3.5 Effects of soil water contents (20, 40, and 80% of soil field capacity) on leaf area of two sweet potato cultivars (Lole and Wanmun) from 1 to 5 months after planting. Error bars represent standard errors of means with 4 replications.
89
3.6 Effects of soil water contents (20, 40, and 80% of soil field capacity) on the total leaf senescence of two sweet potato cultivars (Lole and Wanmun) from 1 month to 5 months after planting. Error
90
xx

bars represent standard errors of means with 4 replications.
3.7 Leaf water potential of Lole and Wanmun cultivars, affected by three soil water contents (20, 40, and 80% of soil field capacity) at 2 months after planting. Error bars represent standard errors of means with 3 replications.
98
3.8 Leaf water potential of Lole and Wanmun cultivars, affected by three soil water contents (20, 40, and 80% of soil field capacity) at 3 months after planting. Error bars represent standard errors of means with 3 replications.
99
3.9 Leaf relative water contents of Lole and Wanmun cultivars, affected by three soil water contents (20, 40, and 80% of soil field capacity). Error bars represent standard errors of means with 4 replications.
102
3.10 The effect of soil water content on the chlorophyll concentrations in the leaves of the Lole and Wanmun sweet potato cultivars at 2 and 3 months after planting. Error bars represent standard errors of means with 4 replications.
105
3.11 The effect of soil water content on the carotene concentration in the leaves of Lole and Wanmun sweet potato cultivars at 2 and 3 months after planting. Error bars represent standard errors of means with 4 replications.
106
3.12 The effect of soil water contents (20%, 40%, and 80% soil field capacity) on the stomatal density on adaxial (upper) and abaxial (lower) surfaces of leaves of Lole and Wanmun sweet potato cultivars. Error bars represent standard errors of means with 5 replications.
109
3.13 Stomata density of the Lole cultivar at 20X of magnification grown under 20% (A), 40% (B), and 80% (C) of soil field capacity, and of the Wanmun cultivar grown under the same conditions 20% (D), 40% (E), and 80% (F) of soil field capacity.
110
3.14 The effect of soil water contents on the concentration of sucrose and total starch in the tubers of two sweet potato cultivars at 3 and 6 months after planting. Error bars represent standard errors of means with 3 replications.
112
3.15 The effects of soil water contents (20, 40, and 80% of field capacity) on tuber yields of two sweet potato cultivars (Lole and Wanmun) at different times after planting. Error bars represent standard errors of means with 4 replications.
114
3.16 The effect of soil water contents (20%, 40%, and 80% of field capacity) on the number of tubers produced per plant by Lole and Wanmun cultivars at harvest time (6 months after planting). Error
116
xxi

bars represent standard errors of means with 4 replications.
3.17 The effect of soil water contents (20%, 40%, and 80% of soil field capacity) on tuber size (average fresh mass per tuber) of two sweet potato cultivars. The number in brackets is the average number of tubers produced per plant.
117
3.18 Tuber components as affected by different soil water levels in 2 sweet potato cultivars, Lole and Wanmun.
118
3.19 Relationships between leaf area and total harvested tuber yield of Lole and Wanmun sweet potato cultivars as affected by soil water contents. (a) 2 months after planting, (b) 6 months after planting (at harvest).
120
4.1 Weekly mean daily maximum and minimum air temperatures (oC), at Townsville Airport, from 1 March to 31 July 2004. Source: Commonwealth Bureau of Meteorology, Queensland.
133
4.2 Relative humidity at 9.00 am and 3.00 pm at Townsville Airport, from 1 March to 31 July 2004. Source: Commonwealth Bureau of Meteorology, Queensland.
133
4.3 The effects of N and K on shoot dry mass of Lole and Wanmun sweet potato cultivars grown under 30% and 80% soil field capacity. Error bars represent standard errors of means with 4 replications.
137
4.4 The effect of N and K on the dry leaf mass of the Lole and Wanmun sweet potato cultivars grown under 30 and 80% soil field capacity. Error bars represent standard errors of means with 4 replications (The nitrogen responses are shown for the non-limiting K trial, and the potassium responses for the non-limiting N trial).
139
4.5 The effect of N and K on the leaf area of Lole and Wanmun sweet potato cultivars grown under 30 and 80% soil field capacity. Error bars represent standard errors of means with 4 replications. (The nitrogen responses are shown for the non-limiting K trial, and the potassium responses for the non-limiting N trial).
141
4.6 The effect of N and K on the specific leaf weight of Lole and Wanmun sweet potato cultivars grown under 30 and 80% of soil field capacity. Error bars represent standard errors of means with 4 replications. (The nitrogen responses are shown for the non-limiting K trial, and the potassium responses for the non-limiting N trial).
143
4.7 The effects of nitrogen and potassium on dry root masses of Lole and Wanmun cultivars grown under 30% and 80% soil field capacity. Error bars represent standard errors of means with 4
145
xxii

replications. (The nitrogen responses are shown for the non-limiting K trial, and the potassium responses for the non-limiting N trial).
4.8 The effects of nitrogen and potassium on tuber yields of Lole and Wanmun cultivars grown under 30% and 80% of soil field capacity. Error bars represent standard errors of means with 4 replications. (The nitrogen responses are shown for the non-limiting K trial, and the potassium responses for the non-limiting N trial).
147
4.9 The effects of nitrogen and potassium applications to the soil on the total chlorophyll concentration of the leaves of Lole and Wanmun cultivars grown under 30% and 80% of soil field capacity. Error bars represent standard errors of means with 4 replications. (The nitrogen responses are shown for the non-limiting K trial, and the potassium responses for the non-limiting N trial).
151
4.10 Leaves of Lole cultivar (left) and Wanmun cultivar (right) affected by low nitrogen supply.
152
4.11 The effects of nitrogen and potassium on the carotene concentrations of leaves of the Lole and Wanmun cultivars grown under 30% and 80% of soil field capacity. Error bars represent standard errors of means with 4 replications. (The nitrogen responses are shown for the non-limiting K trial, and the potassium responses for the non-limiting N trial).
153
4.12 The effects of nitrogen and potassium on the chlorophyll a/b ratio in leaves of Lole and Wanmun cultivars grown under 30% and 80% of soil field capacity. Error bars represent standard errors of means with 4 replications. (The nitrogen responses are shown for the non-limiting K trial, and the potassium responses for the non-limiting N trial).
156
4.13 Effects of nitrogen (20, 100, and 200 kg of N / ha) and potassium (16, 80, and 160 kg of K / ha) applications on the average daily transpiration of Lole and Wanmun cultivars grown under 30% and 80% of the soil field capacity, at 1and 5 months after planting. Monthly transpiration data are shown in the Appendix (Fig. A4:1).
160
4.14 Effects of nitrogen and potassium inputs on the water use efficiency (WUE) of Lole and Wanmun cultivars grown under 30 and 80% of the soil field capacity (Soil FC).
164
5.1 Grafted sweet potato cultivars: (A) the grafted union between Lole rootstock and Wanmun scion one week after grafting; (B) Wanmun rootstock and Lole scion 4 weeks after grafting; (C) the grafted cuttings imbibing water for 2 days before planting.
171
xxiii

5.2 Weekly mean maximum and minimum air temperatures (oC), at Townsville Airport, from 1 December 2003 to 30 April 2004. Source: Commonwealth of Australia, Bureau of Meteorology, Queensland.
176
5.3 Relative humidity of 09.00 am and 15.00 pm at Townsville area, from 1 December to 30 April 2004. Source: Commonwealth of Australia, Bureau of Meteorology, Queensland.
176
5.4 The grafted unions of sweet potato cultivars: (a) a Lole scion (LS) and Wanmun rootstock (WR); (b) a Wanmun scion (WS) and Lole rootstock (LR). The arrow points to an area where the phloem of the scion is not well connected to the phloem of the rootstock.
177
5.5 Specific leaf weight mass of Lole, Wanmun, Lole scion grafted onto Wanmun rootstock, and Wanmun scion grafted onto Lole rootstock under 30 and 80% soil field capacity (FC).
184
5.6 Effects of soil water contents (30 and 80% of soil field capacity) on the mass of tubers at harvest of the sweet potato cultivars (Lole, Wanmun) and grafted cultivars (Lole scion on Wanmun rootstock L-W, and Wanmun scion on Lole rootstock W-L). Number of replicates for each treatment = 5.
188
5.7 Effects of soil water contents (30 and 80% of soil field capacity) on the number of tubers at harvest for the sweet potato cultivars (Lole, Wanmun) and grafted cultivars (Lole scion on Wanmun rootstock L-W, and Wanmun scion on Lole rootstock W-L). Number of replicates for each treatment = 5.
190
5.8 Effects of soil water contents (30 and 80% of soil field capacity) and the sweet potato cultivars (Lole, Wanmun) and grafted cultivars (Lole scion on Wanmun rootstock L-W, and Wanmun scion on Lole rootstock W-L) on the average mass of tuber at harvest time. Number of replicates for each treatment = 5.
191
5.9 Effects of soil water contents (30 and 80% of soil field capacity) on the harvest index of the sweet potato cultivars (Lole, Wanmun) and grafted cultivars (Lole scion on Wanmun rootstock L-W, and Wanmun scion on Lole rootstock W-L). Number of replicates for each treatment = 5.
193
5.10 Effects of soil water contents (30 and 80% of soil field capacity) on the stomatal density of (a) the adaxial and (b) abaxial leaf surfaces of the sweet potato cultivars (Lole, Wanmun) and grafted cultivars (Lole scion on Wanmun rootstock L-W, and Wanmun scion on Lole rootstock W-L). Number of replicates for each treatment = 10.
199
5.11 Effects of soil water contents (30 and 80% soil field capacity) on the 200
xxiv
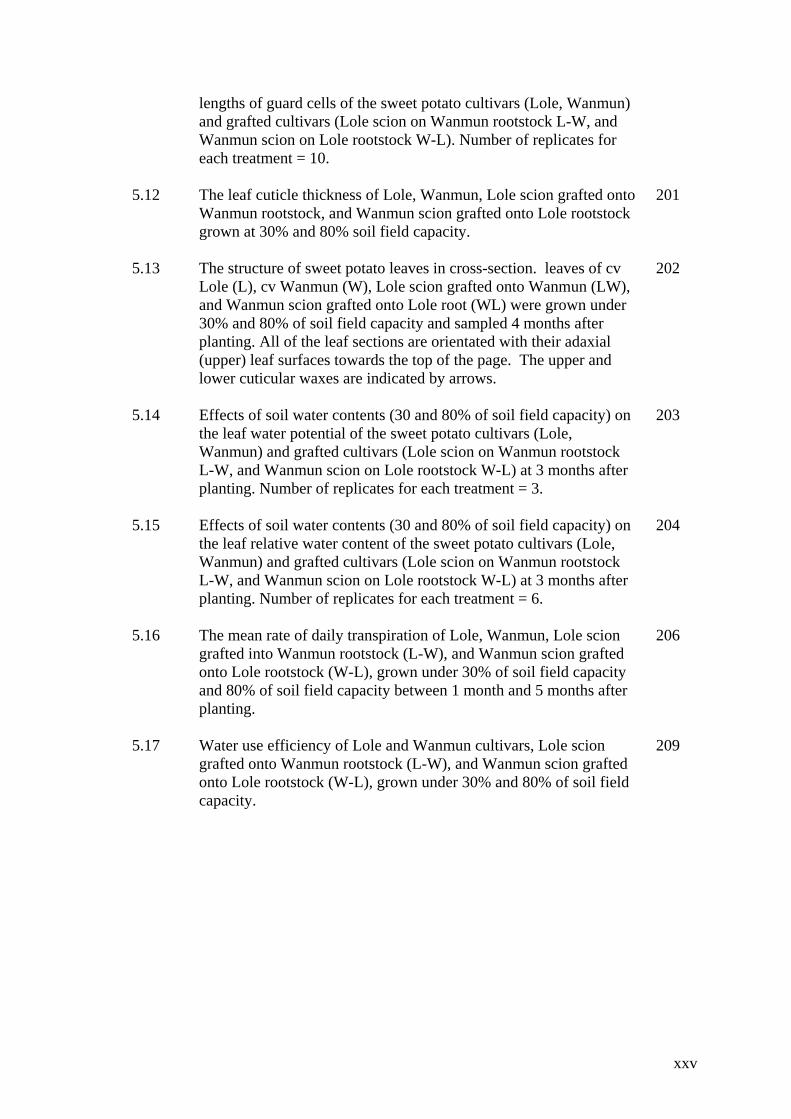
lengths of guard cells of the sweet potato cultivars (Lole, Wanmun) and grafted cultivars (Lole scion on Wanmun rootstock L-W, and Wanmun scion on Lole rootstock W-L). Number of replicates for each treatment = 10.
5.12 The leaf cuticle thickness of Lole, Wanmun, Lole scion grafted onto Wanmun rootstock, and Wanmun scion grafted onto Lole rootstock grown at 30% and 80% soil field capacity.
201
5.13 The structure of sweet potato leaves in cross-section. leaves of cv Lole (L), cv Wanmun (W), Lole scion grafted onto Wanmun (LW), and Wanmun scion grafted onto Lole root (WL) were grown under 30% and 80% of soil field capacity and sampled 4 months after planting. All of the leaf sections are orientated with their adaxial (upper) leaf surfaces towards the top of the page. The upper and lower cuticular waxes are indicated by arrows.
202
5.14 Effects of soil water contents (30 and 80% of soil field capacity) on the leaf water potential of the sweet potato cultivars (Lole, Wanmun) and grafted cultivars (Lole scion on Wanmun rootstock L-W, and Wanmun scion on Lole rootstock W-L) at 3 months after planting. Number of replicates for each treatment = 3.
203
5.15 Effects of soil water contents (30 and 80% of soil field capacity) on the leaf relative water content of the sweet potato cultivars (Lole, Wanmun) and grafted cultivars (Lole scion on Wanmun rootstock L-W, and Wanmun scion on Lole rootstock W-L) at 3 months after planting. Number of replicates for each treatment = 6.
204
5.16 The mean rate of daily transpiration of Lole, Wanmun, Lole scion grafted into Wanmun rootstock (L-W), and Wanmun scion grafted onto Lole rootstock (W-L), grown under 30% of soil field capacity and 80% of soil field capacity between 1 month and 5 months after planting.
206
5.17 Water use efficiency of Lole and Wanmun cultivars, Lole scion grafted onto Wanmun rootstock (L-W), and Wanmun scion grafted onto Lole rootstock (W-L), grown under 30% and 80% of soil field capacity.
209
xxv

GLOSSARY AND ABBREVIATIONS
Abbreviation Term Definition
ABA Abscisic acid Hormone involved in regulating seed germination, inducing storage protein synthesis, and modulating water stress (Hopkins, 1999).
Chlorosis Yellowing of the leaves due to loss or
reduced development of chlorophyll (Raven et al., 1999).
Drought Duration without rain, which is sufficient to cause damage to plants, and to reduce plant growth and economic yield (Jones et al., 1981).
Drought resistance The ability of plants to obtain and retain water as well as to metabolise during low water potential in the tissue or the ability of a plant to grow satisfactorily when exposed to periods of water stress (Singh et al., 1972). A range of mechanisms whereby plants can withstand periods of dry weather (Jones et al., 1981).
Drought escape The ability of plants to complete their life cycle and produce yields before a water deficit occurs late in the growing season (Turner, 1979).
Drought avoidance The ability of plants to close stomata rapidly, to have a greater osmotic adjustment, thick cuticles, leaf rolling, and a large root system to avoid drought effects (Kramer, 1980).
Drought recovery The ability of plants to recover and
continue to grow after a period of severe water stress (Blum, 2000).
xxvi

Equilibrium time Time to reach the water balance between the humidity of the air in the chamber and the water potential of the cell (Larcher, 1995).
HI Harvest index An indication of the relative distribution of photosynthates between the storage roots and the remainder of the plants (Kays, 1985), and is determined by measuring the ratio of tuber yield to the total biomass.
LAD Leaf area duration Leaf area integrated over time, gives a measure of the longevity of the photosynthetic surface of the plants (Kays, 1985).
LAI Leaf area index The area of leaves per unit area of land (Kays, 1985).
Leaf diffusive resistance The resistance of a leaf to CO2 molecules entering intercellular spaces through the stomata (Larcher, 1995).
Leaf abrasion Removal of the waxy leaf cuticle by leaf scratching, in order to increase water vapour conductance across the leaf epidermis (Brown and Oosterhuis, 1992).
LHC Light-harvesting complex A function for harvesting additional light energy and regulate the input of energy into photosystem I and photosystem II (Hopkins, 1999).
LWP Leaf water potential A common physiological measurement used to assess the general water status of a plant. It is defined as a potential energy (joules) per unit mass of water (m3) with reference to pure water at zero potential (Beadle et al., 1993). A value of zero indicates the absence of water stress, while increasingly negative values illustrate increasing severity of water stress.
Field capacity The water content remaining in the soil after saturation, followed by drainage for 48 hours (Lambers, 1998).
Marketable tubers Tubers weighing more than120 g / tuber.
xxvii

MPa
Megapascal The unit of pressure used to express water potential, 1MPa = 10 bars (Hopkins, 1999).
OA Osmotic adjustment The accumulation of dissolved substances, such as sugars, amino acids and ions in plant cells, that help the cells sustain metabolic activities (Hopkins, 1999).
OP Osmotic potential A net increase in solute concentration due to metabolic processes triggered by stress (Raven et al., 1999).
PWP Permanent wilting point The point at which a plant will not recover from wilting after it has been dried and is placed in a water-saturated atmosphere in a chamber.
PN Net photosynthesis The rate of CO2 uptake per unit of plant mass required for photosynthesis minus the rate at which CO2 is freed by total plant respiration in light (Larcher, 1995).
RWC Relative water content Water status of plant tissue, which is calculated on either a dry or a fresh weight basis (Kramer, 1980).
RC Reaction centre A component of the photosystem, which plays a role in gathering light energy (Hopkins, 1999).
SLA Specific leaf area The ratio between leaf area and leaf dry mass (Reddy et al., 1989).
SLW Specific leaf weight The ratio between leaf mass and leaf area (Nobel, 1980).
TP Turgor pressure The pressure component in cells arising from the force exerted outwardly against the cell walls by the expanding protoplast (Hopkins, 1999).
WP Water potential The chemical potential of water in a system, defined as the sum of the hydrostatic pressure and osmotic pressure (Hopkins, 1999).
xxviii

WUE Water use efficiency Ratio of dry matter produced by a plant to the amount of water used in transpiration (Atwell et al., 1999).
xxix

CHAPTER 1
GENERAL INTRODUCTION
1.1 INTRODUCTION TO THE RESEARCH APPROACH
More than 70% of available land in tropical environments is under rain-fed agriculture
(Prakash and Ramachandran, 2000). Because water is the main limiting factor in this
area, and rainfall is variable in both space and time, drought is common. Drought alters
and modifies the physiology, anatomy, and morphology of plants, affects plant function,
limits plant growth, and reduces the productivity of the land (Boyer, 1982).
Drought causes plant water deficits that reduce cell turgor and cell enlargement, closes
stomata thus reducing the amount of productive foliage, decreases the rate of
photosynthesis per unit of leaf area, and shortens the vegetative growth period (Kramer,
1980; Van Loon, 1981; Bradford and Hsiao, 1982).
Almost 76% of the sweet potato (Ipomoea batatas (L.) Lam.) crops cultivated in Asian
and Pacific regions are in drought-prone areas (Indira and Kabeerathumma, 1988). As a
result, crop productivity remains low in drought-affected and insufficiently irrigated
areas (Sinha et al., 1985). Sweet potato crops in Papua New Guinea and Indonesia, for
example, produce an average of only 4 and 10 t/ha, respectively, compared to those in
China, Japan and South Korea of 19, 21, and 24 t/ha, respectively (International Potato
Centre, 1998). China is the world’s largest sweet potato producer and accounts for 80%
of total production (Scott, 1992; International Potato Centre, 1998).
1

In the highland areas of Papua (formerly Irian Jaya), Eastern Indonesia, drought and
frost are the major problems for sweet potato production (Schneider, et. al., 1993;
Ballard, 1999). Drought and frost occur yearly and devastate crops, threatening the lives
of the people in the area. Due to the effect of El Niño, prolonged and severe drought
occurred in 1997. As a consequence, many crops including sweet potato died (Prain and
Widyastuti, 1998; Ballard, 1999), and many people of Papua suffered from starvation to
the point of widespread deaths throughout the region.
Sweet potato is considered as a drought tolerant crop (Constantin et al., 1974; Hahn and
Hozyo, 1984), but it is also sensitive to water deficit stress (Ekanayake and Collins,
2004). Water, therefore plays an important role in sweet potato growth and yield. Sweet
potato requires a constant water supply throughout the growing season to produce high
yields (Newell, 1991). Water deficits reduce leaf water potential and total water use,
and subsequently reduce stomatal conductance, leaf area, root mass, tuber development,
and total plant mass (Sivan, et al., 1996).
Excessive moisture, on the other hand, inhibits storage root (tuber) initiation and
development in early growth, and causes decay of storage roots in later growth stages
(Collins, 1995). At the same time, uneven watering will cause tuber growth cracks and
diminish crop quality (Peet, 2000). Improvement of plant productivity under water
stress needs an understanding of physiological mechanisms by which water stress
affects plant growth. To date, there have been few studies of the water relations of sweet
potato.
2

1.2 OBJECTIVES OF THE THESIS
The general objectives of the present study were to identify sweet potato cultivars,
which are tolerant to drought and give a high tuber yield. Such information will help
determine desirable characters of sweet potato cultivars that provide tolerance to
drought conditions and will be very useful to plant physiologists and breeders.
Specific objectives of the present study were:
1. Identification of drought tolerant cultivars
• To identify the responses of 15 sweet potato cultivars to drought conditions.
2. Responses of sweet potato to water stress
• To observe the physiological basis of water stress in drought tolerant and
susceptible sweet potato cultivars.
• To assess the vegetative growth and yield of selected sweet potato cultivars in
relation to the degree of soil water stress.
3. Responses of sweet potato to nutrient applications
• To observe the effect of nitrogen and potassium in improving water use
efficiency in selected sweet potato cultivars.
4. Responses of sweet potato to grafting
• To observe the physiological aspects of rootstocks and scions from both drought
tolerant and susceptible sweet potato cultivars on water use efficiency.
3

1.3 THE SWEET POTATO
1.3.1 Introduction
Sweet potato is the second most important tropical root crop after cassava (Peters and
Wheatley, 1997). It plays an important role as an excellent source of energy, vitamins
A, B, and C, calcium, and iron (Hill et al., 1984; Woolfe, 1992). Sweet potato is grown
mostly for its edible storage roots (Kuo and Chen, 1992). Young sweet potato leaves
that are rich in protein, are commonly consumed by Asian people as a green vegetable
(Villarreal et al., 1985; Valenzuela et al., 2000).
Sweet potato is the main source of carbohydrate intake in many tropical countries
(O’Hair, 1990 and International Potato Centre, 1998). It is the primary food source for
the highlanders of Papua, Eastern Indonesia, where it accounts for nearly 100% of the
people’s diet (Ruinard, 1969; Schneider et al. 1993). However, the crop (particularly
physiology) has been almost neglected in terms of scientific research. Only in the last
decade has an effort been made to realize its full potential for industrial products
(International Potato Centre, 1998).
1.3.2 Origin, distribution, and botany
Sweet potato originated in central or northwest South America (Yen, 1982; Huaman,
1997; Peet, 2000). At present, it is cultivated in tropical, subtropical, and temperate
regions in latitudes between 400N and 40oS, and from sea level to elevations of about
2000 m (Huaman, 1997; Peet, 2000). There are about 5000 cultivars present in New
Guinea, therefore this area is considered as the secondary centre for sweet potato
diversity (Yen, 1974).
4

Sweet potato is a member of the Convolvulaceae family and is more commonly grown
as an annual than a perennial crop (Onwueme and Charles, 1994; Norman et al., 1995).
It is a dicotyledonous, herbaceous plant (Duke, 1983; Hahn and Hozyo, 1984;
Schultheis and Wilson, 2000) that can be propagated using tuber roots, stem cuttings,
and seeds; vine cuttings are most commonly used for sweet potato propagation
(Onwueme and Charles, 1994; Norman et al., 1995; Huaman, 1997).
Some sweet potato cultivars produce flowers (monoecious), and others do not flower
(Duke, 1983; Huaman, 1997; Schultheis and Wilson, 2000). It is a self-compatible
species. Seeds are formed only when cross-compatible types are grown together. Self-
sterility and cross-incompatibility in sweet potato are both common (Purseglove, 1968
in Norman et al., 1995). The chromosome number in sweet potato is 90, indicating a
hexaploid plant with a basic chromosome number of 15 (Huaman, 1997; Schultheis and
Wilson, 2000).
The plant habit is vine-system; twining and cylindrical stems expand rapidly on the
ground and increase under shading (Norman et al., 1995). The leaves may be rounded,
reniform (kidney-shaped), cordate (heart-shaped), triangular, hastate (trilobular) and
lobed moderately or deeply (Huaman, 1992). Leaves are usually horizontal, prostrate
(Brown, 1992), and highly variable in their morphology. They are spirally and
alternately arranged on the stem. Some cultivars show some variation in leaf shape on
the same plant (Huaman, 1997).
The root system in sweet potato consists of fibrous roots that absorb nutrients and water,
and storage roots that hold photosynthetic products, predominantly starches and sugars
5

(Huaman, 1997). As the plants mature, thick pencil roots with some lignification (and
other roots that have no lignification) become fleshy and thicken and are called storage
roots or tubers (Huaman, 1997). Tuber masses vary widely depending on cultivar and
environmental conditions (Martin, 1988; Goswami et al., 1995; Anselmo et al. 1998).
The yield can be quite variable. Martin (1988) observed that the yields of sweet potato
can reach 4.36 kg/plant, but yields of only 1.63 kg / plant are more common in the
Papuan highlands (Apaseray et al., 2001).
1.3.3 Ecophysiology
Sweet potato is grown over a broad range of environments and cultural practices and is
commonly found in low-input agriculture systems (Prakash, 1994). Genetic and
environmental factors determine crop growth and yield. Consequently, different crop
genotypes may perform differently under diverse environmental conditions. Biophysical
factors such as soils, pests and diseases, and other environmental variables, including
temperature, light intensity, and soil moisture affect physiological responses, growth,
and yield. Certain ecological ranges are required for sweet potato to produce maximum
yields.
Sweet potato requires a moist sandy loam soil with good drainage and pH between 5.6
and 6.6 (Martin, 1988). Warm days and nights are the optimal conditions for sweet
potato growth and development (McCraw, 2000). It is a warm weather crop and the best
temperatures for growth and yield are above 24 oC; growth is severely retarded at
minimum temperatures below 10 oC (Onwueme and Charles, 1994). Sweet potato grows
best under relatively high light intensity, shading therefore should be avoided
(Onwueme and Charles, 1994). It requires a short day-length of 11 hours or less to
6
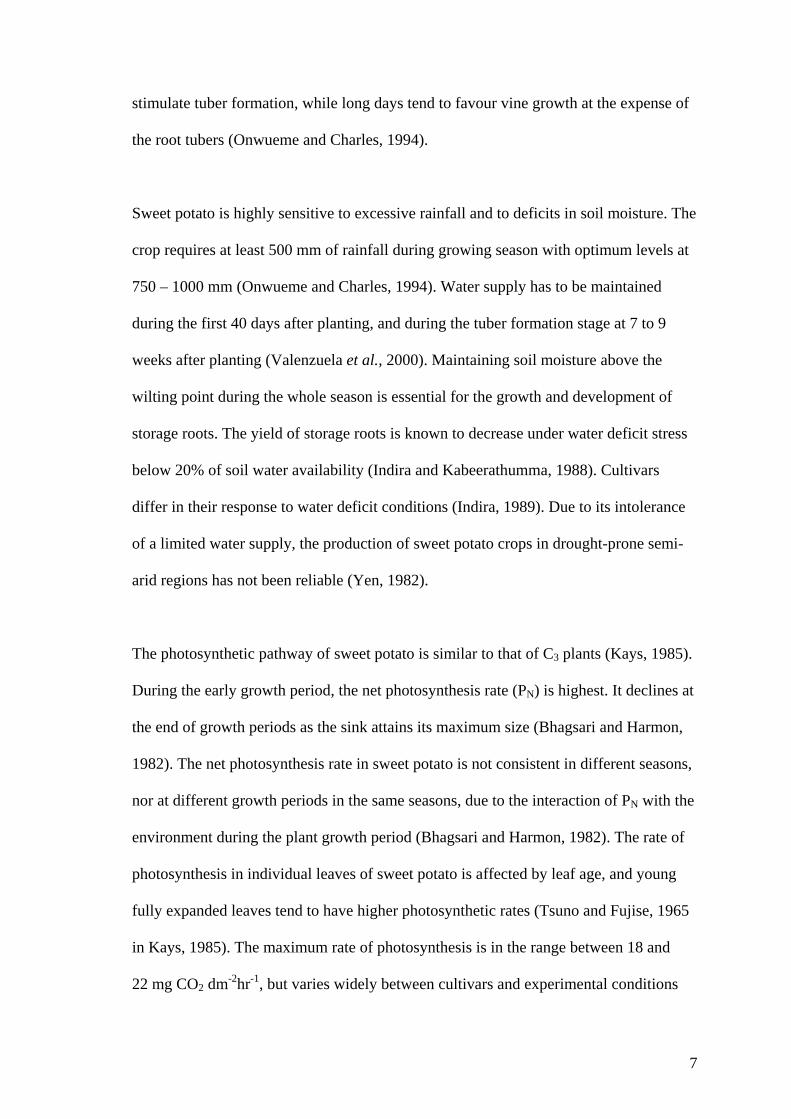
stimulate tuber formation, while long days tend to favour vine growth at the expense of
the root tubers (Onwueme and Charles, 1994).
Sweet potato is highly sensitive to excessive rainfall and to deficits in soil moisture. The
crop requires at least 500 mm of rainfall during growing season with optimum levels at
750 – 1000 mm (Onwueme and Charles, 1994). Water supply has to be maintained
during the first 40 days after planting, and during the tuber formation stage at 7 to 9
weeks after planting (Valenzuela et al., 2000). Maintaining soil moisture above the
wilting point during the whole season is essential for the growth and development of
storage roots. The yield of storage roots is known to decrease under water deficit stress
below 20% of soil water availability (Indira and Kabeerathumma, 1988). Cultivars
differ in their response to water deficit conditions (Indira, 1989). Due to its intolerance
of a limited water supply, the production of sweet potato crops in drought-prone semi-
arid regions has not been reliable (Yen, 1982).
The photosynthetic pathway of sweet potato is similar to that of C3 plants (Kays, 1985).
During the early growth period, the net photosynthesis rate (PN) is highest. It declines at
the end of growth periods as the sink attains its maximum size (Bhagsari and Harmon,
1982). The net photosynthesis rate in sweet potato is not consistent in different seasons,
nor at different growth periods in the same seasons, due to the interaction of PN with the
environment during the plant growth period (Bhagsari and Harmon, 1982). The rate of
photosynthesis in individual leaves of sweet potato is affected by leaf age, and young
fully expanded leaves tend to have higher photosynthetic rates (Tsuno and Fujise, 1965
in Kays, 1985). The maximum rate of photosynthesis is in the range between 18 and
22 mg CO2 dm-2hr-1, but varies widely between cultivars and experimental conditions
7

(Kays, 1985). Leaf carbohydrate concentrations decline after storage roots begin to
develop (Naka and Tamaki, 1957 in Kays, 1985).
Common leaf chlorophyll concentrations lie between 7.6 and 10.6 mg/g leaf dry mass
(Bhagsari and Harmon, 1982). The density of stomata varies among cultivars from 47 to
87 per mm2 on the adaxial leaves and from 163 to 253 per mm2 on the abaxial leaf
surface (Bhagsari and Harmon, 1982). The optimal leaf area index (the ratio of
photosynthetic leaf area to covered ground area) is between 3 and 4, however it varies
among sweet potato cultivars (Kays, 1985).
1.4 ROLE OF WATER IN PLANTS
1.4.1 Physiological functions
Water is important to the basic functions of living cells, as it plays a vital role in all
physiological processes, and contributes between 60 and 95% of the fresh mass of
tissues and organs (Monneveux and Belhassen, 1996). Water is required in vast
quantities as the major substance in plant cells (Lambers et al., 1998). At a cellular
level, water is the major medium for transporting metabolites through cells. At the
whole plant level, water is the medium for transporting the raw materials of
carbohydrates, nutrients, and hormones required for growth and development (Lambers
et al., 1998). Water is also an essential medium in biochemical processes and is
involved as a reactant in several processes including photosynthesis (Nonami and
Boyer, 1989; Monneveux and Belhassen, 1996).
Water also drives the transfer of sap containing nutrients from roots to leaves, it induces
mechanical and physiological functions including structural integrity of cells, tissues,
8

and the turgidity and rigidity of plant cells (Nonami and Boyer, 1989; Monneveux and
Belhassen, 1996). Due to their high concentrations of solutes, plant cells exert a positive
pressure (turgor) against their cell wall, which is the basic support mechanism in plants.
When plants lose turgor as a consequence of drying conditions in the root zone, they are
no longer able to carry out physiological functions such as cell expansion and
photosynthesis (Lambers et al., 1998).
Water is quantitatively the most abundant substance transported in the vascular tissue
called phloem (Taiz and Zeiger, 1991). Water also drives the translocation of
photoassimilate through phloem. Sucrose is a common dissolve substance that
transported in sieve tube of phloem. Other organic solutes that move in phloem are
nitrogen in the form of amino acids and amides, especially glutamate and aspartate but
are usually lower than sucrose, almost all of the endogenous plant hormones (auxin,
cytokinin, gibberellin), nucleotide phosphates and enzymes, several inorganic solutes
including potassium, magnesium, phosphate, and chloride (Taiz and Zeiger, 1991;
Hopkins, 1995).
The movement of water within the plant occurs by diffusion from cell to cell along a
water potential gradient (short distance transport), and by conduction through the xylem
(long distance transport). The movement of water through the vascular system is
controlled largely by xylem properties, such as conducting area (cross-sectional area of
the transporting vessels) and flow resistances, the plant physiological state (e.g. degree
of stomatal opening), and the environmental conditions (Larcher, 1995).
9

Under water deficits, plants slow down their biological activities (Mullet and Whitsitt,
1996). When a severe water deficit continues, there is marked reduction in the rate of
photosynthesis which can damage biological functioning, and cause the plant to die
(Levitt, 1972; Kramer, 1980; Monneveux and Belhassen, 1996). However, the
responses of plants to water deficits may vary greatly, depending on species and stress
severity (Mullet and Whitsitt, 1996).
1.4.2 Plant water status
Plant water status affects plant growth and yield through the extension of leaf and root
growth (Beadle et al., 1993). Plant water status is assessed by several major parameters
such as leaf water potential (LWP) and leaf relative water content (RWC) (Blum, 2000).
Leaf water potential is defined as the potential energy (joules) per unit mass of water
(m3) with reference to pure water at zero potential (Beadle et al., 1993). Leaf relative
water content is the water status of plant tissue, calculated on either a dry or a fresh
weight basis (Kramer, 1980). Leaf water potential has negative values, due to less
potential energy being available for plant tissue than pure water (Beadle et al., 1993).
Water potential can be measured by a pressure chamber and thermocouple
psychrometer. The pressure chamber is simple and suited for field studies, while the
psychrometer is best used in the laboratory (Beadle et al., 1993). It is still unresolved
whether leaf water potential or relative water content has the greater effect on the
physiological activity.
Siddique et al. (2000) proposed leaf water potential as a reliable parameter for
quantifying plant water stress. However, relative water content was considered as the
10

appropriate measurement of plant water status in terms of the physiological
consequence of cellular water deficit (Sinclair and Ludlow, 1985). It also represents
variations in water potential (WP), turgor potential (TP) and osmotic adjustment (OA)
(Blum, 2000). This is because osmotic adjustment is a powerful mechanism for
conserving cellular hydration under drought stress, and relative water content expresses
the effect of osmotic adjustment in this respect. Osmotic adjustment is the capacity to
adjust when the plant experiences water stress, and it is not an inherited trait (Ludlow
and Muchow, 1990). It results from the accumulation of solutes within cells, which
lowers the osmotic potential (OP) and helps maintain turgor of both shoots and roots as
plants experience water stress (Ludlow and Muchow, 1990).
Genotypes may vary in their relative water content while having the same water
potential due to a difference in osmotic adjustment (Blum, 2000). Expressing high
relative water content as a favourable plant water status in the field can be maintained
by three mechanisms:
• The capability to sustain high water potential by deep soil moisture extraction;
• The capacity for osmotic adjustment which allows maintaining relative water
content and turgor potential to lower water potential;
• Stomata closing in response to leaf desiccation and/or a transported hormonal
signal that is produced in the root, in response to root desiccation (Blum, 2000).
Variations in plant size could affect the variation of relative water content among
genotypes. Under limited soil moisture, plant water status can be affected by the rate of
leaf canopy development and leaf area index (LAI). Larger plants are likely to express
11

lower relative water contents and use more water than smaller plants after a given time
(Blum, 2000).
Leaves must acquire an appropriate amount of water as they grow (Eguchi et al., 1998),
and leaf area growth is reduced under water deficits (Alves and Setter, 2000). Leaf
water status is controlled by stomata through the balance between water loss and carbon
gain (Beadle et al., 1993). Stomata close when the leaf cells reach zero turgor, or when
a plant or leaf exhausts the water available for transpiration (Schulze, 1986).
Leaf water potential has been reported by Ike and Thurtell (1981) to decrease in cassava
and sweet potato under drought stress: in cassava, leaf water potential above – 0.5 MPa
was independent of stomatal resistance, but increased with decreasing potential; leaf
wilting occurred at leaf water potentials of less than – 0.9 MPa. Ghuman and Lal (1983)
reported leaf water potentials in unirrigated sweet potato at – 0.96 MPa, compared to
–0.36 MPa in cassava. Under higher leaf water potential, the tuber growth rate of sweet
potato was higher, and it appeared to be affected by leaf transpiration through the water
balance of the whole plant (Eguchi et al., 1998). In sunflower, leaf water potential
decreased in response to soil dehydration both in drought sensitive and tolerant
genotypes (Cellier et al., 1998); but decreases in leaf water potential and wilting were
delayed in drought tolerant genotypes compared with sensitive ones.
1.4.3 Water uptake by plants
Efficient water uptake by plants is an important determinant of drought resistance.
Water uptake depends on root size (length or mass), root activity and its spatial
distribution (Huang and Gao, 2000). About 70% of available water at the soil-root zone
12

can be used for vegetative growth. It is recommended that when soil had dried to about
50% of plant available water, it is the time to irrigate any plant (Atwell et al., 1999).
Maintenance of water uptake by roots is an important mechanism in maintaining plant
turgor and canopy transpiration. Efficiency of water uptake depends on the root system
and extensive, dense root systems are considered to be more efficient (Beadle et al.,
1993).
1.5 MECHANISMS OF DROUGHT RESISTANCE
Drought can be defined as any period without rain which is sufficient to cause damage
to plants, and to reduce plant growth and economic yield (Swindale and Bidinger, 1981;
Jones et al., 1981). Drought occurs when water potentials in the rhizosphere are
sufficiently negative to reduce water availability to sub-optimal levels for plant growth
and development (Lu et al., 2000). Drought can be permanent, seasonal, and
unpredictable (Kramer, 1980).
Whole plants respond to drought through morphological, physiological, and metabolic
modifications occurring in plant organs (Cellier et al., 1998). A number of plant
functions may be impaired by water stresses that reduce cell turgor, close stomata, and
reduce cell enlargement, thereby reducing leaf area and the rate of photosynthesis per
unit of leaf area (Kramer, 1980). Stomatal closure is among the negative effects of
water stress in the restriction of carbon fixation (Kaiser, 1987). However, a variety of
plants species may continue growing under low available water conditions and still
maintain photosynthesis activity (Fischer and Turner, 1978).
13

“Drought resistance” is the general term used to cover a range of mechanisms whereby
plants can withstand periods of dry weather (Jones et al., 1981). Drought resistance is
the ability of plants to obtain and retain water as well as to metabolise during periods of
low water potential in their tissues (Singh et al., 1972). Strong drought resistance is
often associated with the maintenance of higher leaf water potential, non-stomatal
control of transpiration, and high leaf permeability (Blum et al., 1983).
The ability of a plant to grow satisfactorily when exposed to periods of water stress is
also called drought resistance (Singh et al., 1972). Aspects of drought resistance that are
considered important in sweet potato breeding programs are: the effect of short periods
of water stress on productivity and on tuber quality; survival and recovery of plants
after water stress; and water use efficiency (Van Loon, 1981). Four mechanisms of
drought resistance are used by plants to endure the period of insufficient water (Levitt,
1972; Turner, 1979; Ekanayake, 1997) are discussed bellow:
• drought escape,
• drought avoidance,
• drought tolerance, and
• drought recovery
1.5.1 Drought escape
In drought escape, plants are able to complete their life cycle mainly through
mechanisms to ensure early maturity and can produce their yields before susceptible
stages of water deficit occur late in the growing season (Turner, 1979; Kramer, 1980).
Therefore, it is important to match the pattern of plant development to the growing
season and to the availability of soil moisture in relation to the evaporative and plant
14
demands (Van Oosterom et al., 1995; Passioura, 1996). In millet (Pennisetum glaucum)
for instance, early maturity is a common escape mechanism for post-flowering drought
stress. On the other hand, the escape mechanism also appears for certain genotypes
under late flowering drought stress (Van Oosterom et al., 1995).
1.5.2 Drought avoidance
A drought avoidance strategy is achieved through osmotic adjustment, rapid closure of
stomata, presence thick cuticles, leaf rolling, and the performance of a large root system
(Levitt, 1972; Kramer, 1980). Strategies for drought avoidance or moisture conservation
have been successful for some crops under prolonged water stress caused by low soil
moisture (Bouwkamp, 1989).
In tobacco, which has been shown by Riga and Vartanian (1999) to be highly drought
resistant, plant turgor in the first phase of water deficit is maintained by osmotic
adjustment and is associated with a steep increase in stomatal resistance from a
threshold deficit. During drought stress, osmotic adjustment can play an important role
in sustaining several processes such as turgor potential, cell expansion, and stomatal
conductance (Turner, 1986). An increased root to shoot ratio may also result from a
relatively greater loss of shoot than root mass as a drought avoidance strategy (Levitt,
1972; Jones et al., 1981).
1.5.3 Drought tolerance
Drought tolerance refers to the potential of cultivars to yield well under drought stress
conditions. It is considered to be a major component of yield stability (Beekman and
Bouma, 1986), and can be classified into two types related to tissue water potential:
15

drought tolerance at high tissue water potential, by maintaining a high water status
during rainfall deficit; and drought tolerance at low tissue water potential, through the
plant’s ability to endure rainfall deficits and tolerate low tissue water potentials (Jones,
et al., 1981).
Drought tolerance with high tissue water potential involves the maintenance of water
uptake by increasing rooting and hydraulic conductance, and reducing water loss in
epidermal conductance, radiation absorption and evaporative surface. At low tissue
water potential, drought tolerance can be assessed on turgor maintenance, such as solute
accumulation, increased cell elasticity, decreased cell size and desiccation tolerance,
such as protoplasmic resistance and rapid resumption of photosynthesis activity (Levitt,
1972; Turner 1979; and Jones et al., 1981).
Drought tolerance mechanisms are shown by relatively high root densities under short
term stress caused by low soil moisture (Bouwkamp, 1989). Despite abrupt falls in leaf
water potential and relative water content at the second dry period, cell membranes in
tobacco increase its stability, resulting in prolonged plant recovery upon rehydration
after severe soil desiccation for 2 months (Riga and Vartanian, 1999). This indicates a
drought tolerance strategy operating in tobacco at low tissue water potential.
1.5.4 Drought recovery
The potential for recovery after a period of severe drought stress is often referred to as
survival, and is a very common phenomenon in plants (Blum, 2000). This phenomenon
can be used to estimate drought tolerance (Beekman and Bouma, 1986). Plant recovery
16

from desiccation in agricultural crops is primarily a function of the capacity for
maintaining relative water content during desiccation (Blum, 2000).
Late maturing potato varieties tend to recover better than earlier varieties (Beekman and
Bouma, 1986), hence their yields are relatively high under dry conditions. This is due to
their potency in continuing tuber growth after the water supply is restored (Beekman
and Bouma, 1986). Therefore, the maintenance of relative water content during stress is
also related to the potential capacity of the tested genotypes for survival and recovery
(Blum, 2000).
Abscisic acid (ABA) may have a role in assisting plants to recover from drought stress
that is mediated by its effect on the maintenance of the plant’s relative water content
(Blum, 2000, Alves and Setter, 2000). Recovery capacity, which is independent of the
maintenance of plant water status, has rarely been explored and should be evaluated by
the degree of recovery of different genotypes when all are desiccated to the same low
relative water content (Blum, 2000).
1.6 EFFECT OF DROUGHT ON PLANT GROWTH AND DEVELOPMENT
1.6.1 Effect of drought on photosynthesis
Drought stress affects photosynthesis in two ways (Hopkins, 1999). First, stomata are
closed cutting off access of the CO2 supply into chloroplasts. Second, cellular water
potential is lowered, reducing the structural integrity of the photosynthetic organ. The
opening and closing of the stomata also depend on the ambient humidity (Mansfield and
Atkinson, 1990). Under low ambient humidity, or high temperature as a dry air mass
17

moves into the environment, plants close their stomata to reduce their leaf water loss,
and to enhance the rate at which water can be resupplied by the roots (Hopkins, 1999).
Water influences mechanical and physiological functions in plants by affecting the
structural integrity of cells and the turgidity and rigidity of tissues. As the solute
concentration increases due to water stress, the integrity of membranes and protein is
affected. This condition may lead to shrinkage of the protoplast volume, which may
induce structural and metabolic dysfunctions (Hopkins, 1999).
1.6.2 Leaf area and canopy development
Leaves are the source of dry matter production through photosynthesis (Kuo and Chen,
1992). Leaf growth and expansion are genetically controlled and modified by
environmental conditions including water supply. In sweet potato, water stress causes a
slow growth and reduces leaf mass and area significantly during establishment
(Holwerda and Ekanayake, 1991). In herbaceous plants, leaf elongation ceases at a
water potential of –0.3 MPa before stomatal closure (Kriedeman, 1986), and leaf
enlargement is restored after watering (Cornish and Zeevart, 1984). In cassava, a
decrease in soil water potential causes rapid stomatal closure and decreases leaf area
growth, which is accompanied by the synthesis and accumulation of abscisic acid at an
early phase of a water deficit (Alves and Setter, 2000). Abscisic acid promotes
developmental changes that help plants cope with water deficits, and increases in plant
organs during drought (Zeevaart and Creelman, 1988). In sweet potato, when the leaf
water potential decreased to –1.0 MPa under moisture stress, leaf diffusive resistance
was affected, and as a consequence, leaf area and leaf production also decreased (Suja
and Nayar, 1996).
18

1.6.3 Root growth and tuber development
Information on root behaviour associated with drought tolerance is important for
understanding drought tolerance mechanisms. Under drought conditions, biomass
development in cowpea was reduced but its root growth was greater than in normally
watered plants (Evenari et al., 1977). On the other hand, drought induced a significant
reduction in the number of developed lateral roots, and in the total length and root dry
matter produced by drought sensitive beans and peas (Stanislaw et al., 1997). Drought
resistant cultivars of bean and pea demonstrated greater dimensions in the root system
than the above ground part (Stanislaw et al., 1997). In cassava, the most critical periods
of water stress occurred in the first 6 months of plant growth, and reduced the storage
root yield by about 60% (Oliveira et al., 1982 in Ghuman and Lal, 1983). Roots and
storage roots of sweet potato were affected when the leaf water potential fell below
– 1.0 MPa (Suja and Nayar, 1996).
1.7 DROUGHT TOLERANCE MECHANISMS
Many plants have developed mechanisms to adapt to extreme conditions to ensure their
survival (Cornish and Zeevart, 1984; Collin, 2001). These mechanisms are related to
genetic factors and provide a metabolically effective and efficient mechanism for
drought stress alleviation (Cornish and Zeevart, 1984). Adaptation refers to genetic
modifications in structure or function that increase the vigour of the organism in the
adverse environment (Hopkins, 1999). Collin (2001) also described adaptation as a
heritable modification in physiological or developmental attributes that improves the
fitness of an organism to the conditions of its environment.
19
Adaptation is driven by climatic, edaphic, or biotic constraints (Collin, 2001). Water
acts as a key element in plant distribution patterns and many morphological traits are
conditioned by water availability, directly or indirectly; adaptation, therefore, is a key
element in the survival of the plant communities (Collin, 2001).
1.7.1 Morphology and anatomy
Mechanisms of morphological and physiological adaptation have been proposed to
explain the tolerance of some plant species to drought (Begg and Turner, 1976; Kramer,
1983; Ludlow, 1989). They include structural and anatomical characters such as a
reduction of leaf size, leaf rolling, dense leaf pubescence or hairiness of leaves, deeply
developing stomata, accumulation of mucilage and other secondary metabolites in the
mesophyll, and increases in mesophyll compactness (Ludlow, 1989 and Beadle et al.,
1993). Plants adjust to water stress through changes in the shoot to root ratio, growth
rate, and water use efficiency which may be accompanied by changes in water relation
properties such as water potential and relative water content that prompt the closure of
stomata (Beadle et al., 1993). In a sorghum cultivar (cv Gadambalia), drought tolerance
is associated with higher water extraction efficiency, fewer nodal roots per plant, fewer
late metaxylem vessels per nodal root, a smaller leaf area, and a well developed
sclerenchyma (Salih et al., 1999). Extensive and deep rooting, for instance, often has
been emphasised in relation to drought resistance (Hurd, 1974; Marcum et al., 1995) in
particular in that rice and millet are intolerant of dry periods. Millets that were not able
to recover from drought stress, and rice that performed poorly in drought conditions,
had a shallow root system (Karyudi, 2001; Hirasawa, 2001). However, Ray et al. (1972)
suggested that a small-rooted plant may use limited water more efficiently.
20
Several sweet potato cultivars have been classified as drought tolerant because they
possess a deep fibrous root system, and are able, therefore, to extract water from deep in
the soil as water availability from the top layers decreases (Hammet et al., 1982; Martin,
1988; Bouwkamp, 1989; Taufatofua, 1994; Prakash, 1994; and Lin et al., 1996).
Furthermore, their leaves have less surface area and lower transpiration rates, hence
they can maintain its cellular integrity during water stress (Garner et al., 1992).
1.7.2 Physiology
A number of plants have developed strategies to allow photosynthesis to proceed under
severe water deficits. A common strategy is lowering cell osmotic potential by means of
accumulation of net solutes to maintain cellular turgor (Morgan, 1984). This mechanism
results in the maintenance of stomatal opening, photosynthesis, and leaf and root growth
(Morgan, 1984). It is evident in millet accessions that could maintain turgor pressure
with high osmo-regulative capacity, lower values of leaf water potential at full turgor,
and reduced of osmotic potential that were not related to plant height, inflorescence
shape, stem thickness, number of tillers, and dry matter production (Karyudi, 2001).
Stomata close to reduce transpiration and regulate leaf water potential when a plant or
leaf depletes the available water and the leaf cells approach zero turgor (Turner, 1975;
Mansfield and Davies, 1981; Schulze, 1986). However, stomata can remain open even
in wilted leaves, and may close in plants in dry soil at positive turgor in a progressive
rather than in a threshold manner (Schulze, 1986).
Plants also adjust to water stress through changing their growth rates and water use
efficiency which may be accompanied by changes in water relation properties such as
21

water potential, relative water content that prompt the close of stomata, and diurnal
patterns of stomatal conductance (Beadle et al., 1993).
In sweet potato, drought tolerant genotypes such as Indian accession numbers 4, 25, 69,
72 normally had low contents of inorganic phosphate in the leaves, high cuticular wax,
and higher specific leaf weight, leaf pubescence, higher stomatal diffusive resistance,
and high desiccation tolerance, while accessions 1, 17 and 21 also had higher relative
water content when grown under water stress conditions (Indira, 1989; Suja and Nayar,
1996).
1.8 IMPLICATIONS OF PLANT RESPONSES IN IMPROVING WATER USE EFFICIENCY
1.8.1 Plant propagation strategies
Breeding for specific and suboptimal environments (such as water deficits) involves an
understanding of yield-determining processes (Blum et al., 1983). Drought tolerance
and high root storage yield is often a desirable trait for selection criterion in breeding
programs (Martin, 1988). In an attempt to combine superior characters, sexual breeding
is an unlikely choice in sweet potato because the physiology of the sweet potato flower
is extremely complex and produces incompatibilities that restrict pollination
mechanisms (Onwueme and Charles, 1994).
Grafting is an asexual propagation technique, which can be used to combine the
desirable characters of the root and vegetative parts of different plants. In reciprocal
grafts between the related species of Ipomoea batatas and Ipomoea trivida, which does
not form tubers, the rate of photosynthesis was greater in grafts with larger tubers than
in grafts of smaller tubers (Hozyo and Park, 1971 in Ravi and Indira, 1999).
22
A source is an organ or tissue that produces assimilates required for metabolism and
growth, a sink on the other hand is a net importer or consumer of photo-assimilates
(Hopkins, 1999). Grafted sweet potato plants with strong sinks, as reported by Kuo and
Chen (1992), showed greater storage root yields than those with weak sink strengths,
irrespective of source potential. On the other hand, grafts with a weak sink increased
specific leaf mass, and vice versa. It was concluded that the sink, rather than source
capacity, determined the storage root yield (Ko et al., 1992, in Ravi and Indira, 1999).
However, there have not been any reports on grafting trials for improving water use
efficiency in sweet potato.
1.8.2 Nutrient application
Nitrogen (N) and potassium (K) are two key nutrients involved in dry matter
partitioning in sweet potato (Marti and Mills, 2002). Nitrogen is an essential component
for photosynthesis, for the synthesis of chlorophyll and proteins (O’Sullivan et al.,
1997) and in cell division and enlargement (Russel and Russel, 1973). Nitrogen is
required in certain amounts to promote shoot development and provide assimilates for
growth of storage roots (Kays, 1985), as heavier N applications alone promote shoot
growth and depress root growth (Onwueme, 1978). N fertilization increases leaf area
duration (LAD), which in turn increase tuber yields (Bourke, 1985).
Potassium is also a very important nutrient for sweet potato production, as it influences
cell division, tuberous root initiation and thickening, photosynthesis, the translocation of
sugars and mineral nutrients, and enzyme activity (George et al., 2002). Potassium has
been shown to influence tuber number and yield by increasing the proportion of dry
23

matter diverted to tubers (Bourke, 1985; George et al., 2002). The application of K at
300 kg ha-1 was found to produce very high yields due to increased root to shoot ratio,
however the extent of the increase differed with genotypes (George et al., 2002).
Nitrogen and potassium are reported to be capable of improving water use efficiency in
various crops (Sivan et al., 1996; Morris et al., 1998). Because nitrogen applications
increase crop growth and yields at certain rates, there were some indications that
decreased nitrogen supply led to increased stomatal conductance, higher transpiration
per unit leaf area due to stomatal opening, hence lower water use efficiency (Morris et
al., 1998; Kelm et al., 2000). Decreasing water use efficiency under N stress in sweet
potato, however, was found to be due to lower total plant dry matter production rather
than to increased total water transpiration per plant (Kelm et al., 2000). Under drought
conditions, however, higher yields in maize can be achieved by supplemental nitrogen,
primarily because of a more vigorous root system (Morris et al., 1998).
Potassium also plays a role in osmoregulation and stomatal movement (Beringer and
Nothdurft, 1985; Hsiao and Lauchli, 1986; Marschner, 1995). In barley, the application
of K increased leaf water content and improved turgor maintenance during drought
(Losch et al., 1992). The dominant role of potassium in the opening and closing of the
stomata regulate the transpiration of water and the penetration of atmospheric carbon
dioxide into the leaf tissue (Sangakkara et al., 2000). Plants well supplied with
potassium will quickly close their stomata preventing excessive water loss by the plant
(Sivan, et al., 1996).
24

1.9 NATURE OF THE PRESENT RESEARCH
1.9.1 Research materials
The initial trials discussed in Chapter 2 used 15 cultivars of sweet potato obtained from
the University of Queensland to identify drought tolerant and susceptible cultivars; they
included 1 Queensland, 2 Hawaii, and 12 Papua-New Guinea cultivars (Table 1.1).
Table 1.1 The country of origin of the sweet potato cultivars used in the drought tolerance screening trials.
No. Genotypes Country of origin
1 Beerwah Gold Australia 2 Hawaii Hawaii 3 Lole Hawaii 4 Markham Papua New Guinea 5 Mariken Papua New Guinea 6 Wanmun Papua New Guinea 7 NG7570 Papua New Guinea 8 LO323 Papua New Guinea 9 L3 Papua New Guinea 10 L11 Papua New Guinea 11 L18 Papua New Guinea 12 L46 Papua New Guinea 13 L49 Papua New Guinea 14 L131 Papua New Guinea 15 L135 Papua New Guinea
Two cultivars, Lole and Wanmun, representing drought tolerant and susceptible
cultivars, respectively, were selected for subsequent experiments. In another trial
(Chapter 3), the effects of soil water regimes on the growth and yield of Lole and
Wanmun cultivars were observed, and another experiment (Chapter 4) examined the
effects of nitrogen and potassium applications on plant water use efficiency in the Lole
and Wanmun cultivars grown under non-limiting water and water stressed conditions. A
25

fourth experiment (Chapter 5) studied the growth responses of grafted sweet potato
cultivars, using a Lole scion and a Wanmun rootstock, and vice versa, under two
different soil water constrains.
1.9.2 Experimental sites and climatic conditions
The experimental studies were conducted in the laboratories, glasshouse, shadehouse
and field plots of the School of Marine and Tropical Biology, James Cook University,
Townsville, Queensland, Australia between November 2000 and May 2004.
1.9.3 Statistical analyses
All the numerical data were analyzed by analyses of variance using the Statistical
Package for Social Scientists (SPSS 11.0 for Windows) at 5% (p < 0.05) level of
significance. When the treatments were significant, post hoc comparisons of all
treatment combinations were performed using Bonferroni’s and Duncan Multiple Range
Test methods. Some data are presented in this thesis using the Microsoft Excel Package.
Correlation analyses were used to examine the relationships between some parameters.
Summary statistical data are provided in the text that follows, and details of the
statistical tests are given in Appendices 1-5. Where data in figures or tables that are
presented Appendices are referred to, they are indicated by “A” in the figure or table
number (e.g. Figure A2.1 is Figure 1 of Appendix 2).
26

1.10 PAPERS PRODUCED DURING THE COURSE OF THE STUDY
• Saraswati, P., Johnston, M., Coventry, R. and Holtum, J. 2001. Growth,
yield and water relations of selected sweet potato genotypes grown under
drought stress conditions. Second Annual Conference of James Cook
University, School of Tropical Biology, Biology and Zoology of North
Queensland (BZoNQ), Townsville, 11-12 August 2001.
• Saraswati, P., Johnston, M., Coventry, R. and Holtum, J. 2004. Identification
of drought tolerant sweet potato (Ipomoea batatas (L) Lam.) cultivars.
Fourth International Crop Science Congress, Brisbane, 26 September – 1
October 2004.
• Saraswati, P., Johnston, M., Coventry, R. and Holtum, J. 2004. Grafting to
improve water use efficiency in sweet potato genotypes. Fifth Annual
Conference of James Cook University’s Biology and Zoology of North
Queensland (BZoNQ), Cairns, 6 – 7 November 2004.
• Saraswati, P. 2005. The physiological aspects and yield of sweet potato
(Ipomoea batatas (L) Lam.) under water stress conditions. Seventh New
Guinea Biological Conference. Jayapura, Papua, 16-18 June 2005.
27

CHAPTER 2
IDENTIFICATION OF DROUGHT TOLERANT SWEET POTATO CULTIVARS
2.1 INTRODUCTION
Plant growth is controlled by environmental factors and genetic potential. Among the
environmental factors, drought is widely reported to affect the growth and productivity
of many crops. Plant growth and yields are strongly affected by soil water conditions.
Limited soil water availability has been widely reported to reduce many crop yields, and
the tolerance of plants to drought conditions is not only species dependent but also
cultivar dependent (Allison et al., 1981; Martin, 1988). The responses of plants to
drought, however, vary greatly depending on the species and the severity of the stress
(Mullet and Whitsitt, 1996). In sweet potato, for example, the Vardaman cultivar is
classified as drought tolerant due to its low transpiration losses; under water stress, this
cultivar has a strong capacity to maintain cellular integrity (Newell, 1991). Lower
transpiration sustains the normal plant water status by minimizing the decrease of leaf
water potential and soil water depletion; this protects leaf tissues from turgor loss and
desiccation (El-Sharkawy and Cock, 1984; Cock et al., 1985).
Since drought may impair a number of plant physiological functions, selection for
drought tolerant cultivars is an important strategy in reducing the impacts of plant water
deficit (Newell, 1991). Ludlow and Muchow (1990) suggested a similar approach to
improving plant performance in water-limited conditions by the identification and
selection of traits that contribute to drought avoidance, drought tolerance, or water use
efficiency.
28

Sweet potato is regarded as a drought tolerant crop (Jones, 1961; Constantin et al.,
1974; Hahn and Hozyo, 1984). On the contrary, sweet potato cannot tolerate dry
conditions at the time of initial of planting and in its early growth stages including vine
development and storage root initiation (Indira and Kabeerathumma, 1988; Martin,
1988). It can tolerate some drought near the end of its life cycle, but it can hardly be
thought of as a drought tolerant crop (Martin, 1988) as it requires a continuous water
supply throughout the growing season to produce abundant tuber yields of good quality
(Newell et al., 1994).
Different sweet potato cultivars may respond differently to limited soil water
availability. Selection for drought tolerant cultivars is therefore considered to be a
research priority, especially considering the fact that sweet potato is the main staple
food for people in many tropical areas. In the highlands of Papua, Eastern Indonesia,
drought, such as that of the 1997 El Niño event, can have a devastating effect on food
security and people’s livelihoods when their sweet potato crop is destroyed. Securing a
reliable food supply is therefore important in environments with intermittent and life-
threatening drought.
Although drought tolerance is considered an important component of yield stability
(Beekman and Bouma, 1986) and has been investigated in other crop species, only little
information is currently available on the physiological aspects of water relations in
sweet potato. Therefore, a pot trial was carried out to identify the drought tolerant
cultivars from a range of 15 cultivars available for study by observing their
morphological growth and water relations in a short-term glasshouse trial. A field trial
was also conducted in the Genetic Garden of the School of Marine and Tropical
29

Biology, James Cook University, Townsville, in order to determine yield responses of
the same cultivars when the water supply was not limited.
2.2 MATERIALS AND METHODS
2.2.1 Experimental sites and climatic conditions A pot experiment (Experiment 1a) was conducted in a glasshouse on the Douglas
Campus, James Cook University, North Queensland, Australia, from November to
December 2000. The experiment was repeated in another glasshouse from February to
March 2001 (Experiment 1b). Daily maximum and minimum temperatures and relative
humidity information for Townsville over the period of the experiments were obtained
from the Commonwealth of Australia, Bureau of Meteorology.
2.2.2 Glasshouse trials
2.2.2.1 Experimental design
The trials used 15 cultivars of sweet potato obtained from the University of Queensland
(Table 1.1). A factorial experiment with a randomised complete design consisted of
water stressed and non-limiting water treatments for the15 cultivars listed in Table 2.1.
Each treatment was replicated 3 times (in Experiment 1a: 27 November to 18 December
2000) and 4 times (in Experiment 1b: 11 February to 13 March 2001) and the
experiment consisted of 90 and 120 pots for experiment 1a and 1b, respectively. Pot
locations were randomised every week, thus each pot had the same chance to occupy
any specific location on the glasshouse benches during the experiment.
30
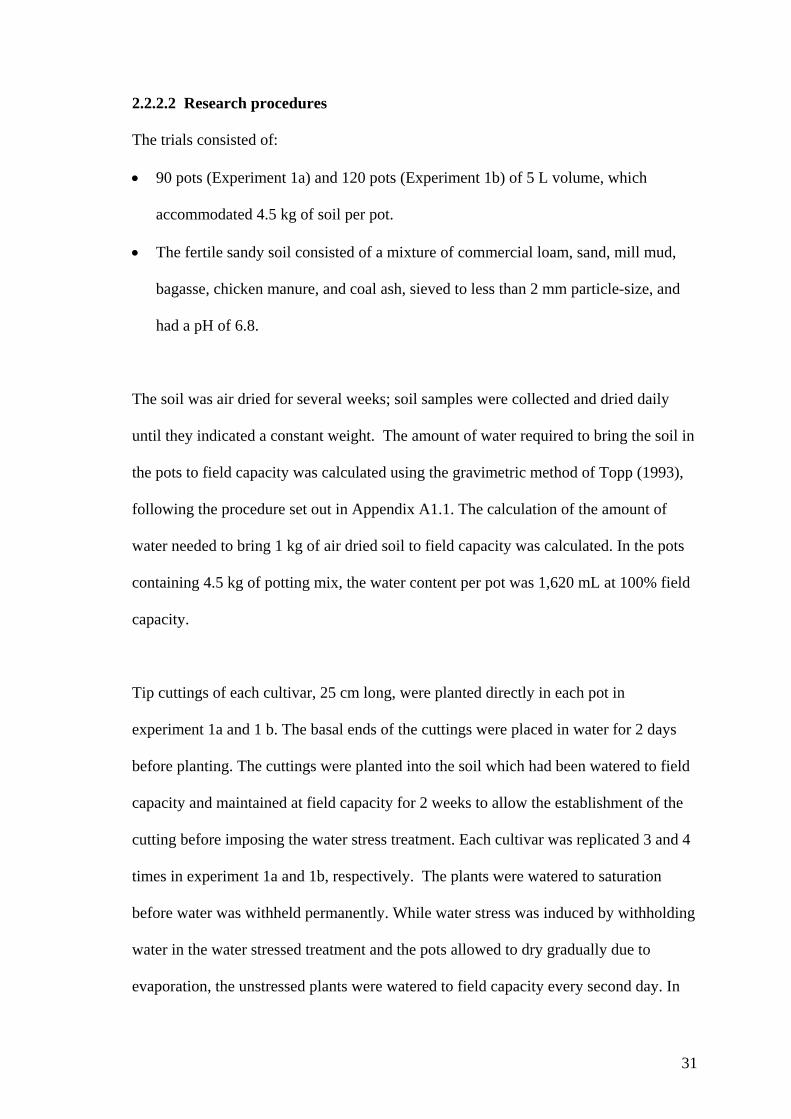
2.2.2.2 Research procedures
The trials consisted of:
• 90 pots (Experiment 1a) and 120 pots (Experiment 1b) of 5 L volume, which
accommodated 4.5 kg of soil per pot.
• The fertile sandy soil consisted of a mixture of commercial loam, sand, mill mud,
bagasse, chicken manure, and coal ash, sieved to less than 2 mm particle-size, and
had a pH of 6.8.
The soil was air dried for several weeks; soil samples were collected and dried daily
until they indicated a constant weight. The amount of water required to bring the soil in
the pots to field capacity was calculated using the gravimetric method of Topp (1993),
following the procedure set out in Appendix A1.1. The calculation of the amount of
water needed to bring 1 kg of air dried soil to field capacity was calculated. In the pots
containing 4.5 kg of potting mix, the water content per pot was 1,620 mL at 100% field
capacity.
Tip cuttings of each cultivar, 25 cm long, were planted directly in each pot in
experiment 1a and 1 b. The basal ends of the cuttings were placed in water for 2 days
before planting. The cuttings were planted into the soil which had been watered to field
capacity and maintained at field capacity for 2 weeks to allow the establishment of the
cutting before imposing the water stress treatment. Each cultivar was replicated 3 and 4
times in experiment 1a and 1b, respectively. The plants were watered to saturation
before water was withheld permanently. While water stress was induced by withholding
water in the water stressed treatment and the pots allowed to dry gradually due to
evaporation, the unstressed plants were watered to field capacity every second day. In
31

Experiments 1a and 1b, 45 and 60 pots respectively were used to determine the amount
of water remaining in the pots of the stressed plants at wilting point, and another 45 and
60 pots for Experiments 1a and 1b, respectively were watered normally.
Wilting is the most common symptom of water stress in plants. When the plant wilts, its
turgor approaches zero and the cells begin to collapse. Permanent wilting point (PWP)
is the point at which a plant will not recover from wilting when it is placed in a water-
saturated atmosphere in a chamber. To determine permanent wilting point, plants that
were still wilting in the evening were tested by putting the pots into a smaller plastic
bag (to prevent water entering the soil) which was then put into a larger plastic bag,
which had previously been sealed with some water in the bottom of it. When the plants
did not recover from wilting, it indicated that plants were in the state of permanent
wilting point (Fig. 2.1).
Water
Inner plastic
Outer plastic
Figure 2.1a Double bag technique used to determine the permanent wilting point in sweet potato cultivars.
32
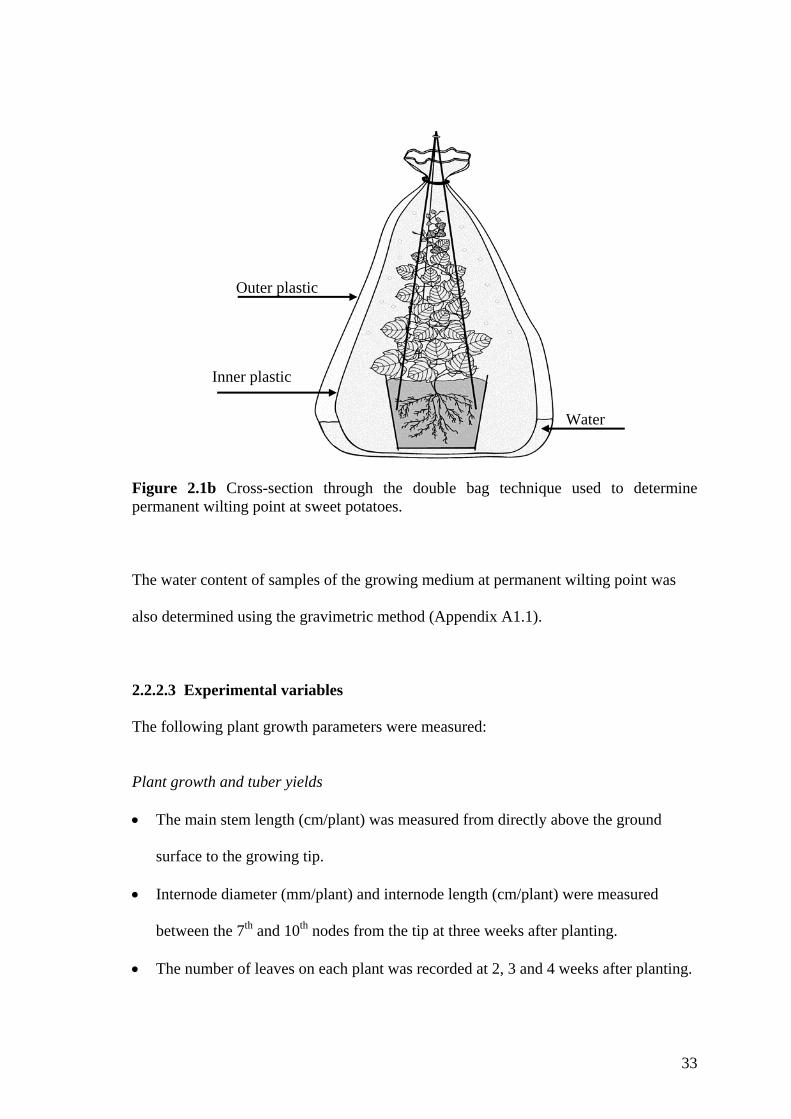
Outer plastic
Inner plastic
Water
Figure 2.1b Cross-section through the double bag technique used to determine permanent wilting point at sweet potatoes.
The water content of samples of the growing medium at permanent wilting point was
also determined using the gravimetric method (Appendix A1.1).
2.2.2.3 Experimental variables
The following plant growth parameters were measured:
Plant growth and tuber yields
• The main stem length (cm/plant) was measured from directly above the ground
surface to the growing tip.
• Internode diameter (mm/plant) and internode length (cm/plant) were measured
between the 7th and 10th nodes from the tip at three weeks after planting.
• The number of leaves on each plant was recorded at 2, 3 and 4 weeks after planting.
33

After the plants had permanently wilted, they were destructively sampled and the
following parameters were measured using the methods in Appendix A1. 3.1 and were
recorded:
• Fresh and dry shoot mass,
• Root weight (only in Experiment 1b).
• Tuber weight
• Leaf area per plant.
• Specific leaf area per plant.
• Leaf dry matter content.
Plant water relations
• Transpiration.
The method of measuring transpiration is presented in Appendix A1.3.4.
Transpiration was recorded as daily losses of weight of the pots and plants, and
observations began 7 days after planting when the plants were well established. The
measurements were continued until the plants reached permanent wilting point.
• Leaf water potential
Leaf water potential was measured using young fully expanded leaves of 4 plants
for each cultivar in a pressure chamber. The measurements were carried out between
09.00 am and 14.00 pm (Appendix A1.3.4).
34
2.2.3 Field trial with non-limiting water
2.2.3.1 Experimental design
A well watered field experiment was conducted over the period November 2000 to
March 2001 in the Genetic Garden of the School of Marine and Tropical Biology,
James Cook University (Fig. 2.2). The total rainfall over the experimental period was
906 mm and it fell on 68 raindays. These water additions were supplemented by
watering the plants by a fixed sprinkler system every second day when there was no
rain.
Figure 2.2 Sweet potato cultivars grown under non-limiting water conditions in the Genetic Garden of the School of Marine and Tropical Biology, James Cook University, Townsville. Photograph taken on 30 January 2001.
A randomised complete block design was used in the experiment. Each cultivar was
randomly allocated in each block. The plot size was 12 m x 8 m, consisting of 6 rows
that were 100 cm apart, representing 6 replications with plant spacings of 75 cm along
each row.
35
2.2.3.2 Experimental procedure
The land that had not grown sweet potato previously was cultivated by a tractor–drawn
rotary hoe and any remaining plants and stones were removed. The area was then
lightly cultivated by hand using a hoe, and soil mounds up to 30 cm high were formed.
After watering the site daily for 15 days, vine-tip cuttings 25 cm long were planted with
a single cutting in the moist soil of each mound. An organic fertiliser (Australian
fertilizer product) with the composition of 3% N, 3% P, 4.5% K, 0.1% Fe, 0.06% Mn,
0.03% Zn) was applied in the soil at 10 g/m2 (100 kg/ha) one day before planting, and
again at 4 and 8 weeks after planting.
Weeds were removed manually. Irrigation was applied using overhead sprinklers during
the first month of crop establishment. Plants were irrigated once a day for the first
month. During tuber formation and bulking in the following months until harvest stage,
the plants were irrigated twice a week, depending on the rainfall. Two months after
planting, the morphological characters of the leaf and vine were recorded using the
descriptive system of Huaman (1992). Leaf and node measurements were carried out on
the eight nodes from the shoot tip.
2.2.3.3 Experimental variables
At harvest, and after drying at 40 oC, the following plant biomass and root tuber data
were collected:
• Total fresh and dry weights of the above ground biomass. All plants were cut off at
ground level and their leaves and vines were separated and weighed.
• Fresh and dry tuber weights per plant. Marketable tubers (tubers weighing more
than 120 g/tuber) were separated from the smaller, unmarketable tubers.
36
• Tuber numbers per plant.
2.2.3.4 Statistical analyses
Plant growth response data were analysed using an analysis of variance of the Statistical
Package for Social Scientists (SPSS 10.0 for Windows) at a 5% (p < 0.05) significance
level. When the effects of various treatments were significant, post hoc comparisons
were carried out using Bonferroni’s method.
2.3 RESULTS AND DISCUSSION
2.3.1 Weather conditions
For Experiment 1a, daily minimum and maximum air temperatures, and relative
humidity were recorded from November to December 2000 (Fig. 2.3). The maximum
and minimum temperatures inside the glasshouse were also recorded. The maximum
temperature was approximately 6 0C higher than the outside glasshouse, whereas the
minimum temperatures were relatively similar. For Experiment 1b, similar temperatures
occurred over the experimental period (February to March 2001) (Fig. 2.4).
The plants were grown under non-limiting water conditions in the field in the Genetic
Garden between 28 November 2000 and 30 March 2001. Prior to the field experiment
starting, 345 mm of rain had fallen marking the early onset of the wet season; it was
sufficient to support the initial plant growth. The amount of rainfall declined in
December 2000 into 219 mm and to 58 mm in January 2001. During the periods when
there was no rain, the plants were watered by using a fixed sprinkler system. In
February 2001, the rainfall increased to 236 mm, and supported tuberous roots
development. The rainfall declined into 58 mm in March 2001 as the tubers matured.
37

0
10
20
30
40
50
60
70
80
90
1 2 3 4 5 6 7 8
November DecemberWeeks
Rel
ativ
e H
umid
ity (%
)
15
20
25
30
35
40
45
50
Tem
pera
ture
(oC
)
Relative HumidityMax Temp Min Temp
Date of planting Date of harvest
Figure 2.3 Experiment 1a: Weekly mean maximum and minimum air temperatures (oC), and relative humidity measured at 3.00 pm (%) at Townsville area, from November to December 2000. Source: Bureau of Meteorology, Australia.
0
10
20
30
40
50
60
70
80
90
1 2 3 4 5 6 7 8 9
February MarchWeeks
Rel
ativ
e hu
mid
ity (%
)
15
20
25
30
35
40
45
50
Tem
pera
ture
(oC
)
Relative HumidityMax TempMin Temp
Date of planting Date of harvest
Figure 2.4 Experiment 1b: Weekly mean maximum and minimum air temperatures, and relative humidity at Townsville area, from February to March 2001. Source: Bureau of Meteorology, Australia.
38

The optimal temperature requirement for sweet potato growth is 24 0C (Kay, 1973).
During Experiment 1a, heavy rain and wind damaged part of the glasshouse roof and
the experiment was terminated in December 2000 after water had penetrated into some
of the drying experimental units. The experiment was repeated (Experiment 1b) in
February and March 2001 and warm temperatures and low relative humidity promoted
rapid growth while moisture was not limiting (Fig. 2.4).
2.3.2 Shadehouse Trial
2.3.2.1 Plant growth and morpho-physiological characters
Effects of water stress on plant growth including main stem length, fresh and dry shoot
mass, leaf area, internode length and diameter, fresh and dry masses of roots, and
morpho-physiology, including specific leaf area and the leaf dry matter, of the 15 sweet
potato cultivars are summarized in Table 2.1.
In general, the imposed water stress had a significant effect on all of the growth
parameters measured except for the internode length. The interactions between water
stress and cultivars were also significant, except for the main stem length, total dry
biomass in Experiment 1a, and dry root mass in Experiment 1b. This suggests that the
general responses of the cultivars to the water treatments were similar, and that it was
just the magnitude of the responses that changed between cultivars.
39

Table 2.1 Summary of the effects of soil water, cultivars, and their interactions with plant growth parameters.
Effects of Plant parameters
Water Cultivar Interaction
• Main stem length -Experiment 1a * * ns -Experiment 1b * * *
• Dry total biomass
-Experiment 1a * * ns -Experiment 1b * * *
• Dry leaf mass
-Experiment 1a * * * -Experiment 1b * * *
• Leaf area
-Experiment 1a * * * -Experiment 1b * * *
• Internode length#) ns * *
• Internode diameter#) * * *
• Fresh root mass#) * * ns
• Dry root mass#) * * ns
• Leaf dry matter content#) * * *
• Specific leaf area#) * * * • Soil water content under the water stressed plants
-Experiment 1a N/A *at 11, 13, 15, 17, 19 21, 23 DAP N/A
-Experiment 1b N/A * at 7, 9, 17, 21 DAP N/A
• Transpiration of the well watered plants -Experiment 1a N/A *at 11, 13, 15, 17, 19,
21 DAP N/A
-Experiment 1b N/A *at 7, 9, 11, 13, 17, 19 DAP N/A
• Leaf water potential * ns ns ns (no significant effect); * p < 0.05); # observed only in Experiment 1 b; DAP = days after planting; N/A = not available
2.3.2.1.1 Main stem length
Water stress significantly reduced stem length in the 15 sweet potato cultivars tested
(Table 2.1, Fig. 2.5 and Table A2: 19-20). The effect of the water stress and cultivar
interaction was only significant in Experiment 1b.
40

Experiment 1a
0
50
100
150
200
250
300
350
400
B.Gold
Hawaii Lo
le
Markha
m
Marike
n
Wan
mun
NG7570
LO32
32 L3 L11
L18
L46
L49
L131
L135
Cultivars
Stem
leng
th (c
m/p
lant
)ControlStress
Experiment 1b
0
50
100
150
200
250
300
350
400
B.Gold
Hawaii Lo
le
Markha
m
Marike
n
Wanmun
NG7570
LO32
32 L3 L11
L18
L46
L49
L131
L135
Cultivars
Stem
leng
ht (c
m/p
lant
)
ControlStress
Figure 2.5 The length of main stem of 15 sweet potato cultivars as affected by soil water conditions. The control relates to the field trial in which water was non-limiting, the stressed conditions relate to the glasshouse trials of Experiments 1a and 1b in which water was withheld until permanent wilting point was achieved. Error bars represent standard errors of means with 3 and 4 replications in experiment 1a and 1b, respectively. (a) Experiment 1a (27 November – 18 December 2000) terminated after 3 weeks of growth because of a leaking glasshouse roof. (b) Experiment 1b (11 February to 12 March 2001) after 4 weeks of growth.
41
The vine branching habit was different among cultivars, although none of them had a
twinning habit: cvv Lole and L18 had more branches than all of the others, and cv Lole
had the smallest main stem diameter. The length of the main stem grew significantly
more slowly in the water-stressed cultivars (Fig. 2.5). The reduction of the main stem
length from well watered to water stressed conditions in Experiment 1a varied between
60% in cultivar L46 and 31% in the Lole and NG7570 cultivars (Fig. 2.5 a). In
Experiment 1b, the reduction varied between 46% in cv L18 and 16% in cv Lole (Fig.
2.5 b). The reduction of stem length in Experiment 1b showed similar pattern to that of
Experiment 1a.
Stem length was measured periodically from week 2 to week 4 after planting. The
length of the main stem in all cultivars under well watered and water stressed conditions
increased from 2 weeks to 4 weeks after planting (Fig. 2.6). While growth of the stem
length under water stress conditions was slower, a significantly greater increase was
recorded in stem lengths grown under well watered conditions. Under well watered
conditions, cv Mariken recorded the longest stem growth in both Experiments 1a and
1b. The Lole cultivar grew very slowly during the first 2 weeks after planting.
The length of the main stem of all the cultivars declined under water stress. According
to Taiz and Zieger (2002), the same physiological processes that limit leaf growth
during stress might affect stem growth. Although cv Lole had the shortest stem, its stem
length reduction under water stress was less than that of the other cultivars, except for
cv NG7570.
42

Cultivars
Experiment 1a (water stress)
050
100150200250300350
B. Gold
Hawaii Lo
le
Markha
m
Marike
n
Wan
mun
NG7570
LO32
3 L3 L11
L18
L46
L49
L131
L135Le
ngth
of m
ain
stem
(c
m/p
lant
)
Experiment 1a (control)
050
100150200250300350
B. Gold
Hawaii Lo
le
Markha
m
Marike
n
Wan
mun
NG7570
LO32
3 L3 L11
L18
L46
L49
L131
L135
2 weeks 3 weeks 4 weeks
Experiment 1b (control)
050
100150200250300350
B. Gold
Hawaii Lo
le
Markha
m
Marike
n
Wan
mun
NG7570
LO32
3 L3 L11
L18
L46
L49
L131
L135
Experiment 1b (water stress)
050
100150200250300350
B. Gold
Hawaii Lo
le
Markha
m
Marike
n
Wan
mun
NG7570
LO32
3 L3 L11
L18
L46
L49
L131
L135
Figure 2.6 The length of main stem of 15 sweet potato cultivars affected by soil water conditions recorded at 2, 3, and 4 weeks after planting from the Experiment 1a and 1b.
43

2.3.2.1.2 Internode length and diameter
Internode length was not affected by the applied soil water stress, but it varied
significantly among the cultivars (Table 2.1). The interaction effect between soil water
regimes and cultivars however was statistically significant (Table 2.1 and Table A2:
27). Under well-watered conditions, cv Mariken produced the greatest internode length,
followed by cvv Markham, L11, and LO323 (Table 2.2). The cultivars with the shortest
internode lengths were cvv Lole and L18. When water was withheld, the internode
length of several cultivars declined. The Mariken cultivar produced the highest
internode length under water stress, followed by cvv Markham, L11, and LO323.
However, cv L46 had the greatest percentage of internode length reduction, followed by
cvv Wanmun, NG7570, LO323, and L18. The internode length of some cultivars,
including Hawaii, Lole, L3, and L135, remained constant when water was withheld.
Water stress significantly decreased the internode diameter in all cultivars (Tables 2.1,
2.2 and Table A2: 28). Internode diameter was slightly reduced in cv Lole (12%),
whereas cultivars LO323, L49, and L131 produced the greatest reduction 30-45%
(Table 2.2). The reduction of internode diameter under water stress agrees with the
findings of Kirnak et all (2001) who observed that water stress in egg plants (Solanum
melongena) reduced both stem length by 46% and internode diameter by 51% when
grown under water stress equivalent to 40% of the soil’s field capacity.
Cultivars Lole and L135 appear to have some drought tolerance, as their internode
diameters were least affected by water stress compared to their growth under well
watered conditions.
44

Table 2.2 Internode length (cm) and diameter (mm) of sweet potato cultivars as affected by soil water condition 3 weeks after planting in Experiment 1b.
Internode length (cm) Internode diameter (mm)
Cultivar Control plant
Water stressed
plant
Stress as % of
control Control
plant
Water stressed
plant
Stress as % of
control
B. Gold 3.6 3.5 97.2 3.8 2.9 76.3 Hawaii 5.8 5.8 100.0 2.5 2.0 80.0 Lole 2.5 2.5 100.0 2.8 2.5 89.3 Markham 7.7 7.6 98.7 3.4 3.0 88.2 Mariken 9.0 8.9 98.9 3.0 2.3 76.7 Wanmun 5.6 5.3 94.6 3.5 3.0 85.7 NG7570 6.3 6.0 95.2 2.3 2.0 87.0 LO323 7.1 6.8 95.8 2.9 2.0 69.0 L3 6.8 6.8 100.0 3.9 3.0 77.0 L11 7.2 7.0 97.2 3.7 2.8 75.7 L18 2.5 2.4 96.0 3.8 3.2 84.2 L46 5.4 5.0 92.6 3.8 3.1 81.6 L49 5.0 4.9 98.0 5.1 3.4 66.7 L131 6.1 5.9 96.7 3.0 2.0 66.7 L135 5.0 5.0 100.0 2.7 2.4 88.9
A significant difference between pairs of columns is presented in Table A2: 9-10.
2.3.2.1.3 Dry biomass
Water stress significantly reduced dry biomass in Experiments 1a and 1b, and the
response was varied among the 15 sweet potato cultivars (Table 2.1 and Table A2: 21-
22). The interactions also indicated that the cultivars tested responded differently to soil
water conditions (Fig. 2.7).
45

Experiment 1a
0
10
20
30
40
50
B.Gold
Hawaii
LoleMarkham
Mariken
Wanmun
NG7570
LO3232
L3 L11L18
L46L49
L131L135
Cultivar
Dry
bio
mas
s (g
/pla
nt)
Stress plant
Experiment 1b
0
10
20
30
40
50
B. Gold
Hawaii
LoleMarkham
Mariken
Wanmun
NG7570
LO323
L3 L11L18
L46L49
L131L135
Cultivar
Dry
bio
mas
s (g
/pla
nt)
Control plant
Stress plant
Control plant
Figure 2.7 Total dry plant biomass (sum of dry shoots and dry roots) of 15 sweet potato cultivars affected by soil water conditions (Experiments 1a and 1b). Water stress reduced the average dry biomass (31-46 %) with respect to that produced
by plants under the non-limiting water regime. Under water stress conditions, the total
plant dry masses of cvv Beerwah Gold and L3 were reduced by 31% and 59%
compared to the well watered control (Fig. 2.7, Table A2: 3-4). The Lole and Hawaii
cultivars produced the lowest percentage reduction in dry biomass.
46

2.3.2.1.4 Dry leaf mass
Water stress significantly reduced dry leaf masses of the 15 cultivars tested (Tables 2.1
and A2: 23-24). The interaction effect between water treatments and cultivars was
significant in experiment 1b.
Table 2.3 Dry leaf masses (g/plant) of sweet potato cultivars as affected by soil water condition in Experiment 1a. The control plants were grown in the field under non-limiting water conditions. Dry leaf mass (g/plant) Cultivar Control plants Water stressed
plants Stress as % of
control Beerwah Gold 11.1 3.0 27.0 Hawaii 15.5 3.0 19.4 Lole 12.4 4.8 38.7 Markham 13.6 2.6 19.1 Mariken 13.6 2.2 16.2 Wanmun 12.7 2.9 22.8 NG7570 13.5 2.5 18.5 LO323 13.3 3.2 24.1 L3 11.5 2.2 19.1 L11 13.6 2.1 15.4 L18 13.5 2.4 17.8 L46 13.8 3.7 26.8 L49 10.7 2.4 22.4 L131 11.8 3.5 29.7 L135 11.2 2.3 20.5 A significant difference among the cultivars is presented in Table A2: 5.
47

LoleHawaiiBeerwah Gold
Markham WanmunMariken
NG 7570 LO 323 L 3
L 11 L 46L 18
Figure 2.8 Leaf morphological characters of 15 sweet potato cultivars studied.
L 131 L 135L 49
48

Table 2.4 Dry leaf mass (g) of sweet potato cultivars as affected by soil water conditions in Experiment 1b. The control plants were grown in the field under non-limiting water conditions.
Dry leaf mass (g/plant) Cultivar Control plants Water stressed
plants Stress as % of
control Beerwah Gold 12.6 4.3 34.1 Hawaii 9.4 2.9 30.9 Lole 9.2 3.4 37.0 Markham 11.8 3.9 33.1 Mariken 11.1 2.6 23.4 Wanmun 12.1 2.9 24.0 NG7570 11.8 2.6 22.0 LO323 13.2 4.1 31.1 L3 12.8 2.9 22.7 L11 10.5 3.3 31.4 L18 12.1 2.6 21.5 L46 12.0 3.9 32.5 L49 12.1 3.4 28.1 L131 10.0 3.7 37.0 L135 12.0 3.6 30.0
A significant difference between pairs of columns is presented in Table A2: 6.
Leaf mass declined significantly under the water stress condition in Experiments 1a and
1b (Tables 2.3 and 2.4). The leaf masses of cvv Lole and L131 were least affected by
water stress, and the most affected were cvv L18, NG7570, L3, LO323, L3, Mariken
and Wanmun.
The leaf mass data suggest that cultivars Lole, Hawaii and L131 have some drought
tolerance, as they were less affected by the water stress compared to their growth under
well watered conditions. On the other hand, the cultivars Mariken and L18 appear to be
sensitive to water stress as their leaf masses were reduced the most by the imposed
water stress.
49

2.3.2.1.5 Root masses Root masses were recorded only in Experiment 1b. Water stress significantly reduced
the root fresh and dry masses of the roots of all of the sweet potato cultivars studied.
There were no significant interactions between cultivar and soil water treatments
(Tables 2.1, 2.5, and A2: 29-30).
This suggests that root growth was severely affected by water stress. Under well
watered and stressed conditions, the greatest fresh root mass was produced by cv
Mariken, whereas the lowest fresh root mass was produced by cvv Lole, L18, and L11.
The greatest dry root mass, on the other hand was from cv Markham and the lowest was
from cv L135 (Table 2.5).
Table 2.5 Fresh and dry masses of roots of sweet potato cultivars (g) as affected by soil water condition in Experiment 1b.
Fresh root mass (g) Dry root mass (g)
Cultivar Control plant
Water stressed
plant
Stress as % of
control Control
plant
Water stressed
plant
Stress as % of
control
B. Gold 93.9 8.7 9.3 4.6 1.4 30.4 Hawaii 71.3 6.9 9.7 3.6 1.1 30.6 Lole 63.9 6.2 9.7 3.4 1.1 32.4 Markham 90.9 8.5 9.3 5.5 1.7 30.9 Mariken 100.7 12.2 12.1 4.4 1.0 22.7 Wanmun 85.3 7.2 8.4 4.4 1.2 27.3 NG7570 75.4 6.7 8.9 3.9 1.2 30.8 LO323 99.6 11.6 11.6 3.7 1.2 32.4 L3 95.8 8.5 8.9 4.3 1.4 32.6 L11 69.2 6.3 9.1 4.8 1.2 25.0 L18 66.7 5.8 8.7 3.5 1.2 34.3 L46 76.4 6.8 8.9 4.4 1.4 31.8 L49 87.7 8.4 9.6 5.0 1.4 28.0 L131 75.3 5.9 4.5 1.3 7.8 28.9
79.8 7.0 L135 8.8 3.5 0.6 17.1 A significant difference between pairs of columns is presented in Table A2: 11-12.
50

The mass of fresh and dry roots did not vary consistently across all of the 15 cultivars
studied. In terms of the reduction in dry root mass when grown under water stress,
cultivar L18 appears to have the most drought tolerance, while cultivars L135 and
Mariken were the most sensitive to water stress as their dry root masses were reduced
the most under such conditions. The decline in root mass under water stress is probably
a result of the loss of turgor in expanded cells (Kirnak et al., 2001).
2.3.2.2 Leaf shape and area
The shapes and sizes of leaves vary widely among sweet potato cultivars (Bhagsari and
Brown, 1986; Huaman, 1997). The general leaf shapes of sweet potato cultivars are
shown in Figure 2.9.
Leaf shape
Rounded Reuniform Cordate Triangular
Hastate Lobed Almost divided Figure 2.9 The general leaf shapes of sweet potato cultivars (Huaman, 1997).
Of the 15 sweet potato cultivars of the present study, the leaf shapes of 8 were cordate
(Beerwah Gold, LO323, Markham, Mariken, L131, L135, NG7570, L3 cultivars with
51

triangular and semi-elliptic leaf types), 2 (L 46 and L 49) were hastate, 3 (L 11, L 18,
Hawaii) were lobed, 1 (Lole) was deeply lobed and almost divided, and 1 cultivar
(Wanmun) was triangular and cordate.
The leaf sizes among the 15 cultivars were variable. Some cultivars such as Lole, L18,
L11, L46, L46, and Hawaii were characterized by smaller leaves with lanceolate lamina
and deep lobes resulting in reduced leaf area. Low transpiration and efficient growth
under water stressed conditions are often attributed to this important plant parameter
(Taiz and Zieger, 2002).
The cultivars of the present study producing the greatest leaf area under well-watered
conditions were NG7570, Beerwah Gold, and LO323, whereas cvv Hawaii, Markham,
NG7570, LO323, and L46 had the greatest leaf area under the water stressed conditions.
There was a significant reduction in the leaf area of all the 15 cultivars due to water
stress (Tables 2.1 and 2.6, and Table A2: 25-26).
52

Table 2.6 Leaf area of sweet potato cultivars (cm2 / plant) as affected by soil water conditions in Experiment 1a and 1b.
Leaf area (cm2/plant)
Experiment 1a Experiment 1b Cultivar
Control plant
Water stressed plants
Stress as % of
control
Control plants
Water stressed plants
Stress as % of
control
B. Gold 3914.7 691.0 17.5 3890.8 771.2 19.8 Hawaii 2894.7 1108.2 38.3 3216.1 838.8 26.1 Lole 2105.8 875.6 41.6 2113.6 755.9 35.8 Markham 3551.5 1047.3 29.5 3716.4 888.5 23.9 Mariken 3403.7 786.8 23.1 3523.9 770.5 21.9 Wanmun 3481.0 889.3 25.5 3488.9 823.4 23.6 NG7570 4012.5 955.3 23.8 4065.0 867.8 21.3 LO323 3914.7 880.0 22.5 4160.3 851.3 20.5 L3 3741.4 846.5 22.6 3870.9 817.7 21.1 L11 3072.4 815.4 26.5 3682.3 819.4 22.3 L18 3349.7 740.8 22.1 3609.0 761.9 21.1 L46 2962.4 757.4 25.6 3809.1 841.9 22.1 L49 3556.5 739.1 20.8 2972.3 814.1 27.4 L131 2358.1 896.3 38.0 2347.9 823.8 35.1 L135 2621.2 868.7 33.1 2773.3 797.9 28.8
A significant difference between pairs of columns is presented in Table A2: 7-8.
The leaf area data suggest that cultivars Lole, Hawaii, and L131 have some drought
tolerance, as their leaf area was least affected by water stress compared to their growth
under well watered conditions. On the other hand the cultivar Beerwah Gold appears to
be the most sensitive to water stress as its leaf area was reduced the most under such
conditions. The leaf area of sugar beet (Beta vulgaris L.) was reported to be reduced by
84% under drought conditions (Abdollahian-Noghabi and Froud-William, 1998), and
this is comparable with the reduction in leaf area observed in the present sweet potato
trial (Table 2.6).
53

2.3.2.3 Leaf dry matter content and specific leaf area
Leaf dry matter and specific leaf area, determined according to the methods set out in
Appendix A1.3.1, varied significantly among the 15 sweet potato cultivars studied.
Water stress significantly reduced leaf dry matter content and the specific leaf area
recorded in Experiment 1b. The interaction between water regimes and cultivars was
statistically significant (Tables 2.1 and A2: 31-32).
The Beerwah Gold cultivar recorded greatest leaf dry matter content under the well-
watered treatment, followed by cv LO323. In the stressed treatment, cv L131 recorded
greatest leaf dry matter, followed by cvv L135 and Lole (Table 2.7). The NG7570
cultivar produced the greatest specific leaf area under both the control and water
stressed treatments, while cv Beerwah Gold recorded the lowest specific leaf area under
water stress.
54

Table 2.7 Effect of water stress on leaf dry matter content and specific leaf area of fifteen sweet potato cultivars in Experiment 1b.
Leaf dry matter content (g) Specific leaf area (cm2/g) Cultivars
Control plant Water stressed plant Control plant Water
stressed plant
Beerwah Gold 0.365 0.144 308.7 180.1 Hawaii 0.275 0.132 344.3 215.4 Lole 0.239 0.173 229.3 227.3 Markham 0.278 0.167 312.2 234.9 Mariken 0.200 0.166 317.1 295.7 Wanmun 0.228 0.168 289.2 286.0 NG7570 0.179 0.152 346.1 340.3 LO323 0.333 0.167 316.0 208.6 L3 0.215 0.167 305.4 294.2 L11 0.228 0.143 354.9 252.8 L18 0.199 0.157 298.0 296.9 L46 0.270 0.171 317.8 219.4 L49 0.246 0.156 245.1 243.5
0.209 0.192 238.1 220.7 L131 0.249 0.184 233.3 225.6 L135
A significant difference between pairs of columns is presented in Table A2: 13-14.
Garnier et al. (2001) have shown that leaf dry matter reflects a fundamental trade-off in
plant functioning between a rapid production of biomass (in species with high specific
leaf area and low leaf dry matter contents), and an efficient conservation of nutrients (in
species with low specific leaf area and high leaf dry matter content species). Under the
well watered control treatment, the Beerwah Gold cultivar produced the greatest leaf
dry matter content, whereas cv L131 produced the highest leaf dry matter content under
water stressed conditions. Cultivar NG7570 produced the greatest specific leaf area in
both the control and water stressed conditions. During the early vegetative period, on
the other hand, cv Lole produced the lowest specific leaf area in the control, thus it had
thicker leaves per plant. Thicker leaves means that Lole has an efficient transpiration
55

rate per unit weight of leaves, suited to low water availability conditions (Pugnaire
et al., 2002).
2.3.2.4 Water relations
Soil water content was recorded for the plants grown under water stressed conditions,
while transpiration was recorded for the plants grown under well-watered conditions.
To evaluate the plant water status, leaf water potentials were recorded in Experiment 1b.
Effects of water stress on water relations including transpiration and leaf water potential
of 15 sweet potato cultivars are summarized in Table 2.1 and Fig. 2.10.
2.3.2.2.1 Soil water content
The water contents of the media in which the plants were grown under water stress
conditions was recorded from day 7 after planting. The water losses recorded allow an
estimate of transpiration from the stressed plants and are shown in Fig. 2.10.
In the first 7 days after withholding water, the amount of water in the soil remained
high, indicating that the physiological function had not yet been affected, as the plants
were still small, and had not used much water at that stage. However, as the soil water
was further depleted, transpiration rates rapidly decreased between 7 and 21 days after
planting. Transpiration then remained low and was almost constant; the leaves
progressively wilted and reached permanent wilting point. According to Leopold
(1964), as the soil water availability declines, leaf cells loose their turgor; this affects
the leaf photosynthesis due to stomatal closure and physical disruption of the leaf cells.
56

This suggests that water extraction increased when the plant growth progressed
particularly under well-watered conditions, as a result of active increases in biomass
production and leaf area. These, in turn, increased the transpiration rate and the demand
for water for metabolic and physiological functions. The Lole cultivar showed a lower
transpiration rate than all other cultivars under both watering regimes (Figs 2.10 and
2.11). Garner et al. (1992) found a drought tolerant sweet potato cultivar (cv Vardaman)
with a lower transpiration rate than all of the other cultivars that they examined; this
was attributed to its capability to maintain cellular integrity during water stress and to
conserve water under drought conditions.
57

Beerwah Gold
0200400600800
100012001400
7 9 11 13 15 17 19 21 23 25 27 29
Exp 1aExp 1b
Hawaii
0200400600800
100012001400
7 9 11 13 15 17 19 21 23 25 27 29
Exp 1a
Exp 1b
Lole
0200400600800
100012001400
7 9 11 13 15 17 19 21 23 25 27 29
Exp 1a
Exp 1b
Markham
0200400600800
100012001400
7 9 11 13 15 17 19 21 23 25 27 29
Exp 1a
Exp 1b
Mariken
0200400600800
100012001400
7 9 11 13 15 17 19 21 23 25 27 29
Exp 1a
Exp 1b
Wanmun
0200400600800
100012001400
7 9 11 13 15 17 19 21 23 25 27 29
Exp 1a
Exp 1b
NG7570
0200400600800
100012001400
7 9 11 13 15 17 19 21 23 25 27 29Wat
er c
onte
nt (g
/kg) Exp 1a
Exp 1b
LO323
0200400600800
100012001400
7 9 11 13 15 17 19 21 23 25 27 29
Exp 1a
Exp 1b
L3
0200400600800
100012001400
7 9 11 13 15 17 19 21 23 25 27 29
Exp 1a
Exp 1b
L11
0200400600800
100012001400
7 9 11 13 15 17 19 21 23 25 27 29
Exp 1a
Exp 1b
L18
0200400600800
100012001400
7 9 11 13 15 17 19 21 23 25 27 29
Exp 1a
Exp 1b
L46
0200400600800
100012001400
7 9 11 13 15 17 19 21 23 25 27 29
Exp 1a
Exp 1b
L49
0200400600800
100012001400
7 9 11 13 15 17 19 21 23 25 27 29
Exp 1a
Exp1b
L 131
0200400600800
100012001400
7 9 11 13 15 17 19 21 23 25 27 29
Exp 1a
Exp 1b
L135
0200400600800
100012001400
7 9 11 13 15 17 19 21 23 25 27 29
Exp 1a
Exp 1b
Days after planting
Figure 2.10 Water content (g of water /kg of soil) of the growing media of 15 sweet potato cultivars under water stress conditions, recorded from 7 days after planting until the day on which the plants permanently wilted in Experiments 1a and 1b.
58

Under well watered conditions, transpiration increased rapidly from the initial growth
stage at 7 days to 23 days after planting (Fig. 2.10). On the other hand, transpiration of
the water stressed plants declined when soil water availability declined.
Water losses due to transpiration are highly variable across plant species: maximal
transpiration rates of 10, 1.0, and 0.1 g of water dm-2h-1 have been recorded in
hygrophytes, mesophytes, and xerophytes, respectively (Monneveux and Belhassen,
1996). In the present trial, withholding soil water gradually produced a soil moisture
stress which reached permanent wilting point. It showed that water availability is crucial
in establishing stem cuttings and in supporting subsequent vegetative growth. Lack of
water during the early growth stages acted as a growth retardant.
59

Beerwah Gold
0
200
400
600
800
7 9 11 13 15 17 19 21
Exp 1a
Exp 1b
Hawaii
0
200
400
600
800
7 9 11 13 15 17 19 21
Exp 1a
Exp 1b
Lole
0
200
400
600
800
7 9 11 13 15 17 19 21
Exp 1a
Exp 1b
Markham
0
200
400
600
800
7 9 11 13 15 17 19 21
Exp 1a
Exp 1b
Mariken
0
200
400
600
800
7 9 11 13 15 17 19 21
Exp 1a
Exp 1b
Wanmun
0
200
400
600
800
7 9 11 13 15 17 19 21
Exp 1a
Exp 1b
NG7570
0
200
400
600
800
7 9 11 13 15 17 19 21
Tran
spira
tion
(g/k
g)
Exp 1a
Exp 1b
LO323
0
200
400
600
800
7 9 11 13 15 17 19 21
Exp 1a
Exp 1b
L3
0
200
400
600
800
7 9 11 13 15 17 19 21
Exp 1a
Exp 1b
L11
0
200
400
600
800
7 9 11 13 15 17 19 21
Exp 1a
Exp 1b
L18
0
200
400
600
800
7 9 11 13 15 17 19 21
Exp 1a
Exp 1b
L46
0
200
400
600
800
7 9 11 13 15 17 19 21
Exp 1a
Exp 1b
L49
0
200
400
600
800
7 9 11 13 15 17 19 21
Exp 1a
Exp 1b
L131
0
200
400
600
800
7 9 11 13 15 17 19 21
Exp 1a
Exp 1b
L135
0
200
400
600
800
7 9 11 13 15 17 19 21
Exp 1a
Exp 1b
Days after planting
Figure 2.11 Cumulative transpiration (g of water / kg of soil) of 15 sweet potato cultivars recorded from 7 days to 21 days after planting grown under well watered conditions in Experiments 1a and 1b.
60

Soil water contents at permanent wilting point under the 15 cultivars, and the number of
days taken by each cultivar to reach permanent wilting point are presented in Table 2.8.
The Beerwah Gold cultivar was severely affected by restricted water and reached
permanent wilting point at only 17 days after planting and the soil water content at that
time was 240 g of water per 4.5 kg of soil medium (soil moisture content = 14.8%). On
the other hand, cvv Hawaii and Lole needed 25 and 27 days, respectively to reach
permanent wilting point and the soil moisture content at that time was 170 and 174 g of
water per 4.5 kg of soil medium (10.7% and 10.4%, respectively).
Table 2.8 Evaluation of drought tolerance characters of 15 sweet potato cultivars based on the amount of water remaining in the growing media when the plants reached permanent wilting point and the number of days to reach permanent wilting point in the water stressed plants. Data are from Experiment 1b.
Soil water content(g of water/pot)
Soil Moisture Content (%)
Number of days o reach permanent
wilting point
Drought tolerance Cultivar
Lole 170 10.4 27 Good Hawaii 174 10.7 25 Good Markham 191 11.8 23 Moderate L11 181 11.2 23 Moderate L46 179 11.0 23 Moderate L49 174 10.7 23 Moderate L131 173 10.7 23 Moderate L135 172 10.6 23 Moderate L18 158 9.8 23 Moderate Mariken 179 11.0 21 Moderate Wanmun 163 10.1 21 Moderate NG7570 163 10.1 21 Moderate L3 199 12.3 21 Moderate LO323 239 14.8 21 Poor Beerwah Gold 240 14.8 19 Poor
A significant difference between pairs of columns is presented in Table A2: 15.
61

Based on the number of days to reach permanent wilting point and the soil moisture
content at that stage (Table 2.8), cvv Lole and Hawaii appeared to be the most drought
tolerant cultivars, while the least drought tolerant plants wilted earlier, and retained the
highest soil moisture content in the growing media at permanent wilting point.
The number of days to reach permanent wilting point was statistically significant among
the cultivars (Table A2: 35). Based on the results of the statistical analysis (Table 2.8),
cv Lole had a significantly longer survival period until the onset of permanent wilting,
hence was more drought tolerant, than all the other cultivars. On the other hand,
however, the Beerwah Gold cultivar had a significantly shorter survival period, and was
more drought sensitive, than all of the cultivars except for cvv Mariken, Wanmun,
NG7570, LO323, and L3 which had similar drought sensitivities.
2.3.2.4.2 Leaf water potential
Leaf water potential was not statistically significant among the cultivars on the day
when the plants reached permanent wilting point, but it was significantly different
between plants grown under well watered and water stressed conditions (Fig. 2.12 and
Table A2: 36).
62
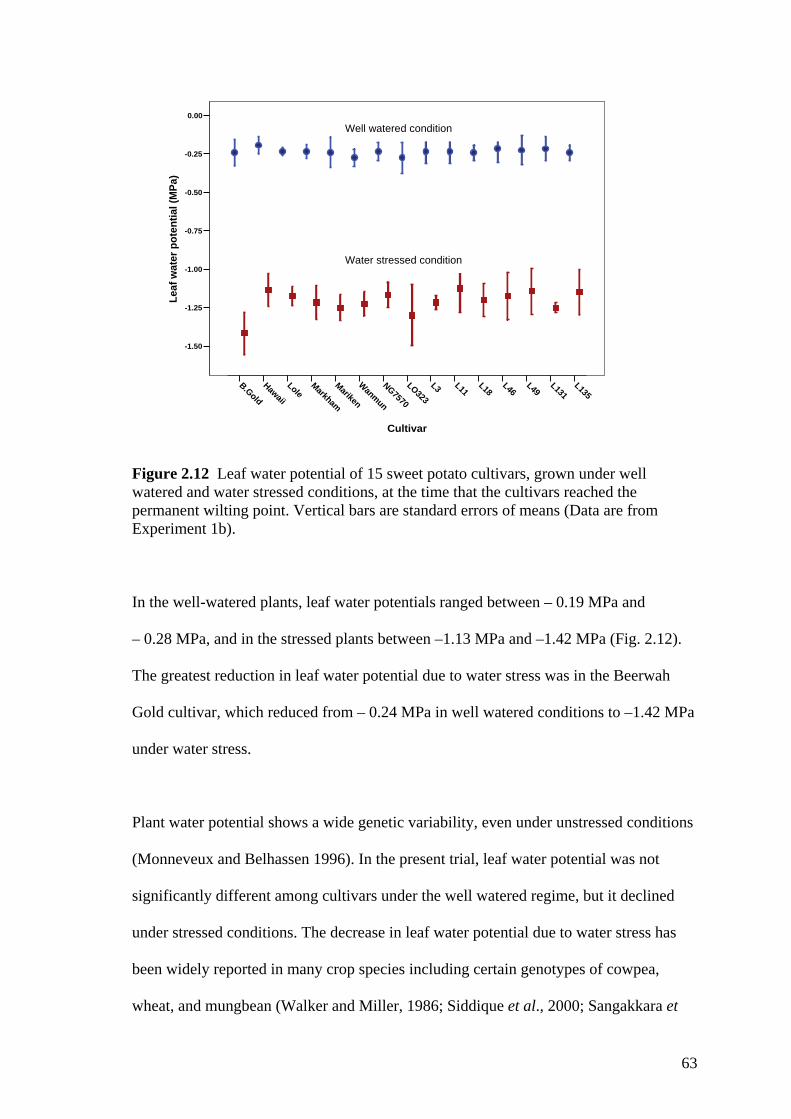
L135L131
L49L46
L18L11
L3LO323
NG7570
Wanmun
Mariken
Markham
LoleHawaii
B.Gold
Cultivar
0.00
-0.25
-0.50
-0.75
-1.00
-1.25
-1.50
Leaf
wat
er p
oten
tial (
MPa
)
Well watered condition
Water stressed condition
Figure 2.12 Leaf water potential of 15 sweet potato cultivars, grown under well watered and water stressed conditions, at the time that the cultivars reached the permanent wilting point. Vertical bars are standard errors of means (Data are from Experiment 1b). In the well-watered plants, leaf water potentials ranged between – 0.19 MPa and
– 0.28 MPa, and in the stressed plants between –1.13 MPa and –1.42 MPa (Fig. 2.12).
The greatest reduction in leaf water potential due to water stress was in the Beerwah
Gold cultivar, which reduced from – 0.24 MPa in well watered conditions to –1.42 MPa
under water stress.
Plant water potential shows a wide genetic variability, even under unstressed conditions
(Monneveux and Belhassen 1996). In the present trial, leaf water potential was not
significantly different among cultivars under the well watered regime, but it declined
under stressed conditions. The decrease in leaf water potential due to water stress has
been widely reported in many crop species including certain genotypes of cowpea,
wheat, and mungbean (Walker and Miller, 1986; Siddique et al., 2000; Sangakkara et
63

al., 2000). Siddique et al. (2000) found that leaf water potential of wheat decreased
from –0.63 MPa in well watered plants to – 2.00 MPa in stressed plants. This was
thought to be a response to drought stress: leaf and canopy temperature increased due
to increased respiration and decreased transpiration, and affected the photosynthetic rate
due to stomatal closure (Siddique et al., 2000).
Transpiration from plants largely depends upon the size of the evaporating areas
(leaves, stems) (Monneveux and Belhassen, 1996). In the present study, the sweet
potato cultivars with genetically larger leaves and vines showed wilting symptoms
earlier than those with smaller leaves and low vine vigour. For example, cvv Lole and
Hawaii used less water than the larger, more vigorous cultivars with larger leaves such
as Beerwah Gold, LO323, Mariken, Markham, and Wanmun, which therefore had a
greater capacity to transpire more rapidly and to exhaust the soil water supply.
2.3.3 Field trials
Sweet potato vines varied morphologically among cultivars (Table 2.9). The internode
diameters were very thin to thin (3.5 - 12 mm), and the internode length was very short
to intermediate (3.5 - 12 mm; Table 2.9). Leaves of some of the cultivars had sparse tip
pubescences, except for cultivar L49, which had a moderate tip pubescence.
64

Table 2.9 Morphological characteristics of 15 sweet potato cultivars grown in the field under non-limiting water conditions.
Vine Characters Cultivars
Leaf shape Plant type
Petiole length (cm)
Internode diameter (mm)
Internode length (cm)
Mature leaf length (cm)
Tip Pubescence
Beerwah Gold Cordate Erect 15 Thin (6) Very short (3.5) 13 No
Hawaii Lobed Erect 8 Thin (5) Short (6.0) 12 Sparse
Lole Deep lobed and almost divided
Erect 8 Very thin (3)
Very short (2.5) 12 None
Markham Triangular Erect 10 Thin (6) Intermediate (7.5) 13 Intermediate
Mariken Cordate Erect 9 Thin (6) Long (10.0) 13.5 Sparse
Wanmun Cordate Erect 9 Thin (4) Short (5.5) 13.5 Intermediate
NG7570 Cordate Erect 9 Thin (5) Short (6.0) 12 Intermediate
LO323 Cordate Erect 12 Thin (6) Intermediate (7.5) 16.5 Sparse
L3 Cordate Erect 10 Thin (4) Short (3.5) 13 Sparse
L11 Lobed Erect 6 Thin (5) Short (7.0) 14 Sparse
L18
Lobed Erect 5.5 Thin (5) Very short (2.5) 12 None
L46 Hastate Erect 9 Thin (5) Short
(5.5) 15 None
L49 Hastate Erect 11 Thin (5) Short (5.0) 14 Moderate
L131 Cordate Erect 6 Thin (5) Very short (6.0) 14 None
Thin (4) Short Cordate Erect 6 L135 (5.0) 14 None
2.3.3.1 Shoot mass and tuber yield components
Differences among fresh and dry shoot masses, and tuber weights and numbers per
plant are summarised in the Table 2.10
65

Table 2.10 Summary of the effects of different cultivars on the plant growth parameters and tuber yield.
Plant parameters Effect of cultivars
* • Fresh shoot mass ns • Dry shoot mass * • Total tuber mass * • Marketable tuber number
ns (no significant); * (significant at p < 0.05)
2.3.3.1.1 Fresh shoot mass
Fresh shoot mass was significantly different among the 15 sweet potato cultivars
studied but dry shoot mass was not (Table 2.10 and Table A2: 37). The Mariken
cultivar had the greatest fresh shoot mass and cv Beerwah Gold the least (Fig. 2.13).
Cultivar
Beerwah Gold
NG7570
Hawaii
LoleLO323
L3L18L49
L46Markham
Wanmun
L135L11
L131Mariken
Sho
ot fr
esh
wei
ght (
g/pl
ant) 1600
1400
1200
1000
800
600
400200
Figure 2.13 Fresh shoot mass of 15 sweet potato cultivars grown under non-water stressed field conditions. Error bars represent standard errors of means with 6 replications.
Beerwah Gold, LO323, and Wanmun were the cultivars that produced the largest leaf
areas during vegetative growth (Table 2.6). However, when the plants reached the tuber
bulking or maturity stage, the production of young leaves diminished and the total mass
66

of plant leaves declined rapidly as assimilates were diverted from the source (leaves) to
the sink (or root storage organs) as the tubers developed. The older leaves turned
yellow and dropped at this stage.
According to Bouwkamp (1983), limited leaf growth at the tuber bulking period is
related to the mobilization of assimilate from the leaves and results in greater tuber
yields. Lower shoot biomasses weight at harvest can be attributed to the senescing
leaves which may lose as much as 50% of their fresh weight in the form of soluble
organic nitrogen compounds that are transported to the developing sinks in the tubers
(Hopkins, 1999).
2.3.3.1.2 Numbers and yield of marketable tubers
Variations in the number of tubers produced by different sweet potato cultivars has been
widely reported (Bourke, 1984; Sen et al., 1990). The number of marketable tubers
(tubers > 120 gram) produced by the unstressed plants in the present study was also
significantly influenced by the cultivar, ranging from 2 (cv Hawaii) to 6 (cv Beerwah
Gold; Table 2.10, Fig. 2.14 and Tables A2: 15 and 38).
The more drought tolerant cultivars such as Hawaii, Lole, L11, L18, L49, and L135
produced relatively fewer tubers per plant, which is explained by their low (or late)
tuber initiation capability as a consequence of genotypic differences.
67

Cultivar
Hawaii
L11L18
LoleL135
L49Markham
L46L3Wanmun
NG7570
Mariken
LO323
Beerwah Gold
Tube
r num
ber/p
lant
7
6
5
4
3
2
10
Figure 2.14 The number of marketable tubers produced by 15 sweet potato cultivars grown under non-limiting water conditions in the field. Error bars represent standard errors of means with 6 replications.
The Beerwah Gold cultivar produced the largest tubers under non-limiting water
conditions in the field (2.3 kg/plant; Fig. 2.15 and Tables A2: 16 and 39). The lowest
tuber masses were produced by the more drought tolerant cultivars, L131, L11, and
Lole.
Cultivar
L131L11
LoleHawaii
Markham
L18L49
L3L135L46
Mariken
Wanmun
NG7570
LO323
B. Gold
Mas
s of
tube
r (kg
/pla
nt)
3.0
2.5
2.0
1.5
1.0
.5
0.0-.5
Figure 2.15 Mass of tubers of 15 sweet potato cultivars grown under non-limiting water conditions in the field.
68

2.4 CONCLUSIONS
Water stress affected plant growth and development differently across the 15 sweet
potato cultivars studied. Plant water status and transpiration were significantly and
progressively affected as the soil water availability declined. All of the sweet potato
cultivars responded to water stress by reducing stem length, internode length and
diameter, total biomass, leaf area, and root mass.
Although water stress reduced the length of the main stem in all of the cultivars, the
degree of its reduction of stem length varied across genotypes. Cultivars Lole showed
less stem length reduction than did the other cultivars. The total plant biomass and leaf
mass were also reduced by water stress but cv Lole showed the least reduction of all of
the studied cultivars.
Leaf shape and area varied among the cultivars and, under water stress conditions, leaf
area declined with cv Lole being the least affected. Internode length and diameter also
declined under water stress with all cultivars showing the relatively similar percentage
reduction of internode length. Internode diameter was slightly reduced in cv Lole,
whereas cultivars, L49, L131 and LO323 showed the greatest reduction under water
stress conditions.
Root mass declined under water stress. The smallest root dry mass reduction was in
cultivar L18, followed by L3, Lole, LO323, and L46. Leaf dry matter and specific leaf
weight varied significantly among the 15 cultivars, and declined under water stress. The
Beerwah Gold cultivar recorded greatest leaf dry matter content, followed by LO 323
under the non-limiting water treatment. Under water stressed conditions, cv L131
69

recorded greatest leaf dry matter content, followed by cvv L135 and Lole. The lowest
specific leaf area under well watered conditions were produced by cvv Lole, L131 and
L135. The NG7570 cultivar produced the greatest specific leaf area in both the control
and water stress treatments, while cv Beerwah Gold produced the lowest specific leaf
area under water stressed condition.
Of the 15 cultivars studied, cv Lole was found to be the most drought tolerant on the
basis of its assessment on the vegetative plant components and water relations. It
showed the smallest percentage of growth reduction compared to other cultivars under
water stress.
Leaf water potential was not significantly different among cultivars under both the
control and water stressed regimes, but progressively declined under increasing water
stress. The Beerwah Gold cultivar, which has larger leaf size, showed a remarkable
decrease in leaf water potential in comparison to the other cultivars. Cultivars Lole and
Hawaii, which took a longer time to reach permanent wilting point under water stress
conditions, had greater leaf water potentials suggesting a better plant water status. They
also transpired lower amounts of water than did the several other cultivars. This
suggests that they are better adapted to dry conditions than the other cultivars tested.
Under well watered conditions in the field, the cultivars Beerwah Gold, LO323,
Mariken, Wanmun, and NG7570 produced significantly higher tuber yields with more
marketable tubers per plant than did the other cultivars under non-limiting water
conditions. Despite their higher tuber yields, the above ground fresh plant masses were
relatively low at harvest time due to assimilate distribution from the leaves to the
developing tubers.
70

Taking into consideration of all the plant parameters listed in Table 2.1, the cultivars
have been ranked in decreasing drought tolerance as:
Lole, Hawaii, Markham, L11, L46, L49, L131, L135, L18, Mariken, Wanmun,
NG7570, L3, LO323, Beerwah Gold.
Although, the present study has identified some drought resistant cultivars, these plants
produced lower tuber yields in terms of numbers of marketable tubers and tuber mass
(Table 2.8, Figures 2.14 and 2.15). The Lole and Wanmun cultivars, both from New
Guinea, showed marked differences in growth and yield characteristics. Drought
tolerance in cv Lole is associated with the lowest percentage reduction in growth, less
water consumption, higher leaf water potential, and delayed wilting under imposed
drought stress conditions. Hence, cv Lole was selected for further study in the other
trials reported in this thesis.
Despite showing strongly developed drought resistant characters, cv Lole produced
much lower tuber yields than cv Wanmun; the latter performed very well under well-
watered conditions, but it was found to be drought sensitive. Under water stress
conditions, the biomass of cv Wanmun was greatly reduced. It also transpired greater
amounts of water vapour, produced lower leaf water potential, and wilted earlier under
water stress. It was also selected for further study because it is a high yielding cultivar
that is commonly grown in Papua New Guinea.
71

CHAPTER 3
EFFECTS OF SOIL WATER REGIMES ON THE GROWTH, PHYSIOLOGY, AND YIELD OF TWO
SWEET POTATO CULTIVARS
3.1 INTRODUCTION
Although sweet potato is considered to be a drought tolerant crop (Constantin et al.,
1974; Hahn and Hozyo, 1984; Ghuman and Lal, 1983), or a moderately drought tolerant
crop (Valenzuela et al., 2000; Ekanayake and Collins, 2004), drought is a major
environmental constraint for sweet potato production in tropical areas where sweet
potato is grown under rain fed conditions (Taufatofua and Fukai, 1996; Anselmo et al.,
1998). In a previous part of the present study reported in Chapter 2 (above) it was
shown that sweet potato severely wilts when the soil water content drops below 20% of
the soil field capacity, and that water stress results in growth reduction.
An excess of water, on the other hand, may reduce the oxygen supply to the roots, and
subsequently limits respiration, nutrient uptake, and other critical root functions
(Hopkins, 1999). The supply of excessive water also inhibits storage root initiation and
development in the early growth stages, and causes tuber decay in the later growth
stages (Collins, 1995). Uneven watering will also cause tuber growth cracks and reduce
yield (Peet, 2000). The water supply, consequently, plays an important role in sweet
potato growth and yield.
The aim of the experiment reported in the present chapter was to study the effects of
soil water regimes on the growth of two sweet potato cultivars: cv Lole, a drought
72

tolerant plant and cv Wanmun, a drought susceptible sweet potato. Specifically, the
experiment aimed to identify the effects of 3 soil water contents (20%, 40%, and 80% of
the soil field capacity) on various plant growth parameters.
3.2 EXPERIMENTAL MATERIALS AND METHODS
3.2.1 Experimental location
A pot experiment was conducted in a shadehouse on the Douglas Campus, James Cook
University, Townsville, North Queensland, Australia, from 2 August to 29 December
2001.
3.2.2 Experimental materials
The Lole and Wanmun cultivars have different growth and yield characteristics that
were discussed in the previous chapter. Despite producing lower tuber yields in the
previous field trial under well watered conditions, cv Lole exhibited less growth
reduction, less water consumption, higher leaf water potential, and delayed wilting
under drought stress conditions, and these were associated with lower leaf area per plant
(Fig. 3.1). On the other hand, cv Wanmun, which produced higher tuber yields, was
found to be sensitive to water stress: its growth severely declined, and it also transpired
a greater amount of water vapour per plant as a consequence of greater leaf area (Fig.
3.1); it was observed to reach permanent wilting point earlier than cv Lole (Table 2.8).
73

Figure 3.1 The Lole (left) and Wanmun cultivars (right).
3.2.3 Experimental design
The two sweet potato genotypes (cvv Lole and Wanmun) were subjected to three water
stress levels that were imposed by maintaining the soil water content at 20%, 40%, and
80% of field capacity. These water contents represent severe water stress (20%),
moderate water stress (40%), and no water stress (80%); below 20% of soil field
capacity the growth and yield of sweet potato plants decreased and above 80% the
sweet potato plants grew poorly as a consequence of poor soil aeration (Ravi and Indira,
1999).
A factorial experiment was used with a complete randomised design and 4 replications.
The total number of experimental units was 132 pots with one plant per pot, to allow for
destructive sampling of replicated treatments at 1, 2, 3, 4 and 5 months after planting.
74

3.2.4 Experimental procedures
Twenty-five centimetre long tip cuttings of the two sweet potato cultivars (Lole and
Wanmun), were planted into non-draining pots of 10 L volume. To reduce evaporation,
the whole of the exterior of the pots and the surface of the growing medium were
covered with aluminium foil. To allow the even distribution of water supply throughout
the growing medium, a light-texture mixture was used; it consisted of a mixture of equal
parts by volume of peat: perlite: vermiculite. The peat was first sun dried to constant
moisture.
Field capacity was determined on 10 soil samples using the method of Appendix A1.1,
as follows. Each pot was filled with 2.2 kg of the growing medium, and the water
required for the pots was found to be 2,052 mL at 80% field capacity, 1,026 mL at 40%
field capacity, and 513 mL at 20% field capacity. Osmocote fertilizer (28% N, 1.8% P,
and 14% K and micronutrients) was applied at the rate of 1g/plant (Table A 2.1). Each
pot was filled with 2.2 kg of soil medium. Plants were treated with 1 g/plant of
Osmocote fertilizer every second week from one week after planting for the next 3
months. At the stage of tuber bulking development (3 months after planting), potassium
was applied every two weeks as potassium sulphate at a rate of 1 g/plant.
The pots were initially watered to 80% of field capacity for all of the treatments prior to
planting. Water was subsequently withheld in the 40% and 20% of field capacity
treatments until the soil moisture reached the target field capacity that was determined
by weighing the pots regularly. The water contents of the growing media of the
Wanmun and Lole cultivars reached 40% of field capacity at 3 and 4 weeks after
planting, respectively, and 20% of field capacity at 4 and 5 weeks after planting,
75

respectively. The locations of the pots on the shadehouse benches were re-randomised
every week, thus each pot had the same chance to occupy each experimental location.
3.3 EXPERIMENTAL VARIABLES
The detailed methods used to measure plant growth variables are presented in Appendix
A1, section 3. Observations were made of the following variables:
• Plant growth and tuber yields
Plant height, leaf number and leaf area, above ground biomass, and root mass per plant
were recorded monthly by destructive sampling a subset of three pots at monthly
intervals from 1 to 5 months after planting (Section 3.2.3). Tuber yields were recorded
from 1 to 6 months after planting (Section 3.2.3).
• Water relations
Transpiration was recorded as weight losses from the pots (Appendix A1. 3.4) from two
weeks after planting until one week before harvesting. Leaf water potential was
recorded at 2 and 3 months after planting using a thermocouple psychrometer at three
times a day (6.00 am, 12.00 - 2.00 pm, and 6.00 pm) with 3 replications (Appendix A1.
3.4). Leaf relative water content was recorded at 2 and 3 months after planting on 5
replications for each plant (Appendix A1. 3.4).
• Pigment contents
Photosynthetic pigments (Appendix A1. 3.2) were determined at 2 and 3 months after
planting on 9 replicates per plant using the method described by Wintermans and De
Mots (1965).
76

• Anatomy
Stem and leaf samples for anatomical study were collected at 2 months after planting
(Appendix A1. 3.2).
• Starch and sucrose concentrations
Starch and soluble sugar concentrations of tubers were determined by The Analytical
Laboratory, School of Land and Food Sciences University of Queensland (Appendix
A1. 3.5).
3.4 STATISTICAL ANALYSES
Analyses of variance based on the factorial experiment with a complete randomised
design were conducted for all of the plant growth characters measured. Assessment of
the significance of treatments or of combinations of main effects was based on the
Duncan Multiple Range Test at the 95% probability level.
3.5 RESULTS AND DISCUSSIONS
3.5.1 Weather conditions
The experiment was conducted from 2 August to 29 December 2001. Daily minimum
and maximum air temperatures, rainfall, and relative humidity data were obtained from
the Commonwealth of Australia, Bureau of Meteorology, Queensland (Fig. 3.2).
77

0
5
10
15
20
25
30
35
40
1 2 3 4 1 2 3 4 1 2 3 4 1 2 3 4 1 2 3 4
August September October November December
Month and week
Tem
pera
ture
(C)
Maximun Minimum
Figure 3.2 Weekly mean maximum and minimum air temperatures (oC) at Townsville Airport, from 1 August to 31 December 2001. Source: Bureau of Meteorology, Queensland.
0
10
20
30
40
50
60
70
80
1 2 3 4 1 2 3 4 1 2 3 4 1 2 3 4 1 2 3 4
August September October November DecemberMonth and week
Rel
ativ
e H
umid
ity (%
)
09.00 AM 15.00PM
Figure 3.3 Relative humidities at 9.00 am and 3.00 pm at Townsville Airport, from 1 August to 31 December 2001. Source: Bureau of Meteorology, Queensland.
Weekly maximum and minimum air temperatures increased from the first week of
August (26.6 and 14.2 oC, respectively) at the start of the experiment to the end of
78

December 2001 (34.6 and 27.1oC, respectively; Fig. 3.2). Mean relative humidity
varied from 35% to 67.3% throughout the experiment (Fig. 3.3).
3.5.2 Plant growth characters
Effects of the experimental factors (water levels and cultivars) on the various plant
growth parameters are summarized in Table 3.1, and on the water relation parameters in
Table 3.9. Other physiological variables including the contents of leaf pigments, tuber
starch, and tuber sucrose are summarized in Table 3.11.
Table 3.1 shows that water stress had a significant impact on the growth responses of
the Lole and Wanmun cultivars. The effect of interactions between soil water contents
and sweet potato cultivars was significant for most of the growth parameters, suggesting
that the responses of the cultivars to water stress were different.
Table 3.1 Effects of soil water contents and their interactions on the growth of the Lole and Wanmun cultivars at the indicated number of months after planting.
Plant parameter Soil water content Cultivar Interaction
Month after planting 1 2 3 4 5 1 2 3 4 5 1 2 3 4 5
Main stem length * * * * * * * * * * * * * * *
Branch number * * * * * * * * * * * * * * *
Fresh shoot biomass * * * * * * * * * ns * * * * *
Dry shoot biomass * * * * * * * * * * * ns * * *
Fresh leaf mass * * * * * * * * * * * * * ns *
Dry leaf mass * * * * * * * ns * * * * ns * *
Leaf area * * * * * * * * * * * * * * *
Leaf senescence - - - - * - - - - * - - - - *
Fresh root mass * * * * * * * * * * * * * * *
Dry root mass * * * * * * * * ns * * * * ns *
ns (no significant effect) * the main effect or interaction was significant (p < 0.05) 1, 2, 3, 4, 5 = months after planting - = no data collected at this stage
79

3.5.2.1 Main stem length
The responses of the stem length of the Lole and Wanmun cultivars to the different soil
water regimes was significant in all the growth stages. Interaction effects between soil
water levels and cultivars were also significant (Table 3.1).
The Wanmun cultivar produced stems 3 times longer than those of the cv Lole stems
under well-watered conditions, and in the early growth stages (Table 3.2). When grown
under the lower soil water contents, the lengths of the cv Wanmun stems were about
twice as long as those of cv Lole (Table 3.2).
Table 3.2 Effects of soil water contents (20, 40, and 80% of soil field capacity) on the length of the main stem of the sweet potato cultivars Lole and Wanmun from 1 to 5 months. Number of replicates for each treatment = 4.
Main stem length (cm/plant) after the indicated number of months since planting
1 2 3 4 5
Soil water content (fraction of field capacity)
20 % 45.1c 49.4c 57.6c 57.5c 47.0c 40 % 55.6b 83.5b 89.8b 89.1b 84.0b 80 % 78.7a 105.6a 114.1a 110.5a 106.0a
Cultivars Lole 20.1e 34.7e 42.4e 41.6e 39.3e Wanmun 99.5d 124.3d 131.9d 129.7d 118.7d
Interactions Lole x 20% 17.8 20.6 30.7 29.0 28.5 Lole x 40% 20.3 38.8 40.8 40.6 38.5 Lole x 80% 22.3 44.8 55.8 55.5 51.0 Wanmun x 20% 72.5 78.3 84.5 85.5 65.5 Wanmun x 40% 91.0 128.3 138.8 138.0 129.5 Wanmun x 80% 135.1 166.5 172.5 165.5 161.0
Values within a column followed by the same letter symbol are not significantly different (p < 0.05). All the interactions are significant (p < 0.05).
80
Stem length in both cultivars increased greatly from 1 to 3 months after planting, but
was affected by water stress. In cv Lole, it was reduced by 9.0% and 20.2% from that of
the well-watered plants when subjected to water regimes of 40% and 20% soil field
capacity at 1 month after planting. In cv Wanmun, the stem length diminished by 32.6%
and 46.3% under 40% and 20% soil water regimes, respectively. At the stage of tuber
initiation and bulking, which started between 1 and 2 months after planting, stem length
reduction was around 50% in both cultivars grown at 20% soil field capacity, and
between 13% and 23% in the Lole and Wanmun cultivars, respectively, when grown
under 40% of the soil field capacity.
3.5.2.2 Number of branches
The number of branches per plant slightly increased from 1 to 2 months after planting in
both cultivars (Fig. 3.4), then increased greatly between 2 and 3 months after planting in
cv Lole, with a much less dramatic increase in cv Wanmun; and then remained
relatively constant until maturity (Fig. 3.4 and Tables A3: 6-10). However, the number
of branches produced under water stress was severely diminished (Fig. 3.4). The
production of fewer branches as both sweet potato cultivars approached maturity was
attributed to the withering process due to aging and senescence. According to Ravi and
Indira (1999), the branching system in sweet potato is influenced by environmental
factors such as soil moisture, and the number of branches was found to have increased
when irrigation was applied (Ravi and Indira, 1999). Nair and Nair (1995) found that
severe competition for light and senescence also reduced the number of branches of
mature sweet potato plants.
81
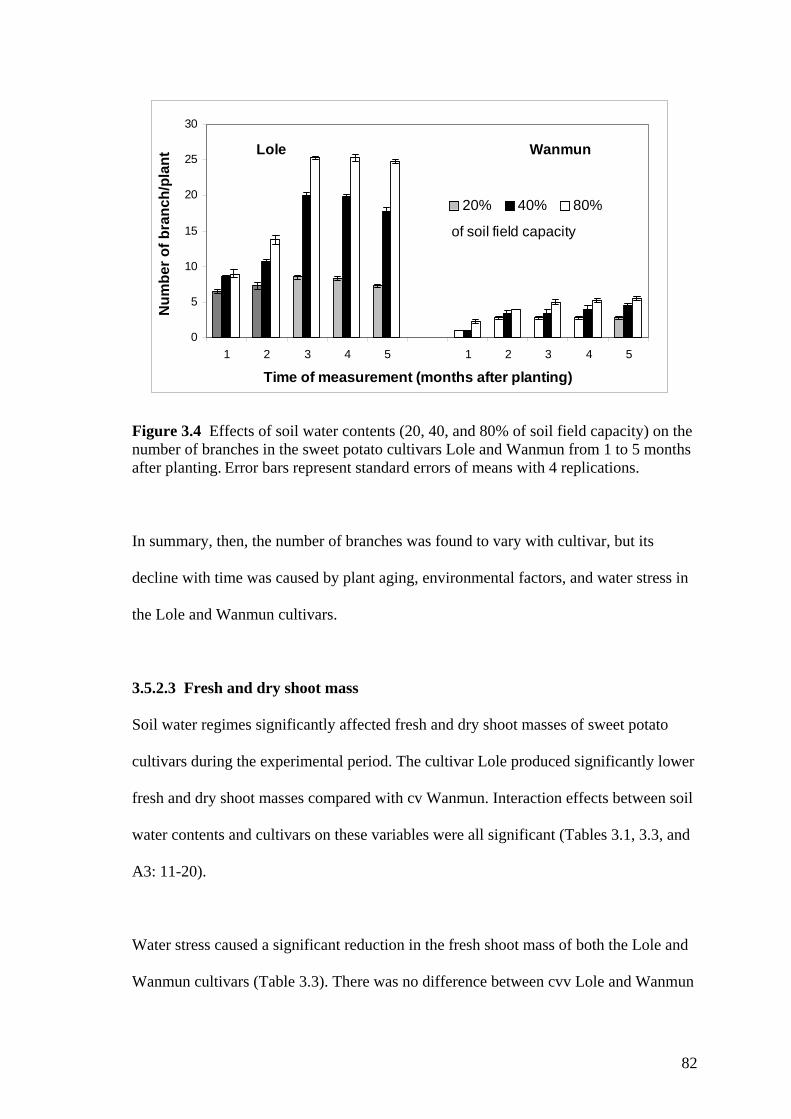
Lole Wanmun
0
5
10
15
20
25
30
1 2 3 4 5 1 2 3 4 5
Time of measurement (months after planting)
Num
ber o
f bra
nch/
plan
t
20% 40% 80%
of soil field capacity
Figure 3.4 Effects of soil water contents (20, 40, and 80% of soil field capacity) on the number of branches in the sweet potato cultivars Lole and Wanmun from 1 to 5 months after planting. Error bars represent standard errors of means with 4 replications.
In summary, then, the number of branches was found to vary with cultivar, but its
decline with time was caused by plant aging, environmental factors, and water stress in
the Lole and Wanmun cultivars.
3.5.2.3 Fresh and dry shoot mass
Soil water regimes significantly affected fresh and dry shoot masses of sweet potato
cultivars during the experimental period. The cultivar Lole produced significantly lower
fresh and dry shoot masses compared with cv Wanmun. Interaction effects between soil
water contents and cultivars on these variables were all significant (Tables 3.1, 3.3, and
A3: 11-20).
Water stress caused a significant reduction in the fresh shoot mass of both the Lole and
Wanmun cultivars (Table 3.3). There was no difference between cvv Lole and Wanmun
82

grown under 20% and 40% of soil field capacity at one month after planting, and at this
growth stage, the fresh shoot mass of cv Lole grown under both 20% and 40% of soil
field capacity decreased by 34% from that of the control (Table 3.3). It shows that at
the initial vegetative stage, both of the cultivars were slightly affected by withholding
water. On the other hand, cv Lole plants grown under 80% of soil field capacity grew
much faster after 1 month than those grown under 20% and 40% of soil field capacity
(Table 3.3). Between 2 and 5 months after planting, the fresh biomass reduction in the
plants grown under the 20% of soil field capacity was twice the reduction in the
corresponding plants grown under 40% of soil field capacity (Table 3.3).
Table 3.3 Effects of soil water contents (20, 40, and 80% of soil field capacity) on the fresh shoot masses of two sweet potato cultivars (Lole and Wanmun) from 1 to 5 months after planting. Number of replicates for each treatment = 4.
Fresh shoot biomass (g/plant) after the indicated number of months since planting
1 2 3 4 5
Soil water content (% of field capacity)
20 % 52.6c 102.1c 119.4c 93.7c 74.4c 40 % 70.5b 228.2b 210.4b 176.2b 147.8b 80 % 134.8a 367.8a 335.5a 274.1a 226.6a
Cultivars Lole 48.5e 195.0e 178.0e 161.2e 136.3e Wanmun 123.5d 270.4d 265.4d 201.6d 162.9d
Interactions Lole x 20% 41.2 67.6 91.0 70.1 50.5 Lole x 40% 41.3 200.4 173.7 167.0 142.9 Lole x 80% 63.0 317.0 269.4 246.4 215.7 Wanmun x 20% 64.1 136.5 147.8 117.4 98.3 Wanmun x 40% 99.8 256.0 247.0 185.5 152.8 Wanmun x 80% 206.7 418.6 401.5 301.8 237.5
Values within a column followed by the same letter symbol are not significantly different (p < 0.05). All the interactions are significant (p < 0.05).
83

The growth of Lole and Wanmun cultivars was severely affected when grown under
20% of the soil field capacity, with their fresh masses reduced by approximately 70%
and 60%, respectively, at maturity. This was attributed to the increasing senescence
leaves during the tuber bulking growth stage.
Dry shoot masses of sweet potato grown under low soil water regimes were lower than
those produced under the corresponding non-limiting water conditions (Table 3.3). The
reduction of dry plant mass under water stress corresponded to the reduction of fresh
mass. Dry shoot mass was significantly lower in the stressed plants than in the control
plants throughout the growing stages (Table 3.3).
The dry shoot mass of the sweet potatoes increased with time and reached a maximum
at 2 months after planting for the plants grown under 40% and 80% of field capacity,
and at 3 months after planting for those under 20% of field capacity (Table 3.4).
Mukhopadhyay et al. (1999) also observed that dry matter accumulation started to
gradually increase and attained a maximum at 2 months after planting.
84

Table 3.4 Effects of soil water contents (20, 40, and 80% soil field capacity) on the dry shoot mass of two sweet potato cultivars (Lole and Wanmun) from 1 to 5 months after planting. Number of replicates for each treatment = 4.
Dry shoot mass (g/plant) after the indicated number of months since planting
1 2 3 4 5
Soil water content (% of field capacity)
20 % 6.5b 11.7c 14.3c 13.0c 7.6c 40 % 7.0b 24.8b 28.0b 21.8b 22.1b 80 % 12.8a 43.3a 48.0a 38.0a 39.8a
Cultivars Lole 5.3e 23.8e 27.9e 22.7e 25.1d Wanmun 12.2d 29.5d 32.4d 25.9d 21.3e
Interactions Lole x 20% 4.6 7.6 11.8 11.1 2.3 Lole x 40% 4.6 22.8 27.6 21.7 24.9 Lole x 80% 6.7 41.0 44.2 35.4 48.0 Wanmun x 20% 8.4 15.8 16.9 15.0 12.8 Wanmun x 40% 9.3 26.9 28.4 22.0 19.4 Wanmun x 80% 18.8 45.7 51.7 40.6 31.6
Values within a column followed by the same letter symbol are not significantly different (p < 0.05). All the interactions are significant (p < 0.05).
Overall, cv Wanmun produced a large dry shoot mass except for the final growth stage
when its dry shoot mass was noticeably lower than that of cv Lole (Table 3.4). This was
slightly different from the fresh weight results where the fresh shoot weight of cv
Wanmun was greater than that of cv Lole (Table 3.4). The difference is attributed to the
fact that the mass of fresh shoot was influenced by differences in specific leaf area and
fluctuations in the environmental factors such as relative humidity. In general, sweet
potato grew rapidly when the plants were in the vegetative growth stage between
transplanting and 2 months old; growth declined steadily as the plants entered the
maturity stage.
85

3.5.2.4 Fresh and dry masses of leaves
Fresh and dry leaf masses were significantly affected by the soil water regime and by
cultivar (Table 3.1). Interaction effects between cultivars and soil water regimes were
statistically significant. However, leaf dry mass and its interactions at 3 months were
not statistically significant (Tables 3.1 and A3: 21-30).
Water stress significantly depressed the fresh and dry masses of leaves by
approximately 30% - 65% in the Lole and Wanmun cultivars respectively, when grown
under both 20% and 40% of soil field capacity (Table 3.5 and 3.6). As the plants
approached maturity, leaf fresh mass further declined, more so in the water stressed
plants, particularly from 3 months after planting (Tables 3.5 and 3.6).
Table 3.5 Effects of soil water contents (20, 40, and 80% of soil field capacity) on the fresh leaf mass of two sweet potato cultivars (Lole and Wanmun) from 1 to 5 months after planting. Number of replicates for each treatment = 4.
Fresh leaf mass (g/plant) after the indicated number of months since planting
1 2 3 4 5
Water contents (% of field capacity)
20 % 28.8c 53.9c 52.9c 34.1c 23.7c 40 % 37.5b 104.9b 76.0b 62.4b 39.5b 80 % 65.6a 153.3a 107.8a 96.5a 71.5a
Cultivars Lole 29.2e 96.9e 69.0e 56.2e 40.3e Wanmun 58.7d 111.2d 88.7d 72.5d 49.5d
Interactions Lole x 20% 25.3 41.7 46.2 27.5 22.7 Lole x 40% 24.8 100.3 66.3 53.5 33.8 Lole x 80% 37.7 148.6 94.6 87.6 64.4 Wanmun x 20% 32.3 66.1 59.6 40.7 24.8 Wanmun x 40% 50.3 109.5 85.7 71.4 45.2 Wanmun x 80% 93.6 158.0 121.0 105.5 78.6
Values within a column followed by the same letter symbol are not significantly different (p < 0.05). All the interactions are significant (p < 0.05).
86

Table 3.6 Effects of soil water contents (20, 40, and 80% of soil field capacity) on the dry leaf mass of two sweet potato cultivars (Lole and Wanmun) from 1 month to 5 months after planting. Number of replicates for each treatment = 4.
Dry leaf mass (g/plant) after the indicated number of months since planting
1 2 3 4 5
Water contents (% of soil field capacity)
20 % 4.0b 6.6c 7.0c 3.3c 3.0c 40 % 4.0b 11.5b 11.0b 6.9b 5.2b 80 % 7.1a 16.2a 17.2a 14.0a 14.0a
Cultivars Lole 3.6e 10.3e 11.6d 7.5e 6.9e Wanmun 6.5d 12.6d 11.9d 8.6d 7.9d
Interactions Lole x 20% 3.1 4.9 6.9 2.8 2.3 Lole x 40% 3.0 10.9 10.7 6.0 4.9 Lole x 80% 4.8 15.0 17.2 13.7 13.4 Wanmun x 20% 4.9 8.3 7.2 3.7 3.7 Wanmun x 40% 5.1 12.0 11.3 7.8 5.5 Wanmun x 80% 9.3 17.4 17.2 14.4 14.6
Values within a column followed by the same letter symbol are not significantly different (p < 0.05). All the interactions are significant (p < 0.05).
Approaching maturity, the leaf mass further declined, concomitant with increased leaf
senescence (Fig. 3.6), suggesting that dry matter was transferred from the leaves to the
storage roots (Nair and Nair 1995). Bhagsari (1990) found that the rate of canopy
photosynthesis in sweet potato declined to 50% at the end of the growth period; at this
growth stage, the proportion of older leaves in the canopy increases and the
photosynthetic rate of individual leave decreases due to the maximum growth rates of
the storage roots. Bhagsari (1990) also reported a decline in the dry mass of sweet
potato leaves with age from 25 mg dm-2h-1 in 20 day-old leaves to about 5 mg dm-2h-1 at
40 days and a further slight decrease at 60 days.
87

3.5.2.5 Leaf area
Decreasing the soil water regimes to 40% and 20% of the field capacity significantly
reduced leaf production compared to growth under well watered conditions (Fig. 3.5
and Tables A3: 31-36). Leaf area increased rapidly from 1 month to 2 months after
planting, before it slightly declined at 3 months after planting, and then decreased
significantly during plant maturation.
Leaf area reduction under water stress has also been reported in many other crop
species. For example, leaf area expansion of cassava was markedly reduced by water
stress (Connor and Cock, 1981). The inhibition of leaf area growth of cassava found by
Alves and Setter (2000) under stress water conditions was attributed to inhibition of
both cell expansion and cell division.
Leaf areas of the Lole and Wanmun cultivars were found to increase with the age of the
plants and decreased steadily after 3 months (Fig. 3.5). This suggests that leaves as a
source of photosynthetic capacity declined with age, and according to Brown (1992) the
decline of leaf expansion in sweet potato is likely to be influenced by development of
sinks (storage roots) and environmental factors. The young leaves function as a sink and
have to compete with the storage roots for carbon when they start developing. The
leaves utilise carbon to support their expansion, then the leaf area declines as the aging
leaves undergo senescence, which is characterised by a loss of chlorophyll and
photosynthetic enzymes (Hopkins, 1999).
88

Lole Wanmun
0
1000
2000
3000
4000
5000
6000
7000
8000
1 2 3 4 5 1 2 3 4 5
Time of measurement (months after planting)
Leaf
are
a (c
m2/p
lant
)20% 40% 80%
of soil field capacity
Figure 3.5 Effects of soil water contents (20, 40, and 80% of soil field capacity) on leaf area of two sweet potato cultivars (Lole and Wanmun) from 1 to 5 months after planting. Error bars represent standard errors of means with 4 replications. Crock et al. (1979) and Irikura et al. (1979 in Connor and Cock, 1981) reported that the
sizes of fully expanded cassava leaves declined following the attainment of maximum
leaf size at about 4 months after planting. In the present trial, the sweet potato plants
produced their maximum leaf area, under all soil water contents at 3 months after
planting, before declining as the plants matured, probably because sweet potato has a
shorter growing period than cassava. However, Mukhopadhyay et al. (1999) observed
that the leaf area of sweet potato increased to a maximum gradually from 1 to 4 months
after planting then decreased due to leaf senescence. Despite the time difference in the
attainment of maximum leaf area (due to different growth environments and cultivars),
the present crop showed a similar trend of leaf area expansion and reduction due to leaf
senescence toward maturity.
89

Reduced leaf expansion might benefit plants under conditions of water stress because it
leads to a smaller leaf area and reduced transpiration (Hopkins, 1999). However, the
consequence of limited water supply is reduced growth (Hopkins, 1999). The
occurrence of water deficits in young growing plants would also be expected to cause a
reduction in cell turgor which would slow leaf expansion and growth (Hopkins, 1999).
3.5.2.6 Leaf senescence
Differences in the amount of leaf senescence (Appendix A1 3.1) were statistically
significant under the different soil water regimes, and cv Lole lost significantly more its
leaves than did cv Wanmun (Fig. 3.6; Tables 3.1 and A3: 37).
0
2
4
6
8
10
12
14
16
20 40 80
Soil field capacity (%)
Leaf
sen
esce
nce
(g/p
lant
)
Lole Wanmun
Figure 3.6 Effects of soil water contents (20, 40, and 80% of soil field capacity) on the total leaf senescence of two sweet potato cultivars (Lole and Wanmun) from 1 month to 5 months after planting. Error bars represent standard errors of means with 4 replications. Compared to cv Wanmun, which lost only 1.57 g leaf dry mass/plant, cv Lole lost about
6.58 g/plant during the entire growing period under 20% of the soil field capacity (Fig.
3.6). At 80% of field capacity, leaf drop in cv Lole accounted for 13.8 g dry mass/plant,
90

which was 4 times more than that of cv Wanmun (3.6 g/plant; Fig. 3.6). This is related
to the physiological mechanisms by which the plants limit excessive leaf production to
promote tuber development. On the other hand, Leopold (1964) suggested that
senescence might offer adaptability to the environmental limitations such as water
stress, as it allows the conservation and re-utilization of nutrients from these organs.
In the present trial, leaf senescence was higher under the higher soil water content than
at the corresponding lower water levels (Fig. 3.6). This is likely to be a consequence of
higher biomass production and leaf turnover under higher available soil water.
Compared to cv Lole, cv Wanmun was likely to maintain its expanded leaves during
growth, as was shown by its resistance to dropping leaves. This may be due to different
photosynthetic capacities between the different leaves types of both cultivars as found
by Hopkins (1999). Senescing leaves may lose as much as 50% of their dry weight, in
the form of soluble organic nitrogen compounds that may be exported to developing
leaves and other sinks, including tubers (Hopkins, 1999).
Leaf area reduction is an effective mechanism for reducing transpiration during times of
limited water availability (Hopkins, 1999). Many plants, subjected to prolonged water
stress will respond by accelerated senescence and abscission of the older leaves
(Hopkins, 1999). However, to conclude that leaf senescence was the only physiological
mechanism to reduce the water consumption by the Lole cultivar needs deeper study.
91
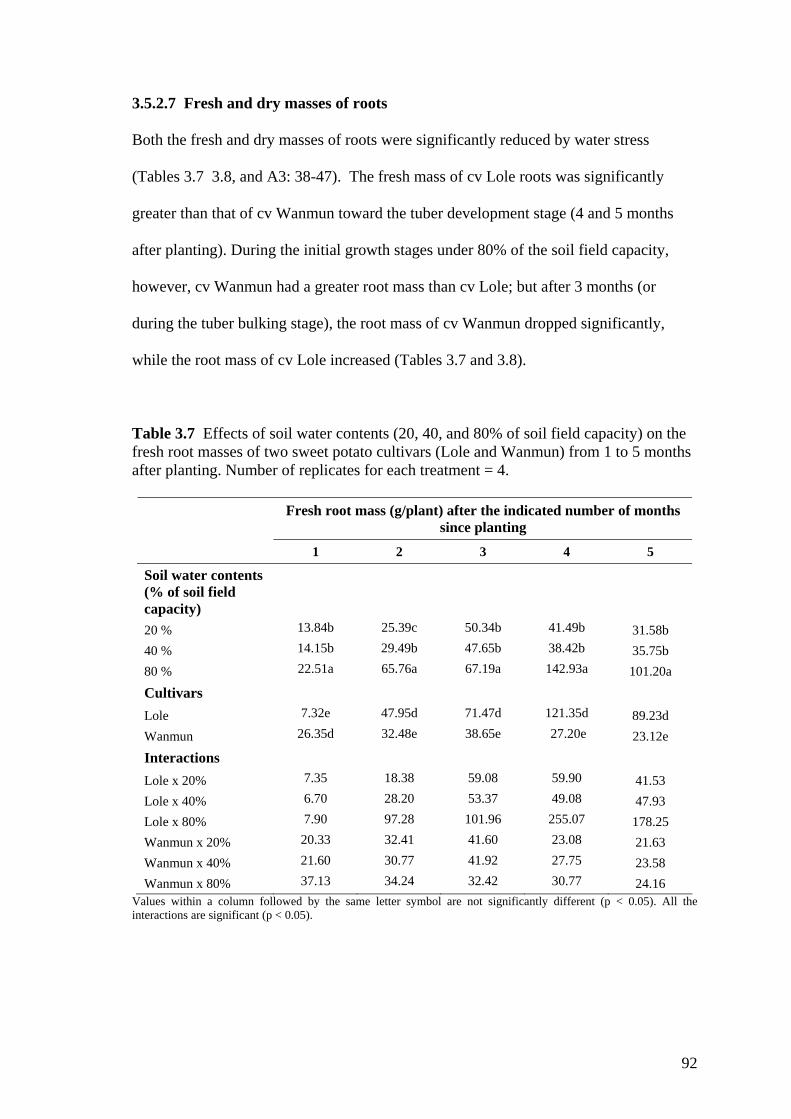
3.5.2.7 Fresh and dry masses of roots
Both the fresh and dry masses of roots were significantly reduced by water stress
(Tables 3.7 3.8, and A3: 38-47). The fresh mass of cv Lole roots was significantly
greater than that of cv Wanmun toward the tuber development stage (4 and 5 months
after planting). During the initial growth stages under 80% of the soil field capacity,
however, cv Wanmun had a greater root mass than cv Lole; but after 3 months (or
during the tuber bulking stage), the root mass of cv Wanmun dropped significantly,
while the root mass of cv Lole increased (Tables 3.7 and 3.8).
Table 3.7 Effects of soil water contents (20, 40, and 80% of soil field capacity) on the fresh root masses of two sweet potato cultivars (Lole and Wanmun) from 1 to 5 months after planting. Number of replicates for each treatment = 4.
Fresh root mass (g/plant) after the indicated number of months since planting
1 2 3 4 5
Soil water contents (% of soil field capacity)
20 % 13.84b 25.39c 50.34b 41.49b 31.58b 40 % 14.15b 29.49b 47.65b 38.42b 35.75b 80 % 22.51a 65.76a 67.19a 142.93a 101.20a
Cultivars Lole 7.32e 47.95d 71.47d 121.35d 89.23d Wanmun 26.35d 32.48e 38.65e 27.20e 23.12e
Interactions Lole x 20% 7.35 18.38 59.08 59.90 41.53 Lole x 40% 6.70 28.20 53.37 49.08 47.93 Lole x 80% 7.90 97.28 101.96 255.07 178.25 Wanmun x 20% 20.33 32.41 41.60 23.08 21.63 Wanmun x 40% 21.60 30.77 41.92 27.75 23.58 Wanmun x 80% 37.13 34.24 32.42 30.77 24.16
Values within a column followed by the same letter symbol are not significantly different (p < 0.05). All the interactions are significant (p < 0.05).
92

The fresh and dry masses of roots of cv Lole grown under well-watered conditions was
3 times greater than those of the same cultivar grown under the lower soil water regimes
(Tables 3.7 and 3.8). The root masses of cv Wanmun reached a maximum at one
month after planting before declining with the development of tubers.
The root masses of cv Lole grown under 80% of the soil field capacity diminished after
4 months. As the fibrous roots of the Lole cultivar were longer than those of cv
Wanmun (Tables 3.7 and 3.8), it grew more deeply into the soil layers in comparison to
the roots of cv Wanmun, which were considerably shallower and declined in mass early
in the tuber development stage. This indicates that cv Lole has an ability to push its root
system into deeper soil layers which provides a useful mechanism for drought
avoidance by using deep reservoirs of soil moisture.
93

Table 3.8 Effects of soil water contents (20, 40, and 80% of soil field capacity) on the dry root masses of two sweet potato cultivars (Lole and Wanmun) from 1 to 5 months after planting. Number of replicates for each treatment = 4.
Dry root mass (g/plant) after the indicated number of months since planting
1 2 3 4 5
Soil water content (% of soil field capacity)
20 % 3.40b 5.75c 5.63c 5.95c 3.81c 40 % 3.45b 7.66b 10.02b 6.98b 6.61b 80 % 4.88a 13.58a 13.34a 17.08a 11.65a
Cultivars Lole 2.48e 7.68e 12.14d 14.31d 9.49d Wanmun 5.33d 10.32d 7.18e 5.70e 5.23e
Interactions Lole x 20% 2.46 4.13 5.20 6.00 3.10 Lole x 40% 2.45 7.23 12.50 8.54 7.68 Lole x 80% 2.54 11.68 18.72 28.40 17.71 Wanmun x 20% 4.33 7.38 6.05 5.90 4.53 Wanmun x 40% 4.46 8.10 7.53 5.43 5.55 Wanmun x 80% 7.21 15.48 7.95 5.78 5.60
Values within a column followed by the same letter symbol are not significantly different (p < 0.05). All the interactions are significant (p < 0.05).
Overall, water stress retarded the growth and development of both sweet potato
cultivars, compared with those grown under well-watered conditions by reducing stem
length and branch number, leaf area and weight, and root weight.
3.5.3 Water relations
The plant water status was mostly affected by soil water regimes and varied between
Lole and Wanmun cultivars (Table 3.9). The only plant growth parameters that were
not significantly different between the two cultivars were leaf water potential and
relative leaf water content recorded at dawn at 2 months after planting (Table 3.9). No
interaction effects were observed in these parameters (Table 3.9).
94

Table 3.9 Summary of the effects of soil water contents (20, 40, and 80% of soil field capacity) on two sweet potato cultivars (Lole and Wanmun) and their interaction effects on plant water relation parameters.
Plant parameters Soil water contents Cultivar Interaction
• Transpiration 1 month after planting * * * 2 months after planting * * * 3 months after planting * * * 4 months after planting * * * 5 months after planting * * * • Leaf water potential
2 months after planting 06.00 am ns ns ns 12.00 - 2.00 pm * * * 6.00 pm * * *
3 months after planting 6.00 am * * ns 12.00 - 2.00 pm * * * 6.00 pm * * * • Relative leaf water
content
2 months after planting 6.00 am * ns ns 12.00 - 2.00 pm * ns ns 6.00 pm * ns ns
3 months after planting 6.00 am * * ns 12.00 – 2.00 pm * * ns 6.00 pm * * ns
ns (no significant effect); * the main effect or interaction was significant (p < 0.05)
3.5.3.1 Transpiration
The daily mean transpiration rates of the Lole and Wanmun cultivars were determined
from 1 month to 5 months (Table 3.10), and Lole showed significantly less transpiration
than Wanmun under all soil water regimes (Table 3.10). The water stressed plants
transpired less water compared to the well watered plants of both cultivars (Table 3.10).
95

The interaction effects between soil water regimes and cultivars were also significant
(Tables 3.9, 3.10, and A3: 48-52).
Table 3.10 Effects of soil water contents (20, 40, and 80% of soil field capacity) on the daily transpiration rate (g of water/day) of Lole and Wanmun cultivars.
Lole Wanmun (g of water/day) (g of water/day) 1 month after planting 20% of soil FC 130.25b B 160.38c A 40% of soil FC 130.13b B 180.00b A 80% of soil FC 210.35a B 305.35a A 2 months after planting 20% of soil FC 167.50c B 263.89c A 40% of soil FC 330.53b B 450.01b A 80% of soil FC 630.17a B 815.44a A 3 months after planting 20% of soil FC 255.65c B 337.89c A 40% of soil FC 487.96b B 566.94b A 80% of soil FC 882.47a B 1021.72a A 4 months after planting 20% of soil FC 308.09c B 335.81c A 40% of soil FC 534.07b B 569.14b A 80% of soil FC 921.82a B 1013.48a A 5 months after planting 20% of soil FC 251.24c B 316.98c A 40% of soil FC 416.19b B 525.16b A 80% of soil FC 725.96a B 895.49a A
Values within a column followed by the same lower case letter symbol, and upper case letter symbols within a row, are not significantly different (p < 0.05). All the interactions are significant (p < 0.05).
The mean daily transpiration rate sharply increased from 1 month to 3 months after
planting, especially in the well-watered plants (Table 3.10). While the rate was constant
after 3 months in Wanmun, it slightly increased until 4 months in Lole before it
declined slightly (Table 3.10).
96
The sharp increase in transpiration between 1 and 3 months after planting was attributed
to active vegetative growth and rapid tuber development. At this stage, a good water
supply was needed to cope with increase in transpiration (Brown, 1992).
3.5.3.2 Leaf water potential
Leaf water potential was affected by water stress, except in the predawn measurements
when the leaf water potential values of the Lole and Wanmun cultivars, recorded at 2
and 3 months after planting, were closely similar under all of the soil water contents
(Figs 3.7 and 3.8; Table 3.9). Apart from the predawn data, the interactions between soil
water levels and cultivars were also significant (Figs 3.7 and 3.8; Tables A3: 53-58 and
A3: 81). The significant interaction at 3 months after planting showed that the leaf
water potentials of the cultivars responded differently as a result of the different soil
water regimes.
There was a daily change in leaf water potentials of the Lole and Wanmun cultivars
grown under both well watered and water stressed conditions. Leaf water potential was
greatest in the morning, declined during the middle of the day, and recovered during the
late afternoon under all soil water contents. However, water stress was found to reduce
the diurnal range of the leaf water potential in both cultivars (Fig. 3.7). The decrease in
the leaf water potential at midday was greater in cv Wanmun than in cv Lole at both 2
and 3 months after planting (Figs 3.7 and 3.8). As a consequence of the efficiency of its
leaf transpiring area, cv Lole was better able to maintain its water relations at midday
than could cv Wanmun. The leaf water potential of the Lole cultivar also recovered
faster than that of cv Wanmun in the late afternoon which showed that due to its greater
97

plant water status, the Lole cultivar was able to regain its cell turgor faster than could cv
Wanmun.
Lole
-1.4
-1.2
-1
-0.8
-0.6
-0.4
-0.2
006.00 am noon 06.00pm
Time of measurement
Leaf
wat
er p
oten
tial (
MPa
)
20 40 80of soil field capacity (%)
2 months after planting
(a)
Wanmun
-1.4
-1.2
-1
-0.8
-0.6
-0.4
-0.2
006.00 am noon 06.00pm
Time of measurement
Leaf
wat
er p
oten
tial (
MPa
)
20 40 80
of soil field capacity (%)
2 months after planting
(b)
Figure 3.7 Leaf water potential of Lole and Wanmun cultivars, affected by three soil water contents (20, 40, and 80% of soil field capacity) at 2 months after planting. Error bars represent standard errors of means with 3 replications.
98

Lole
-1.4
-1.2
-1
-0.8
-0.6
-0.4
-0.2
006.00 am noon 06.00pm
Time of measurement
Leaf
wat
er p
oten
tial (
MPa
)
20 40 80
3 months after planting
of soil field capacity (%)
(a)
Wanmun
-1.4
-1.2
-1
-0.8
-0.6
-0.4
-0.2
006.00 am noon 06.00pm
Time of measurement
Leaf
wat
er p
oten
tial (
MPa
)
20 40 80
3 months after planting
of soil field capacity (%)
(b)
Figure 3.8 Leaf water potential of Lole and Wanmun cultivars, affected by three soil water contents (20, 40, and 80% of soil field capacity) at 3 months after planting. Error bars represent standard errors of means with 3 replications.
Similar results have been found in many crops including wheat and cassava. In wheat,
water stress reduced diurnal leaf water potential and leaf osmotic potential in both
drought tolerant and drought sensitive genotypes (Sen Gupta et al., 1989). Leaf water
potential also declined at midday in cassava (- 0.36 MPa) and sweet potato (- 0.96 MPa)
(Ghuman and Lal, 1983). Boyer (1982) also found that the diurnal change in leaf water
99

potential was possibly as the result of interactive effects of water supply and maximum
atmospheric water demand. Lambers et al. (1998) showed that, as the soil dries out,
there are parallel decreases in soil water potential and plant water potential, both
immediately before dawn (when the water stress is least) and at midday (when the water
stress is greatest). As transpiration rates at night are small or near zero, the water
potential inside the plant comes into equilibrium with the water potential of the soil in
the root zone. Therefore plant water potential values measured just before dawn will
provide the highest plant water potential (i.e., smallest negative value) during the day,
and therefore will provide a reasonable estimate of the soil water potential (Lambers et
al., 1998).
Leaf water potential decreased with increasing the stage of plant growth from 2 to 3
months after planting and at all measuring times throughout the day (Figs 3.7 and 3.8).
For instance, the predawn leaf water potential declined from –0.4 MPa at 2 months to
–0.7 MPa at 3 months after planting in both cultivars; and the leaf water potential of cv
Lole was higher than that of cv Wanmun (Figs 3.7 and 3.8).
At 3 months after planting, the predawn leaf water potential was significantly different
among soil water levels and cultivars (Fig. 3.7; Table 3.9). The values for cv Lole were
similar when grown under 20% and 40% of the soil field capacity (-0.48 M.Pa) at early
morning, and were only slightly different from those of plants grown under 80% of the
soil field capacity (-0.70 M.Pa).
In general as both cultivars grew, leaf water potential declined as the soil water
availability declined. The decline in leaf water potential is probably related to the
100

increasing growth and development of shoots and tubers, leading to increased crop
water requirements and consequently to further depletion of the soil water supply.
Transpiration was also depressed when the availability of soil water became limited
under water stressed conditions and as a result, photosynthesis decreased (Leopold,
1964). Under low leaf water potential, tuber growth rate was also lower, as it appeared
to be affected by leaf transpiration (Toshihiko et al., 1998).
3.5.3.3 Leaf relative water contents
Tables 3.9, A3: 59-64 and A: 82 show the significance of the effects of soil water stress
and cultivars on leaf relative water content. The cultivars alone had no significant effect
on the leaf relative water content at 2 months after planting, but they were significant
after 3 months (Table 3.9). At both growth stages, there were no interaction effects
between water stress and cultivars suggesting that the responses of the cultivars and to
water stress were similar (Table 3.9).
Both the Lole and Wanmun cultivars had lower relative leaf water contents in the plants
grown under the drier (20% field capacity) than the wetter soil moisture regimes (Fig.
3.9). Water stress caused a significant decrease in the leaf relative water contents in
both cultivars. Under 20% and 40% of the soil field capacity, the leaf relative water
content of cv Lole measured at 2 months after planting and at 6:00 am declined by 3.9%
and 1.4%, respectively, compared to that of the same cultivar grown at 80% soil field
capacity (Fig. 3.9). At the same time, however, the relative water content of Wanmun
declined by 0.9% and 3.8% when grown under 20% and 40% of soil field capacity,
respectively. At midday, the leaf relative water contents decreased further in each
cultivar, but they all recovered during the late afternoon, except for those grown under
101

the 20% soil field capacity after 3 months which did not recover much by 6.00 pm (Fig.
3.9).
Lole Wanmun
60
65
70
75
80
85
90
06.00 am 12.00 pm 06.00 pm 06.00 am 12.00 pm 06.00 pm
Time of measurement
Leaf
rela
tive
wat
er c
onte
nt
(%)
20% 40% 80%of soil field capacity
at 2 months after planting (a)
Lole Wanmun
65
70
75
80
85
90
06.00 am 12.00 pm 06.00 pm 06.00 am 12.00 pm 06.00 pm
Time of measurement
Leaf
rela
tive
wat
er c
onte
nt
(%)
20% 40% 80%
of soil field capacity
at 3 months after plating(b)
Figure 3.9 Leaf relative water contents of Lole and Wanmun cultivars, affected by three soil water contents (20, 40, and 80% of soil field capacity). Error bars represent standard errors of means with 4 replications.
The Lole cultivar had a significantly higher leaf relative water content than that of cv
Wanmun at 3 months after planting. The results suggest that the pattern of reduction in
plant water status of the Lole and Wanmun cultivars under water stress were similar in
102
leaf water potential (expressing the energetic status of water inside the leaf cells), and in
relative water content (expressing the relative amount of water in the plant tissue).
Relative water content was higher in the plants grown under 80% field capacity than in
those grown under the lower soil water regimes. It is possible that the finding of
Siddique et al. (2000), that plants with higher relative water content had higher
photosynthetic rates, may also apply to sweet potato.
3.5.4 Pigments, stomatal density, and tuber organic contents
Table 3.11 shows the significance of soil water regimes and cultivars on pigment
concentrations, stomatal densities, tuber yield and the organic composition of the tubers.
3.5.4.1 Pigment contents
Water stress produced lower pigment (chlorophyll and carotene) concentrations in both
sweet potato cultivars. There was a significant interaction between soil water and
cultivar on the chlorophyll concentration in sweet potatoes, and the main effects were
also significant (Tables 3.11 and A3: 65-68).
103

Table 3.11 Effects of soil water contents, cultivars, and their interactions on pigment concentrations, stomatal density, and tuber production.
Plant parameters Soil water content Cultivar Interaction
• Total chlorophyll
2 months after planting * * *
3 months after planting * * *
• Carotene
2 months after planting * * *
3 months after planting * * *
• Stomatal density
Adaxial leaf surface ns * ns
Abaxial leaf surface ns * ns
• Sucrose and starch in tubers
3 months
- Sucrose concentrations ns * ns
- Starch concentrations * * ns
6 months
- Sucrose concentrations ns * ns
- Starch concentrations * * ns
• Tuber yield 2 months * * *
3 months * * *
4 months * * *
5 months * * *
• Tuber number * * * ns (no significant effect); * the main effect or interaction was significant (p < 0.05)
Total chlorophyll and carotene concentrations of the youngest fully expanded sweet
potato leaves decreased with increasing growth stages (Figs 3.10 and 3.11). The Lole
cultivar had significantly greater chlorophyll and carotene concentrations than did cv
Wanmun, except for those grown under 80% of the soil field capacity at 2 months after
planting.
104
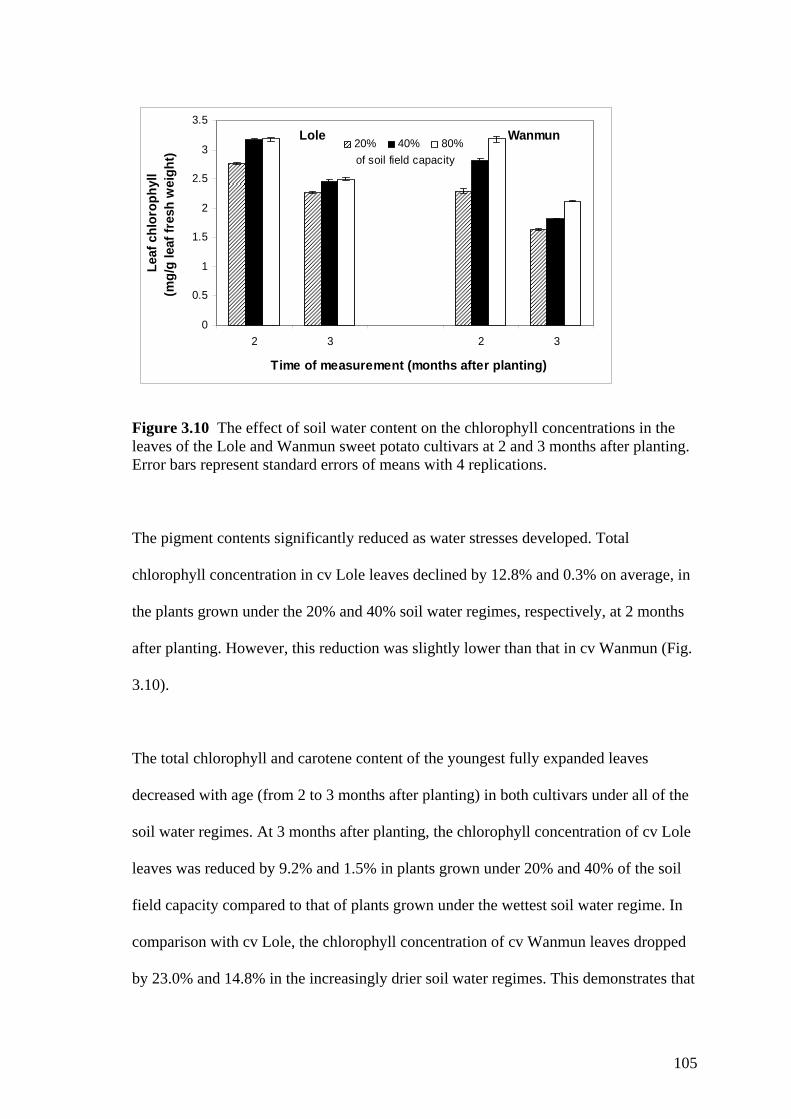
Lole Wanmun
0
0.5
1
1.5
2
2.5
3
3.5
2 3 2 3
Time of measurement (months after planting)
Leaf
chl
orop
hyll
(m
g/g
leaf
fres
h w
eigh
t)
20% 40% 80%of soil field capacity
Figure 3.10 The effect of soil water content on the chlorophyll concentrations in the leaves of the Lole and Wanmun sweet potato cultivars at 2 and 3 months after planting. Error bars represent standard errors of means with 4 replications.
The pigment contents significantly reduced as water stresses developed. Total
chlorophyll concentration in cv Lole leaves declined by 12.8% and 0.3% on average, in
the plants grown under the 20% and 40% soil water regimes, respectively, at 2 months
after planting. However, this reduction was slightly lower than that in cv Wanmun (Fig.
3.10).
The total chlorophyll and carotene content of the youngest fully expanded leaves
decreased with age (from 2 to 3 months after planting) in both cultivars under all of the
soil water regimes. At 3 months after planting, the chlorophyll concentration of cv Lole
leaves was reduced by 9.2% and 1.5% in plants grown under 20% and 40% of the soil
field capacity compared to that of plants grown under the wettest soil water regime. In
comparison with cv Lole, the chlorophyll concentration of cv Wanmun leaves dropped
by 23.0% and 14.8% in the increasingly drier soil water regimes. This demonstrates that
105

water stress had less effect on the chlorophyll concentration of cv Lole leaves than on
those of the Wanmun cultivar.
Lole Wanmun
0
0.1
0.2
0.3
0.4
0.5
0.6
0.7
2 3 2 3
Time of measurement (months after planting)
Leaf
car
oten
e (m
g/g
fres
h le
af w
eigh
t)
20% 40% 80%of soil field capacity
Figure 3.11 The effect of soil water content on the carotene concentration in the leaves of Lole and Wanmun sweet potato cultivars at 2 and 3 months after planting. Error bars represent standard errors of means with 4 replications.
The carotene concentration of sweet potato leaves also diminished under water stress
conditions. In plants grown under 80% of the soil field capacity, the carotene
concentration of cv Wanmun was much greater than that of cv Lole at 2 months after
planting, but this was reversed at 3 months after planting (Fig. 3.11). The Lole cultivar
sustained significantly higher carotene concentrations than did cv Wanmun under water
stress conditions at both observation times (Fig. 3.11). The cv Lole plants grown under
the 20% and 40% of soil water regimes showed a slight reduction in carotene content
compared with well watered plants. The carotene content of leaves of cv Wanmun, on
the other hand, declined as much as 30% in the plants grown under the drier soil
moisture conditions.
106

Leaf pigments have been widely reported to play an important role as a part of
photosynthetic processes in plants. Unsuitable environmental conditions may destroy
the photosynthetic pigments, leading to the inhibition of photosynthesis. In many crops,
including wheat, mungbean, and eggplants, the chlorophyll contents of leaves is known
to decline as a consequence of water stress (Ashraf et al., 1994; Kirnak et al., 2001;
Haider and Paul, 2003). A reduction in chlorophyll concentration had reduced the
photosynthesis in Solanum melongena (brinjal) (Prakash and Ramachandran, 2000).
Limited water supply induced rapid chlorophyll degradation in wheat tillers (Ashraf et
al., 1994). Parimelazhagan and Francis (1996) suggested that higher leaf chlorophyll
concentrations were associated with increased plant vigour and productivity in green
gram beans. But Shaw et al. (2002) found that there was no indication in sugar beet that
leaf chlorophyll measurements could be used as an indicator of genotype differences in
the tolerance of drought stress, and that chlorophyll fluorescence remains a more
effective method for measuring damage to the photosynthetic apparatus caused by
drought stress than the measurement of chlorophyll quantity.
In summary, the pigment contents of the Lole and Wanmun cultivar leaves were found
to have diminished with growth from 2 to 3 months after planting. This reduction may
be due to differences in season and/or physiological state (Sims and Gamon, 2003). It
was suggested by Sanger (1971) that chlorophyll contents of leaves usually decrease in
plants with maturity as a consequence of the addition of fibrous material and the
breakdown of chlorophyll in leaves.
The present study has shown that the chlorophyll concentration per unit of fresh leaf
mass diminished significantly as more severe water stresses were imposed on the sweet
107

potato cultivars (Table 3.11). The chlorophyll-deficient, water stressed sweet potatoes
were unable to meet their metabolic requirements and have ultimately disturbed the
physiological functioning of the whole plant. The leaves of cv Lole had greater pigment
contents than those of the less drought tolerant cv Wanmun. The pigment concentrations
also varied with cultivar: even under lower soil water regimes, cv Lole cultivar
produced greater leaf pigment concentrations than did cv Wanmun, which also suggests
its greater tolerance to water stress.
3.5.4.2 Leaf anatomy (stomatal density)
The Lole and Wanmun cultivars produced 21 and 27 stomata/mm2, respectively on their
adaxial (upper) surfaces when grown under all soil water contents at 2 months after
planting. These results were lower than the corresponding stomata number on the
abaxial (lower) surface where cv Lole had an average of 43 stomata/mm2, and Wanmun
had 73 stomata/mm2, again independent of the soil water regime.
An analysis of stomatal density in both the Lole and Wanmun cultivars is presented in
Tables 3.11 and A3: 69-70. There was no significant effect of water stress on the
stomatal density on the adaxial or abaxial leaf surfaces of either cultivar (Figs 3.12 and
3.13), suggesting that the stomatal density of the sweet potato cultivars was not
influenced by soil water stress conditions.
108
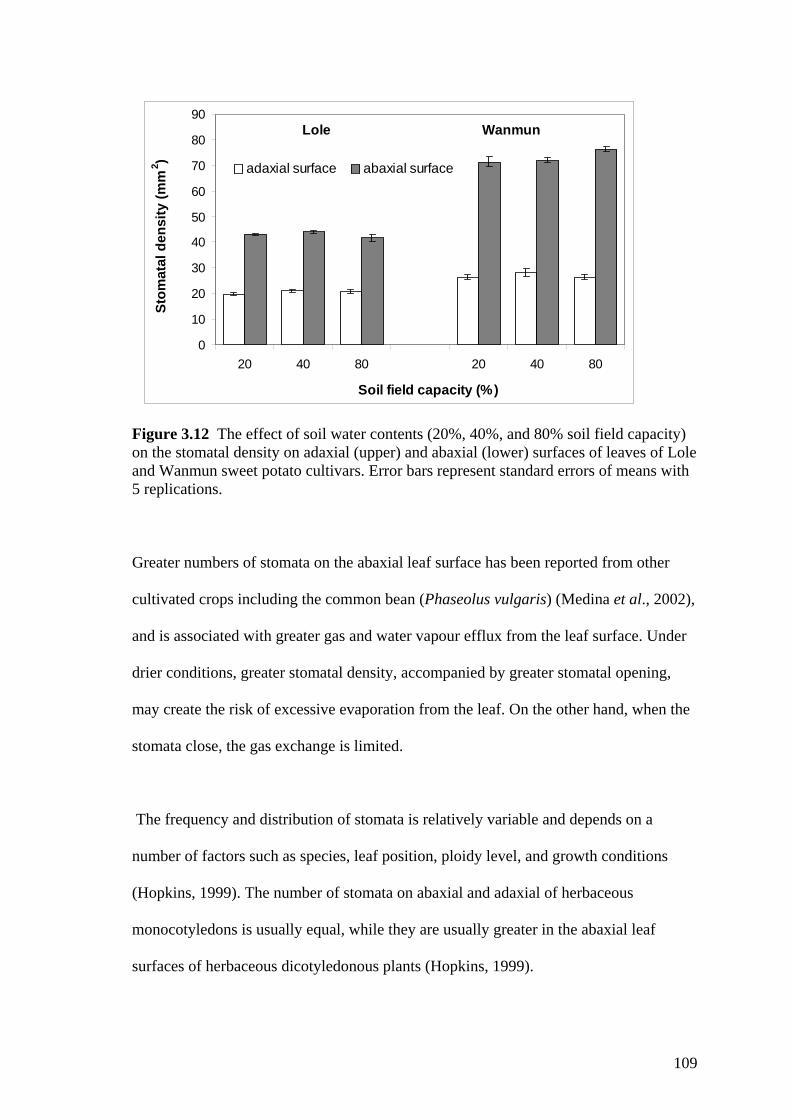
Lole Wanmun
0
10
20
30
40
50
60
70
80
90
20 40 80 20 40 80
Soil field capacity (%)
Stom
atal
den
sity
(mm
2 ) adaxial surface abaxial surface
Figure 3.12 The effect of soil water contents (20%, 40%, and 80% soil field capacity) on the stomatal density on adaxial (upper) and abaxial (lower) surfaces of leaves of Lole and Wanmun sweet potato cultivars. Error bars represent standard errors of means with 5 replications. Greater numbers of stomata on the abaxial leaf surface has been reported from other
cultivated crops including the common bean (Phaseolus vulgaris) (Medina et al., 2002),
and is associated with greater gas and water vapour efflux from the leaf surface. Under
drier conditions, greater stomatal density, accompanied by greater stomatal opening,
may create the risk of excessive evaporation from the leaf. On the other hand, when the
stomata close, the gas exchange is limited.
The frequency and distribution of stomata is relatively variable and depends on a
number of factors such as species, leaf position, ploidy level, and growth conditions
(Hopkins, 1999). The number of stomata on abaxial and adaxial of herbaceous
monocotyledons is usually equal, while they are usually greater in the abaxial leaf
surfaces of herbaceous dicotyledonous plants (Hopkins, 1999).
109

A D
E
B
FC
Figure 3.13 Stomata density of the Lole cultivar at 20X of magnification grown under 20% (A), 40% (B), and 80% (C) of soil field capacity, and of the Wanmun cultivar grown under the same conditions 20% (D), 40% (E), and 80% (F) of soil field capacity.
When plants are grown under water stress, their stomatal densities are known to be
higher in broad beans (Vicia faba), tomato (Lycopersicon esculentum cv INCA 9),
wheat (Triticum aestivum), and maize (Zea mays) (Xia, 1990; Sam et al., 2000; Hameed
et al., 2002; HaiQiu et al., 2003), and lower in certain grape (Vitis vinifera) cultivars
(Del Campo et al., 2003). Tomato plants with large stomata and high stomatal densities
are more prone to water stress (Hinckley, 1973), and lines with low stomatal density
were unresponsive to irrigation and in this sense were more tolerant of water stress,
110

their overall yields, however, were low (Buttery et al., 1993), as low stomatal density
limits the water losses, but also limits the influx of carbon dioxide for photosynthesis.
Drought resistant Indian sweet potato accessions 16, 22, 27, 28, 29 and 35 have also
been shown to have a low stomatal density (Indira, 1989).
Water stress did not affect stomatal density in either cultivar used in the present study,
and the cultivars varied in their responses to water stress conditions. The Wanmun
cultivar had significantly greater stomatal density than cv Lole which suggests that
fewer stomata in the latter provides a mechanism by which the transpiration of cv Lole
was lower, and more water use efficient, than that of cv Wanmun.
3.5.4.3 Tuber starch and sucrose concentrations
The concentration of starch and sucrose in the tubers of Lole and Wanmun at 3 months
after planting and at harvest (6 months after planting) are presented in Fig. 3.14, and
Tables 3.11 and A3: 71-74.
The results revealed that the concentration of sucrose and starch in the tubers of both
Lole and Wanmun cultivars were not significantly affected by the soil water regimes at
3 months after planting; but they increased significantly at harvest (6 months after
planting), at which time the sucrose concentration was found to be significantly higher
under the water stress conditions in both cultivars.
Geigenberger et al. (1999) reported a rise in sucrose concentrations in potato tubers
grown under water stress. Increased sucrose contents are often associated with
restrictions in starch accumulation and an enhancement of sucrose phosphate synthetase
111

activity, an enzyme that generates sucrose in plant tissue (Rufty and Huber, 1983).
Indira and Kabeeratumma (1988) found that the sugar content of sweet potato tubers
increased while the starch content decreased with water stress at maturity.
Cultivar Lole
05
101520253035404550
20 40 80 20 40 80
3 months 6 months
Org
anic
con
tent
(u
g/g
dry
wei
ght)
sucrose total starch
% of soil field capacity
(a)
Cultivar Wanmun
05
101520253035404550
20 40 80 20 40 80
3 months 6 months
Org
anic
con
tent
(u
g/g
dry
wei
ght)
sucrose total starch
% of soil field capacity
(b)
Figure 3.14 The effect of soil water contents on the concentration of sucrose and total starch in the tubers of two sweet potato cultivars at 3 and 6 months after planting. Error bars represent standard errors of means with 3 replications.
112

The tuber starch concentrations at harvest time of both cultivars used in the present
study increased with increasing soil water content. The starch concentration was found
to increase in the Lole and Wanmun cultivars under well watered conditions. As growth
progressed from 3 months to harvest at 6 months after planting, the starch content
declined in cv Lole but increased in cv Wanmun grown under water stress conditions.
Concentrations of total starch content may have increased because of the larger tubers
developed at 6 months than at 3 months. Hence, it is suggested that the decline of starch
content at harvest under water stress conditions in cv Lole was probably related to the
enzymes catalysing starch synthesis which are adversely affected, with photosynthate
accumulating as sucrose in the tuber. Mukhopadhyay et al. (1999) also reported sweet
potato tuber starch content gradually increasing to a maximum at harvest time (150
days, or 4 months after planting).
The Lole cultivar had significantly higher tuber sucrose concentrations, but lower starch
concentrations than cv Wanmun (Fig. 3.14). The physiological mechanisms behind the
increase of sucrose concentration in tubers need deeper study. However, it has been
widely reported that, under drought conditions, sucrose concentrations in the leaves of
sorghum increased (Premachandra et al., 1992). Premachandra et al. (1992) reported
increased concentrations of soluble sugars and potassium in plant cell sap was
associated with their contribution to osmotic potential. Under drought conditions,
carbon fixation used primarily for sucrose production is utilised for osmotic adjustments
(Jones et al., 1980). Plant cells that have greater osmotic potential can sustain their
metabolic activity for longer time under the influence of drought conditions (Blum et
al., 1989). Further study is clearly needed in relation to the sucrose concentration of
113
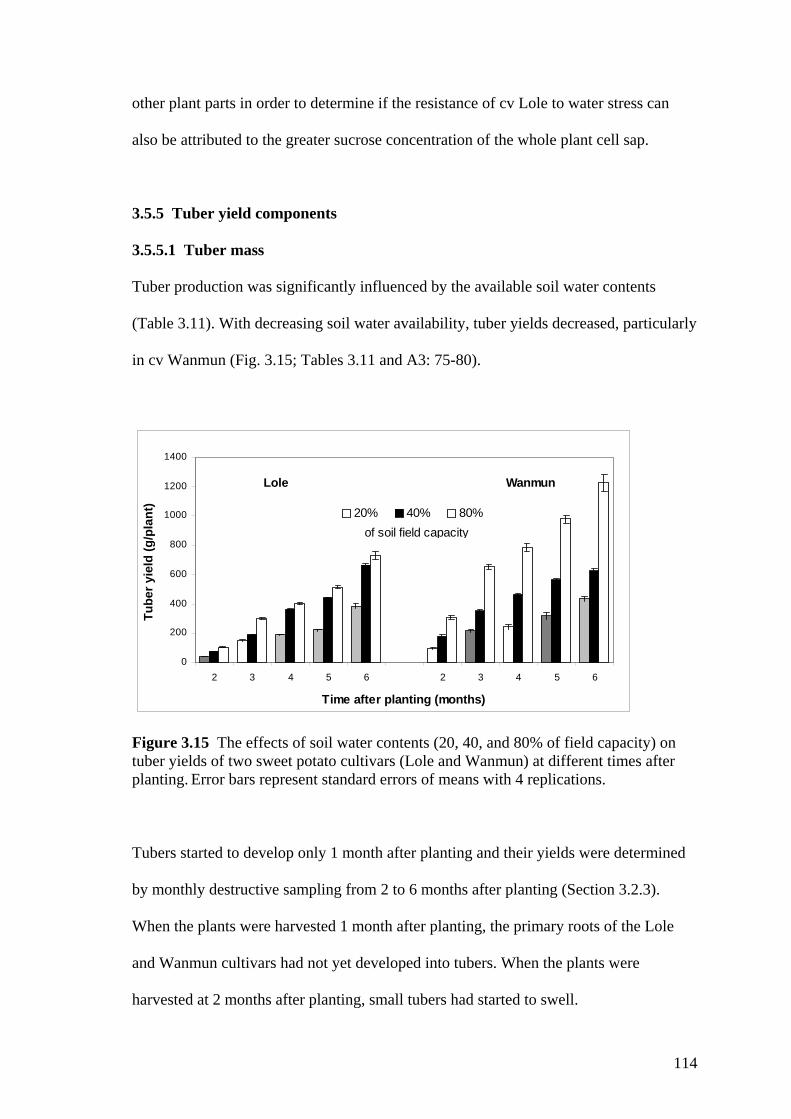
other plant parts in order to determine if the resistance of cv Lole to water stress can
also be attributed to the greater sucrose concentration of the whole plant cell sap.
3.5.5 Tuber yield components 3.5.5.1 Tuber mass
Tuber production was significantly influenced by the available soil water contents
(Table 3.11). With decreasing soil water availability, tuber yields decreased, particularly
in cv Wanmun (Fig. 3.15; Tables 3.11 and A3: 75-80).
Lole Wanmun
0
200
400
600
800
1000
1200
1400
2 3 4 5 6 2 3 4 5 6
Time after planting (months)
Tube
r yie
ld (g
/pla
nt)
20% 40% 80%of soil field capacity
Figure 3.15 The effects of soil water contents (20, 40, and 80% of field capacity) on tuber yields of two sweet potato cultivars (Lole and Wanmun) at different times after planting. Error bars represent standard errors of means with 4 replications. Tubers started to develop only 1 month after planting and their yields were determined
by monthly destructive sampling from 2 to 6 months after planting (Section 3.2.3).
When the plants were harvested 1 month after planting, the primary roots of the Lole
and Wanmun cultivars had not yet developed into tubers. When the plants were
harvested at 2 months after planting, small tubers had started to swell.
114

The tuber yield of cv Lole at 6 months after planting declined by 62% and 28% when
grown under 20% and 40% of soil field capacity, respectively, in comparison to yields
produced under 80% of soil field capacity. At the same time, the tuber yield of cv
Wanmun also declined by 69% and 41% when grown under 20% and 40% of soil field
capacity. At harvest (6 months after planting) the maximum tuber yields per plant were
produced by cv Wanmun (1228.5 g per plant) under non-limiting water conditions.
Although cv Wanmun produced about twice the mass of tubers/plant than cv Lole under
well watered conditions, its tuber production was severely affected by water stress and
produced a mass of tubers/plant equivalent to that of cv Lole when both cultivars were
grown under 40% of soil field capacity (Fig. 3.15). The ability of cv Lole to sustain
tuber production under severe water stress confirms its strong drought tolerance.
3.5.5.2 Tuber numbers
The number of sweet potato tubers produced per plant was significantly affected by soil
water stress (Table 3.11). When grown under non-limiting water conditions (80% of
soil field capacity), cv Lole produced significantly more tubers than did cv Wanmun
(Fig. 3.16; Tables 3.11 and A3: 79), but they were significantly smaller than those
produced by either cv Wanmun or cv Lole at 40% field capacity. The interaction
between cultivars and soil water regimes was also significant for the numbers of tubers
produced per plant (Table 3.11).
115

0
2
4
6
8
10
12
20 40 80
Soil moisture content (20%, 40% and 80% of soil field capacity)
Tube
r num
ber/p
lant
Lole Wanmun
Figure 3.16 The effect of soil water contents (20%, 40%, and 80% of field capacity) on the number of tubers produced per plant by Lole and Wanmun cultivars at harvest time (6 months after planting). Error bars represent standard errors of means with 4 replications.
Increasing water stress (i.e. lower soil water contents) slightly depressed the number of
tubers produced by cv Lole. For instance, Lole under the 40% soil water regime
produced no more than 2 or 3 tubers per plant. But the number of tubers produced by cv
Wanmun (4 - 5) was unaffected by different soil moisture contents (Fig. 3.16). The Lole
cultivar grown under 40% of soil field capacity produced comparable masses of
marketable tubers (247.5 g/tuber) with those of cv Wanmun grown under 80% of soil
field capacity (243.8 g/tuber; Fig. 3.17). However, cv Lole produced a lower total mass
of tubers per plant than did cv Wanmun under 80% of soil field capacity.
116

(3)
0
50
100
150
200
250
300
20 40 80Soil moisture content
(20, 40, 80 % of soil field capacity )
Ave
rage
fres
h m
ass
of
tube
rs (g
/pla
nt)
(3)
(9)
Lole Cultivar(a)
(4)
0
50
100
150
200
250
300
20 40 80Soil moisture content
(20, 40, 80 % of soil field capacity)
Ave
rage
fres
h m
ass
of
tube
rs r
(g/p
lant
) (5)
(5)Wanmun Cultivar(b)
Figure 3.17 The effect of soil water contents (20%, 40%, and 80% of soil field capacity) on tuber size (average fresh mass per tuber) of two sweet potato cultivars. The number in brackets is the average number of tubers produced per plant. The yield of sweet potato genotypes is known to be highly responsive to environmental
conditions (Luh and Moowaw, 1979). The present study has shown that 80% soil field
capacity was the most effective water regime in promoting high tuber yields in cv
Wanmun, as these conditions produced the maximum tuber yield at the harvest time (6
months after planting) of 1228 g of tubers/plant with a fresh mass of 243.7 g per tuber
(Figs 3.15 and 3.17). These yields compare the production of cv Lole at 728 g/plant and
a fresh mass of 79.9 g/tubers (Figs 3.15 and 3.17). The greater tuber yield in cv
Wanmun was attributed to the earlier onset of tuber formation. It has also been reported
that tuber formation in sweet potato may start between 1 and 13 weeks after planting
(Ravi and Indira, 1999). Hence, the genotypic differences observed between the studied
cultivars, may be a result of differences in the rate of photosynthesis and leaf area
(regarded as the source potential), and the number and the mean weight of storage roots
(regarded as the sink capacity), both of which have been shown to vary widely among
sweet potato cultivars (Ravi and Indira, 1999).
117

Conversely, cv Lole favoured the lower water regimes and, when grown under non-
limiting water conditions, produced greater fibrous root masses per plant and more
tubers at the expense of tuber mass per plant (Figs 3.16 and 3.18). As a result, it
produced no marketable tubers under the well watered conditions. Tuber initiation in
sweet potato was found by Indira and Kabeerathumma (1988) to be reduced by water
stress, but water stress during tuber development increased tuber yield over the well
watered control, and water stress during tuber maturation produced a slight decrease in
tuber yield.
Figure 3.18 Tuber components as affected by different soil water levels in 2 sweet potato cultivars, Lole and Wanmun.
Goswami et al. (1995) showed that top growth of sweet potato was promoted over root
growth under frequent irrigation, because photosynthesis is utilised primarily for the
production of shoot biomass. On the other hand, the fibrous roots of cv Lole were more
abundant than tubers when grown under non-limiting water conditions (Fig. 3.18),
showing that the level of soil moisture alters the pattern of photosynthetic distribution
favouring fibrous root growth.
118

The detrimental effect of water stress was not equally apparent over all of the sweet
potato growth stages (Indira and Kabeerathumma, 1988), nor across the different
cultivars. Bourke (1989) found that the number of tuberous roots is reduced when sweet
potato is exposed to wet periods between 3 and 10 weeks after planting. Thus, drought
has a very strong impact on sweet potato yield during the tuber-bulking phase later in
the crop life (Bourke, 1989).
Goswami et al. (1995) observed that the sweet potato cultivar V-35, with long and thick
tubers, produced higher tuber masses per plant than cv X-47 that yielded greater tuber
numbers; the higher yield of cv V-35 was attributed to its high sink efficiency.
In general, sweet potato cultivars performed differently when grown under different soil
moisture contents. A high soil water content (80% of field capacity) was found to be
suitable for the growth and development of the Wanmun cultivar. The growth and
development of cv Lole’s tubers were impeded, however, by the high soil water content;
and that fibrous roots flourished and small tubers developed at the expense of larger
tubers.
On the other hand, the number of tubers produced by cv Wanmun was unaffected by
different soil water regimes (Fig. 3.16), possibly because cv Wanmun started tuber
growth earlier than did cv Lole. Withholding water (i.e. growing the plants under 40%
and 20% of the soil field capacity) during the first 2 weeks from the initial planting had
little impact on the formation of tubers in cv Wanmun.
119
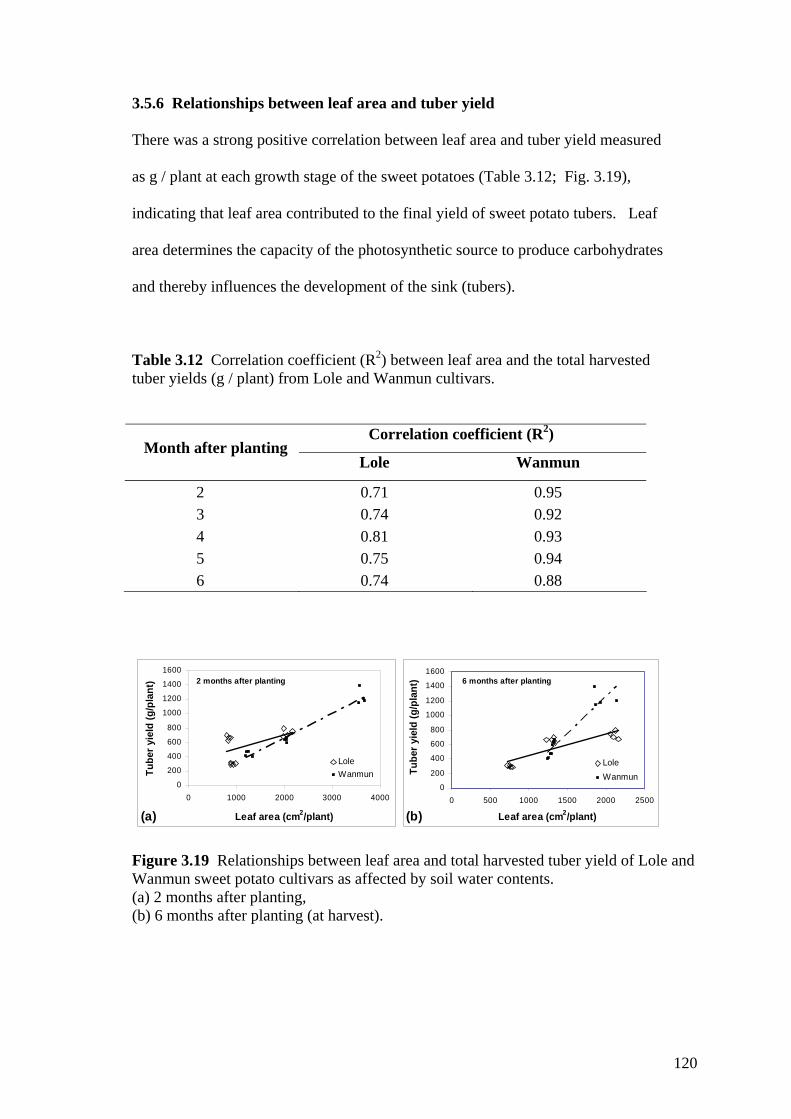
3.5.6 Relationships between leaf area and tuber yield
There was a strong positive correlation between leaf area and tuber yield measured
as g / plant at each growth stage of the sweet potatoes (Table 3.12; Fig. 3.19),
indicating that leaf area contributed to the final yield of sweet potato tubers. Leaf
area determines the capacity of the photosynthetic source to produce carbohydrates
and thereby influences the development of the sink (tubers).
Table 3.12 Correlation coefficient (R2) between leaf area and the total harvested tuber yields (g / plant) from Lole and Wanmun cultivars.
Correlation coefficient (R2) Month after planting
Lole Wanmun
2 0.71 0.95 3 0.74 0.92 4 0.81 0.93 5 0.75 0.94 6 0.74 0.88
2 months after planting
0
200
400
600
800
1000
1200
1400
1600
0 1000 2000 3000 4000
Leaf area (cm2/plant)
Tube
r yie
ld (g
/pla
nt)
LoleWanmun
(a)
6 months after planting
0
200
400
600
800
1000
1200
1400
1600
0 500 1000 1500 2000 2500
Leaf area (cm2/plant)
Tube
r yie
ld (g
/pla
nt)
LoleWanmun
(b)
Figure 3.19 Relationships between leaf area and total harvested tuber yield of Lole and Wanmun sweet potato cultivars as affected by soil water contents. (a) 2 months after planting, (b) 6 months after planting (at harvest).
120

Bhagsari (1990) found that genotypic differences in dry matter production and
photosynthetic activity of sweet potato (and in their physiological processes and
morphological features) often were not correlated with storage root yield. The absence
of strong correlations in the present study between total dry matter production and tuber
(storage root) yields indicates that physiological and biochemical processes that are not
related to the source potential have also affected the harvested tuber yield (Kuo and
Chen, 1992). The findings of Spence and Humphries (1972 in Ghuman and Lal 1983)
support the results of the present study, in that the storage root yield increased with
increasing shoot weight as a consequence of increased photosynthetic surface.
However, the yield of storage roots is not only controlled by the source potential but
also by the sink strength (Kuo and Chen, 1992).
3.6 Conclusions
As found by Onwueme and Charles (1994), the results of the present study clearly
showed that, irrespective of soil water contents, the growth of sweet potato occurs in 3
phases that vary among cultivars and with environmental conditions:
• an initial phase, when the fibrous root grow extensively and the vines grow
moderately;
• a middle phase, when the vines grow extensively, tubers are initiated, and leaf area
increases remarkably;
• a final phase, when tuber bulking occurs and the growth of the vines, total leaf
area, and fibrous roots declines.
Water stress significantly reduced plant biomass (shoot weight, branch number, leaf
mass and area, and root mass). Plant biomass was severely affected when sweet potato
121

plants were grown under a strong water stress (20% of soil field capacity). The shoot
biomass increased until approximately 3 months after planting, before it declined
toward the maturity stage.
The Wanmun cultivar produced significantly higher shoot biomass than did Lole under
all levels of soil moisture studied, and its fibrous root (non-tuber) biomass was
significantly lower than that of the more drought tolerant cv Lole. Under higher soil
water contents, cv Lole tended to produce extensive fibrous roots, while the fibrous
roots of cv Wanmun were restricted at the time of tuber development.
The Lole cultivar showed less transpiration than cv Wanmun when grown under all of
soil water contents studied; its transpiration rate increased sharply from 1 month to 3
months after planting, and was greater in the well watered plants than in the water
stressed plants. Transpiration was relatively constant after 3 months and then declined at
harvest stage. The sharp increase in transpiration between 1 month and 3 months after
planting was attributed to active vegetative growth and rapid tuber development.
Leaf water potential and leaf relative water content of both cultivars were affected by
water stress, especially when transpiration was high at midday. Plants grown under 20%
of soil field capacity had the lowest leaf water potentials and leaf relative water
contents. A diurnal pattern of leaf water potential and relative water content appeared in
all cultivars and under all soil water contents as a result of the water absorption and
transpiration patterns of the plants.
122

Leaf pigments were significantly higher under well watered conditions in both cultivars,
but with increasing levels of water stress, leaf pigment concentrations decreased
significantly; a similar trend was evident as the plants approached maturity.
The leaf surfaces of cv Wanmun had more stomata than those the drought tolerant Lole
cultivar. Stomatal densities were different on the adaxial and abaxial leaf surfaces of
both cultivars where the abaxial leaf surface contained a higher number of stomata.
Water stress had no significant effect on the stomatal density of either leaf surface of
either cultivar.
Tuber compositions were not different in plants grown under the different soil water
levels at early plant development stages. At maturity, however, the plants grown under
well watered conditions produced tubers with lower sucrose and higher starch
concentrations than those grown under lower available soil water conditions. The Lole
cultivar tubers had significantly higher sucrose and lower starch concentrations than
those of the cv Wanmun tubers. High starch and lower sucrose contents in sweet potato
are suitable for industrial products such us flour; on the other hand, however, many
people prefer higher sucrose concentrations for fresh food consumption.
The Lole and Wanmun sweet potato cultivars grown under restricted soil water
conditions produced low tuber yields. Tuber production was strongly related to the
production of plant biomass and the expansion of leaf area. The Wanmun cultivar
produced higher yields when grown under 80% of soil field capacity indicating that a
large proportion of photosynthate in this cultivar was partitioned to the tuber.
123
On the other hand, cv Lole plants grown at higher soil water contents produced large
numbers of tubers per plant, but most of these were below marketable weight. The more
drought tolerant cv Lole plants grown at 40% of the soil field capacity, however,
produced masses of marketable tubers that were comparable with the masses of
marketable tubers from the more drought sensitive Wanmun plants grown under much
wetter soil conditions (80% of the soil field capacity).
In conclusion, different soil water regimes were found to be important in stimulating
tuber yields from particular cultivars. However, the optimal soil moisture content
depends on the genotype under cultivation. A high yielding cultivar of cv Wanmun
required higher soil water regimes to stimulate good tuber yields; on the other hand they
reduced the mass of tubers produced by cv Lole. This showed that greater vegetative
components accounted for the greater tuber yields with the expense of greater water
consumption in cv Wanmun.
124

CHAPTER 4
EFFECTS OF NITROGEN AND POTASSIUM ON WATER RELATIONS, GROWTH, PHYSIOLOGICAL CHARACTERISTICS,
AND YIELD OF SWEET POTATO
4.1 INTRODUCTION
Inadequate soil moisture or water stress, as discussed in the preceding chapters, affects
plant physiological functions, biomass production, and tuber yields of sweet potato.
Another environmental factor that is known to cause low yields in sweet potato is low
soil fertility. Nitrogen (N), phosphorus (P), and potassium (K) are three macronutrients
that are essential for the growth of all plants. They are needed to restore soil fertility,
but sweet potato has rarely been reported to respond to phosphorus (Norman et al.,
1995), probably due to its efficiency of phosphorus utilization. The essential elements,
however, are not only capable of restoring soil fertility, but they have also been reported
to improve osmotic adjustment within plants (Ashraf et al., 2001), hence improving
their water use efficiencies.
Nitrogen is an essential component for photosynthesis, and the synthesis of chlorophyll
and proteins (O’Sullivan, 1997; Satchithanantham and Bandara, 2002). However, a high
nitrogen supply may cause abundant growth of sweet potato vines at the expense of
storage root development (O’Sullivan, 1997). Responses of sweet potato to nitrogen
also depend greatly on genotypic and environmental variations (Hill, 1984; Villagarcia
and Collins, 1998).
125
In tuber crops, the main effect of low soil nitrogen contents under well-watered
conditions is to decrease shoot growth, while tuber yields may or may not be reduced
(Taufatofua and Fukai, 1996). Depending on soil conditions, nitrogen applications up to
certain rates increase crop growth and yield. In one sweet potato study, marketable
tuber yields were highest with the application of 100 kg N/ha, and decreased with
increasing nitrogen fertilizer rates (Hartemink, et al., 2000).
Nitrogen deficiency may lead to increased stomatal conductance and greater
transpiration per unit leaf area due to stomatal opening, thereby resulting in decreased
water use efficiency (Morris et al., 1998; Kelm et al., 2000). In sweet potato, this was
probably a consequence of lower total dry matter production rather than increased total
water transpiration per plant (Kelm et al., 2000). Higher yields in maize, on the other
hand, can be achieved by supplemental nitrogen primarily because of its vigorous root
system (Morris et al., 1998), hence deep root penetration into the soil matrix.
Potassium, an important cation in many physiological and biochemical processes, is
required by many plants as much, or even more than nitrogen (Marschner, 1995). The
requirement for potassium is higher in sweet potato than in cereals especially in the
harvested roots (O’Sullivan et al., 1997). Potassium has an important effect on
photosynthesis, especially carbohydrate and protein synthesis (Pier and Berkowitz,
1987; Robitaille and Lawrence, 1992), and maintains and regulates cell turgor and
stomatal movement (Beringer and Nothdurft, 1985; Hsiao and Lauchli, 1986).
Potassium influences plant water status and tends to overcome the effects of soil
moisture deficiencies (Marschner, 1995; Jayawardane, 1984; Losch et al., 1992). Plants
well supplied with potassium can better regulate their stomatal opening and closing
126
thereby preventing excessive water loss by the plant (Sivan, et al., 1996), and providing
a drought tolerance mechanism.
In food legumes, potassium has been found to promote root growth under water stress
conditions, thereby improving water use efficiency by improving the tolerance of the
plant to soil water deficits (Sangakkara et al., 2000). Ashraf et al. (2001) found that
additional amounts of potassium fertilizer did not relieve the effect of water stress on
the growth of pearl millet, particularly on shoot mass, relative growth rate, leaf area, net
assimilation rate, photosynthetic rate, transpiration rate, stomatal conductance, and
water use efficiency, even though the effect of drought stress on those variables was
significant. This indicates that there was adequate potassium already in the soil and that
it was not limiting millet growth. Considerable osmotic adjustment occurred, however,
when pearl millet plants experienced water deficits under a high potassium supply
(Ashraf et al., 2001).
It is widely known that sweet potato requires high potassium contents in the soil to
promote tuber formation and development (Scott and Bouwkamp, 1974; O’Sullivan,
1997, Valenzuela et al., 2000). However, the role of potassium in relation to
overcoming soil moisture deficits in sweet potato has rarely been reported. As sweet
potato is often planted in drought-prone areas, potassium from fertilizers could be
expected to have beneficial effects not only increasing tuber yields, but also in
improving water use efficiency.
Therefore, an experiment was carried out to study the influence of nitrogen and
potassium on water stress and productivity in sweet potato. The trial was conducted by
observing the effects of nitrogen and potassium on the growth, yield, and physiological
127
characteristics of two sweet potato cultivars, Lole and Wanmun, grown under different
soil water regimes.
4.2 MATERIALS AND METHODS
4.2.1 Experimental location
A pot experiment was conducted from 1 March to 31 July 2004 in a shadehouse at the
School of Marine and Tropical Biology, James Cook University, Townsville,
Queensland, Australia.
4.2.2 Experimental design
Two sweet potato cultivars (drought-tolerant Lole and drought-sensitive Wanmun) were
used as indicator plants and two soil water regimes were applied (30% and 80% of the
soil field capacity) with the application of complete and partial nutrients (normal NPK
level, a partial nitrogen level, and a partial potassium levels). A water content of 30% of
soil field capacity was imposed as a water stress treatment that would still able to
support reasonable growth and tuber yields, while another treatment at 80% of the soil
field capacity was imposed as a control in which sweet potato would be expected to
produce vigorous growth and maximum tuber yields.
In this experimental design, treatments 3 and 6 each consisted of the same 16 nutrient
applications and one of them was omitted; the results of the remaining treatment were
incorporated in both the nitrogen and potassium experiments. The total number of
experimental units was, therefore, 80 pots; each pot held one plant.
128

Two separate experiments were carried out in complete randomised designs with 4
replications. The first experiment of 48 pots was a nitrogen fertilizer trial with 3
nitrogen levels, 2 soil water levels, and 2 cultivars, and the second of 48 pots was a
potassium fertilizer trial with 3 potassium levels, 2 water soil levels, and 2 cultivars.
They were run concurrently using 10 L undrained pots containing 11 kg of clean,
washed, coarse sand as the growing medium.
Nitrogen and potassium treatments were applied as follows:
• The nitrogen treatments consisted of 20, 100, and 200 kg of N / ha from
ammonium nitrate, with a non-limiting potassium supply (160 kg of K/ha)
• The potassium treatments consisted of 16, 80, and 160 kg of K / ha from
potassium chloride, with a non-limiting nitrogen supply (200 kg of N/ha).
Combinations of the nutrient treatments were:
1. N20, K160
2. N100, K160
3. N200, K160
4. K16, N200
5. K80, N200
6. K160, N200
The N and K inputs were applied to the pots as 4.35 g, 2.15 g, and 0.29 g NH4NO3 per
pot which were equivalent to 200 kg N, 100 kg N and 20 kg N/ha, respectively, and as
1.38 g, 0.69 g, and 0.14 g KCl per pot which were equivalent to 160 kg K/ha, 80 kg K/
ha and 16 kg K/ha, respectively.
129
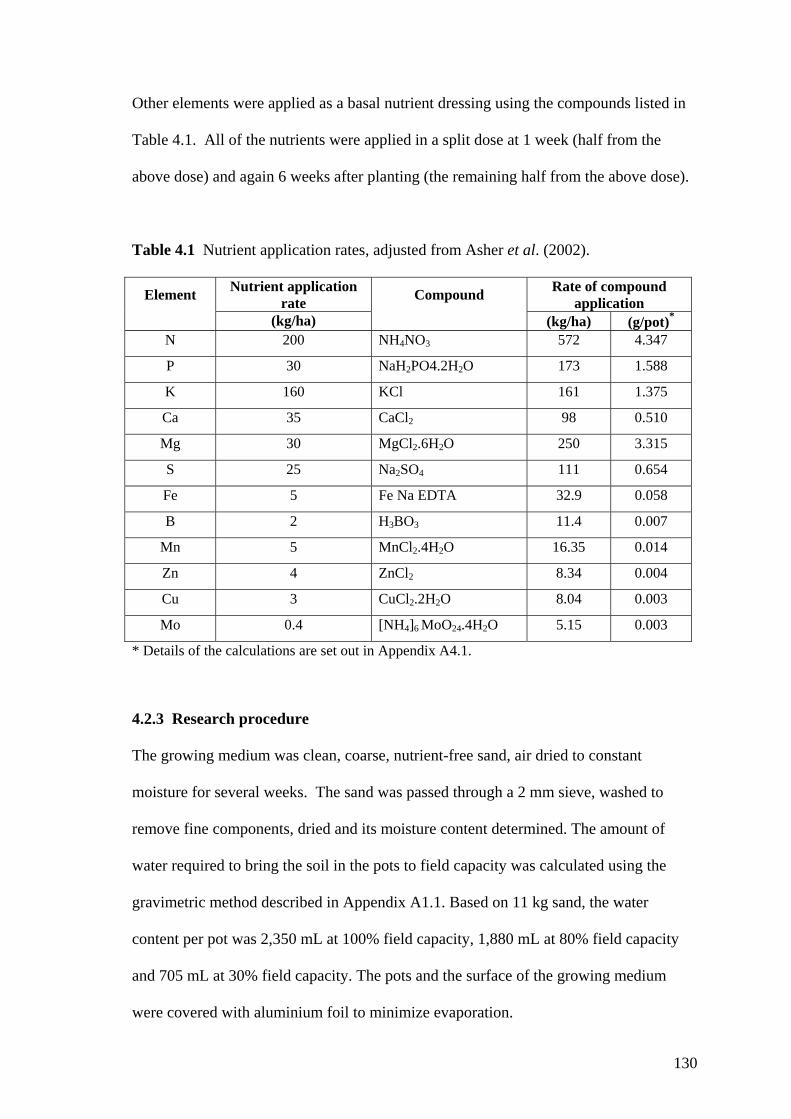
Other elements were applied as a basal nutrient dressing using the compounds listed in
Table 4.1. All of the nutrients were applied in a split dose at 1 week (half from the
above dose) and again 6 weeks after planting (the remaining half from the above dose).
Table 4.1 Nutrient application rates, adjusted from Asher et al. (2002).
Element Nutrient application rate Compound Rate of compound
application (kg/ha) (kg/ha) (g/pot)*
N 200 NH4NO3 572 4.347
P 30 NaH2PO4.2H2O 173 1.588
K 160 KCl 161 1.375
Ca 35 CaCl2 98 0.510
Mg 30 MgCl2.6H2O 250 3.315
S 25 Na2SO4 111 0.654
Fe 5 Fe Na EDTA 32.9 0.058
B 2 H3BO3 11.4 0.007
Mn 5 MnCl2.4H2O 16.35 0.014
Zn 4 ZnCl2 8.34 0.004
Cu 3 CuCl2.2H2O 8.04 0.003
Mo 0.4 [NH4]6 MoO24.4H2O 5.15 0.003
* Details of the calculations are set out in Appendix A4.1.
4.2.3 Research procedure
The growing medium was clean, coarse, nutrient-free sand, air dried to constant
moisture for several weeks. The sand was passed through a 2 mm sieve, washed to
remove fine components, dried and its moisture content determined. The amount of
water required to bring the soil in the pots to field capacity was calculated using the
gravimetric method described in Appendix A1.1. Based on 11 kg sand, the water
content per pot was 2,350 mL at 100% field capacity, 1,880 mL at 80% field capacity
and 705 mL at 30% field capacity. The pots and the surface of the growing medium
were covered with aluminium foil to minimize evaporation.
130

Shoot tip cuttings of sweet potato stems, 25 cm long, were made and allowed to stand in
water for 2 days. The cuttings were planted into non-draining 10 L pots containing 11
kg of air-dried sand that had been watered to field capacity. Water was then withheld
for 1 week until the soil moisture content reached 80% for the control (with non-
limiting water conditions), and for 3 weeks until 30% field capacity for the water
stressed treatments. The plants were then watered to the nominated percentage of field
capacity every second day, based on the weight lost from the pots by transpiration.
To control insects, mostly red spider mite, the plants were sprayed with Garden King
Red Spider Miticide, at 5 mL/L water, once every 2 weeks.
4.2.4 Experimental measurements
The plants were harvested 5 months after planting. Each plant was separated into leaf
blades, remainder of shoot (vines plus petioles), tubers, and roots. At harvest, tuber
fresh weight and total leaf area per plant were recorded. Leaves, vines and roots were
dried at 70 ºC and the dry masses were recorded. Other physiological variables
calculated included leaf dry matter content and specific leaf weight using the methods
set out in Appendix A1.1.3. Chlorophyll and carotene concentrations of leaves were
determined at 4 months after planting
To quantify crop water relations, transpiration was recorded as the weight losses from
the pots every second day (Appendix A1.3.4) and water use efficiencies were calculated
at the end of the experiment (Appendix A1.3.4).
131

4.2.5 Statistical analysis
Analyses of variance based on factorial experiments in complete randomized designs
were conducted to test the significance of each treatment effect and their interactions.
The Duncan Multiple Range Test was used to determine whether the effects of the
treatments on plant growth parameters were significant.
4.3 RESULTS AND DISCUSSION
4.3.1 Climatic conditions Daily minimum and maximum air temperature, and relative humidity records were
obtained for the period of the experiment from the Commonwealth of Australia, Bureau
of Meteorology, Queensland (Figs 4.1 and 4.2). The average maximum weekly
temperature declined slightly from 32 oC in March to 29 oC in July 2004, whereas the
minimum weekly temperature fell from 24 oC to 19 oC (Fig. 4.1). Relative humidity was
relatively constant between March and July 2004 (Fig. 4.2).
132

0
5
10
15
20
25
30
35
1 2 3 4 5 1 2 3 4 1 2 3 4 5 1 2 3 4 5 1 2 3 4 5
March April May June July
Tem
pera
ture
(oC
)
Max Min weekly temperature
Figure 4.1 Weekly mean daily maximum and minimum air temperatures (oC), at Townsville Airport, from 1 March to 31 July 2004. Source: Commonwealth Bureau of Meteorology, Queensland.
0
10
20
30
40
50
60
70
80
1 2 3 4 5 1 2 3 4 1 2 3 4 5 1 2 3 4 5 1 2 3 4 5
March April May June July
Rel
ativ
e hu
mid
ity (%
)
Weekly relative humidity (RH) at 9 AM RH at 15 PM
Figure 4.2 Relative humidity at 9.00 am and 3.00 pm at Townsville Airport, from 1 March to 31 July 2004. Source: Commonwealth Bureau of Meteorology, Queensland.
133
4.3.2 Plant growth characters
The effects of soil water regimes, nutrients, and cultivars on dry shoot mass, leaf mass
and area, specific leaf area, and specific leaf weight are summarized in Tables 4.2, A4:
1-8, and A4: 31-32.
In general, soil water regimes and nitrogen levels significantly affected the dry shoot
mass, leaf mass, leaf area, and specific leaf weight of the Lole and Wanmun cultivars
(Table 4.2). In the nitrogen experiment, there was no significant interaction between soil
water regimes and cultivars on the leaf dry mass and leaf area, but there was a
significant interaction between cultivars, soil water contents, and nutrients with shoot
and leaf dry masses, leaf area, tuber yield, and total chlorophyll. In the potassium
experiment, there was a significant interaction between cultivars, soil water contents,
and nutrients on leaf area, tuber yield, and total chlorophyll and carotene concentrations.
Neither the N nor K experiment showed any significant interactions with cultivars, soil
water contents, and nutrients on specific leaf weight, dry root mass, and chlorophyll a/b
ratio.
134

Table 4.2 Nitrogen, potassium, soil water contents, cultivars, and their interactions on the vegetative growth, yield components, and pigment contents of two sweet potato cultivars.
The effect of #Plant parameters W C T W*C C*T W*T C*W*T
• Dry shoot mass N experiment * * * ns * ns * K experiment ns * * * * ns ns • Dry leaf mass
N experiment * * * ns * * * K experiment * * ns * * ns ns • Leaf area
N experiment * * * ns * ns * K experiment ns * * * ns ns * • Specific leaf weight
Effect of N ns * ns ns ns ns ns Effect of K * * * ns ns ns ns • Dry root mass
Effect of N * * * ns ns ns ns Effect of K * * ns * ns ns ns • Tuber yield (fresh mass)
Effect of N * * * * * * * Effect of K * * * ns * * * • Total chlorophyll
Effect of N * * * * * * * Effect of K * * * ns * * * • Carotene
Effect of N * * * * * * ns Effect of K * * * ns * * * • Chlorophyll a/b ratio
Effect of N ns ns ns ns ns * ns Effect of K * ns ns ns ns ns ns # ns (no significant effect); * the main effect or interaction is significant (p < 0.05) W = water; C = cultivar; T = nutrient (N for the N experiment, and K for the K experiment) W*C = interaction between soil water contents and cultivars C*T = interaction between cultivars and nutrient levels W*T = interaction between soil water contents and nutrient levels C*W*T = interaction between soil water contents, cultivars and nutrient levels
4.3.2.1 Dry shoot mass The effects of nitrogen and potassium on the dry shoot mass of the Lole and Wanmun
cultivars grown under two soil water contents (30% and 80% of soil field capacity) are
presented in Table 4.2 and Fig. 4.3.
135

The dry shoot mass of both cultivars was significantly reduced by both water stress and
lower N supply (Fig. 4.3, Tables A4: 1 and A4: 31). Under water stress conditions, the
dry shoot mass of the Lole and Wanmun cultivars were similarly low (4.7 g/plant) when
grown under low soil nitrogen conditions (20 kg N per ha) and increased with soil
nitrogen content and soil water availability (Fig. 4.3). The greatest shoot mass under
water stress was recorded when the plants were grown at 200 kg N/ha (17.8 and 22.8
g/plant in the Lole and Wanmun cultivars, respectively). Under well-watered and low
nitrogen conditions, both of the cultivars had reduced shoot masses (7.7 and 8.5 g/plant,
respectively). The greatest shoot dry mass was in cv Wanmun (46.0 g/plant), followed
by cv Lole (27.5 g/plant) grown under non-limiting nitrogen (Fig. 4.3); cv Wanmun
was more affected by the lower soil nitrogen supply than cv Lole.
Under both well watered and stressed conditions, the dry shoot mass of cv Lole was
relatively unaffected by the addition of K to the soil (Fig. 4.3), but the shoot mass of cv
Wanmun increased. The effect of potassium on the dry shoot mass was greater when cv
Wanmun was grown under well watered than stressed conditions (Fig. 4.3; Tables A4: 2
and A4: 32).
136

444 444N =
Lole cultivar
Nitrogen (kg/ha)
20010020
Sho
ot d
ry m
ass
(g/p
lant
) 50
40
30
20
10
0
Soil FC
30%
80%
444 444N =
Wanmun cultivar
Nitrogen (kg/ha)
20010020
Sho
ot d
ry m
ass
(g/p
lant
) 50
40
30
20
10
0
Soil FC
30%
80%
444 444N =
Lole cultivar
Potassium (kg/ha)
1608016
Sho
ot d
ry m
ass
(g/p
lant
) 50
40
30
20
10
Soil FC
30%
80%
444 444N =
Wanmun cultivar
Potassium (kg/ha)
1608016
Sho
ot d
ry m
ass
(g/p
lant
) 50
40
30
20
10
Soil FC
30%
80%
Figure 4.3 The effects of N and K on dry shoot mass of Lole and Wanmun sweet potato cultivars grown under 30% and 80% soil field capacity. Error bars represent standard errors of means with 4 replications. The nitrogen responses are shown for the non-limiting K trial, and the potassium responses for the non-limiting N trial. The decline in dry shoot mass under water stress and reduced N supply in both cultivars
was associated with a decline in leaf mass and area. The plants were stunted when
grown under limited N (20 kg N / ha), as a consequence of reduced stem and leaf
growth. The leaves of the stunted plants of both cultivars showed chlorosis around the
midvein, which turned to yellow and red-purple and developed progressively in the
older leaves; the vine colour turned from green to red-purple, which is an indication of
the damage caused by reduced chlorophyll production.
137

Increasing nitrogen levels increased the shoot dry mass of both cultivars grown under
both soil water regimes. Regardless of K levels, a greater N supply produced greater
shoot growth irrespective of the soil water conditions. Soil potassium contents, on the
other hand, had less influence on the shoot dry mass, except in cv Wanmun which
increased slightly with increasing soil potassium content, particularly under well
watered conditions (Fig. 4.3). This was attributed to the greater biomass produced,
requiring a greater potassium uptake from the soil nutrient supply provided by the
higher potassium fertilizer inputs.
4.3.2.2 Dry leaf mass
Nitrogen produced a significant increase in the dry leaf mass of both cultivars under
both soil water regimes. The well-watered plants produced significantly greater dry leaf
masses than the water stressed plants did, and cv Wanmun produced more than cv Lole
(Fig. 4.4; Table A4: 3).
Under water stress, the dry leaf masses of both cultivars were reduced compared to that
when they grew under well-watered conditions. There was a significant interaction
between nitrogen and cultivar, and increasing nitrogen from 20 kg to 200 kg N/ha
increased leaf weight from 1.7 g/plant to 9.3 g/plant in cv Lole, and from 1.9 g/plant to
12.3 g/plant in cv Wanmun (Fig. 4.4; Table A4: 31).
138

444 444N =
Lole cultivar
Nitrogen (kg/ha)
20010020
Laef
dry
mas
s (g
/pla
nt) 20
15
10
5
0
Soil FC
30%
80%
444 444N =
Wanmun cultivar
Nitrogen (kg/ha)
20010020
Leaf
dry
mas
s (g
/pla
nt) 20
15
10
5
0
Soil FC
30%
80%
444 444N =
Lole cultivar
Potassium (kg/ha)
K160K80K16
Leaf
dry
mas
s (g
/pla
nt) 20
15
10
5
0
Soil FC
30%
80%
444 444N =
Wanmun cultivar
Potassium (kg/ha)
K160K80K16
Leaf
dry
mas
s (g
/pla
nt) 20
15
10
5
0
Soil FC
30%
80%
Figure 4.4 The effect of N and K on the dry leaf mass of the Lole and Wanmun sweet potato cultivars grown under 30 and 80% soil field capacity. Error bars represent standard errors of means with 4 replications. (The nitrogen responses are shown for the non-limiting K trial, and the potassium responses for the non-limiting N trial). Growth responses of sweet potato to nitrogen applications depend greatly on genotypic
and environmental variations (Hill, 1984; Villagarcia and Collins, 1998). The results of
the present study suggest that a greater soil nitrogen supply promoted the production of
leaf mass, while a nitrogen deficiency depressed leaf growth regardless of the presence
of sufficient other nutrients. The function of nitrogen is to stimulate leaf number and
area (Patil et al., 1992; Villagarcia and Collins, 1998). Without adequate soil nitrogen,
the rate of plant metabolism is affected due to decreased cell division and elongation
(Vasudevan et al., 1996). However, a high soil nitrogen supply may cause abundant
139

growth of the sweet potato vines at the expense of their storage roots (O’Sullivan,
1997).
The effect of soil potassium content on dry leaf mass was significantly different
between the cultivars (Tables 4.2, A4: 4, and A4: 32), and was greater in plants grown
under well watered than water stressed conditions.
Application of the increasing potassium levels did not stimulate increases in leaf
mass (Fig. 4.4). This suggests that K was not limiting growth in the present trial
whose results agree with those of Ashraf et al. (2001) where additional amounts of
potassium applied to pearl millet had no effect on shoot mass, relative growth rate,
leaf area, net assimilation rate, or photosynthetic rate. On the other hand, a
potassium deficiency in aroids reduced leaf size, area and number (Sivan et al.,
1996). In the presence of adequate potassium, water stress reduced the leaf growth
attributes of taro and tannia (Sivan et al., 1996), which corresponded with the results
of the present study.
4.3.2.3 Leaf area
Nitrogen additions had a significant positive effect on the leaf area of both cultivars
under both water regimes (Fig. 4.5; Tables A4: 5 and A4: 31). Bourke (1985) found that
nitrogen fertilizer increased leaf number, and as a consequence increased leaf area and
growth rates.
On the other hand, potassium additions produced a significant negative response to leaf
area in both cultivars under both soil water regimes (Fig. 4.5; Tables A4: 6 and A4:32).
140

The greater leaf areas produced by lower potassium supply was attributed to the
presence of non-limiting nitrogen contents in the soil.
444 444N =
Lole cultivar
Nitrogen (kg/ha)
20010020
Leaf
are
a (c
m2/
plan
t) 4000
3000
2000
1000
0
Soil FC
30%
80%
444 444N =
Wanmun cultivar
Nitrogen (kg/ha)
20010020
Leaf
are
a (c
m2/
plan
t) 4000
3000
2000
1000
0
Soil FC
30%
80%
444 444N =
Lole cultivar
Potassium (kg/ha)
1608016
Leaf
are
a (c
m2/
plan
t) 4000
3000
2000
1000
Soil FC
30%
80%
444 444N =
Wanmun cultivar
Potassium (kg/ha)
1608016
Leaf
are
a (c
m2/
plan
t) 4000
3000
2000
1000
Soil FC
30%
80%
Figure 4.5 The effect of N and K on the leaf area of Lole and Wanmun sweet potato cultivars grown under 30 and 80% soil field capacity. Error bars represent standard errors of means with 4 replications. (The nitrogen responses are shown for the non-limiting K trial, and the potassium responses for the non-limiting N trial). 4.3.2.4 Specific leaf weight
The specific leaf weights (masses) were significantly different between cultivars,
however, they were not significantly affected by different soil water regimes in the
nitrogen trial. Under water stress, the specific leaf weight of both cultivars declined, but
cv Lole produced a significantly greater specific leaf weight than cv Wanmun in the
nitrogen and potassium trials (Tables A4: 31, A4: 32). There was also no significant
141

interaction between the treatment effects on the specific leaf mass (Fig. 4.6; Tables 4.2,
A4: 7 and A4: 8).
The greatest specific leaf weight for both cultivars was recorded when sweet potato was
grown under low nitrogen conditions (20 kg N/ha) and well watered conditions (Fig. 4.6
and Table A4: 31). Nitrogen deficiency resulted in greater specific leaf weight (i.e.
heavier leaves per plant) and, conversely, a greater nitrogen supply resulted in lower
specific leaf weight. The increase in specific leaf weight under the low nitrogen supply
is likely to be the result of a build up of a carbohydrate excess that could not be used in
the synthesis of amino acids or other N-containing compounds (Larcher, 1995).
142

Lole Cultivar
Nitrogen (kg/ha)
20010020Spe
cific
Lea
f Wei
ght (
mg/
cm2)
10
8
6
4
2
0
Soil FC
30%
80%
Wanmun Cultivar
Nitrogen (kg/ha)
20010020Spe
cific
Lea
f Wei
ght (
mg/
cm2) 10
8
6
4
2
0
Soil FC
30%
80%
Lole Cultivar
Potassium (kg/ha)
1608016Spe
cific
Lea
f Wei
ght (
mg/
cm2)
10
8
6
4
2
0
Soil FC
30%
80%
Wanmun Cultivar
Potassium (kg/ha)
1608016Spe
cific
Lea
f Wei
ght (
mg/
cm2)
10
8
6
4
2
0
Soil FC
30%
80%
Figure 4.6 The effect of N and K on the specific leaf weight of Lole and Wanmun sweet potato cultivars grown under 30 and 80% of soil field capacity. Error bars represent standard errors of means with 4 replications. (The nitrogen responses are shown for the non-limiting K trial, and the potassium responses for the non-limiting N trial). Specific leaf weight was significantly higher in cv Lole than in cv Wanmun and was
significantly reduced by water stress in both cultivars. The higher rate of potassium
(160 kg/ha) significantly increased specific leaf weight of the sweet potato cultivars.
There was no significant difference (i.e. no interaction) in the effect of potassium on the
specific leaf weight of Lole and Wanmun cultivars, in relation to water stress (Fig. 4.6;
Tables 4.2, A4: 8, and A4: 32).
143

4.3.3 Root growth and tuber yields
The effects of the experimental factors (soil water contents, nutrients, and cultivars) on
dry root masses and tuber yields are summarized in Tables 4.2, A4: 9-12, and A4: 33-
34. In addition to the effect of K on dry root mass, soil water contents, cultivars, and
nutrition levels also significantly affected the dry root masses and tuber yields of the
sweet potatoes cultivars (Table 4.2). Most of the interaction effects were not statistically
significant for the dry root masses, but were significant for the tuber yields.
4.3.3.1 Dry root mass
Higher soil nitrogen levels produced greater dry root masses under well watered
(5.7 g/plant) than water stressed conditions (3.6 g/plant). The Lole cultivar produced
greater root masses under well watered conditions (7.9 g/plant) than cv Wanmun (3.4
g/plant). Under water stress, cv Lole also produced greater root dry mass (4.7 g/plant)
than cv Wanmun (2.4 g/plant). Greater soil nitrogen similarly produced significantly
greater root dry mass (Fig. 4.7; Tables A4: 9 and A4: 33).
144

444 444N =
Lole cultivar
Nitrogen (kg/ha)
20010020
Roo
t dry
wei
ght (
g/pl
ant) 20
15
10
5
0
Soil FC
30%
80%
444 444N =
Wanmun cultivar
Nitrogen (kg/ha)
20010020
Roo
t dry
wei
ght (
g/pl
ant) 20
15
10
5
0
Soil FC
30%
80%
444 444N =
Lole cultivar
Potassium (kg/ha)
1608016
Roo
t dry
wei
ght (
g/pl
ant) 20
15
10
5
0
Soil FC
30%
80%
444 444N =
Wanmun cultivar
Potassium (kg/ha)
1608016
Roo
t dry
wei
ght (
g/pl
ant) 20
15
10
5
0
Soil FC
30%
80%
Figure 4.7 The effects of nitrogen and potassium on dry root masses of Lole and Wanmun cultivars grown under 30% and 80% soil field capacity. Error bars represent standard errors of means with 4 replications. (The nitrogen responses are shown for the non-limiting K trial, and the potassium responses for the non-limiting N trial). The effects of potassium on the dry root mass was greater in plants grown under well
watered (8.3 g/plant) than water stressed conditions (4.8 g/plant). The Lole cultivar
produced significantly greater root dry mass (12.4 g/plant) than cv Wanmun (4.3
g/plant) under well-watered conditions. Under water stressed conditions, cv Lole
produced a much greater dry root mass (6.8 g/plant) than cv Wanmun (2.8 g/plant).
Different potassium levels did not significantly affect the root mass of either cultivar
(Fig. 4.7; Tables 4.2, A4: 10, A4: 34).
145

The present study clearly showed that the application of greater amounts of nitrogenous
fertilizer, regardless of soil potassium contents, promoted root mass development, while
the different application rates of potassium did not produce any response in root growth.
According to Taufatofua and Fukai (1996), nitrogen applications increased fibrous root
growth in sweet potatoes but had no effect on tuber yield. Related to the nitrogen
effect, cv Lole under both soil water regimes produced a greater fibrous root mass than
did cv Wanmun. The more abundant fibrous roots in cv Lole benefited the plants as an
adaptation mechanism for survival under restricted soil water supply.
4.3.3.2 Tuber yield
Tuber yield was significantly affected by the nutrient addition treatments and their
interactions (Tables 4.2 and A4: 11). The effect of nitrogen on tuber yield under well-
watered conditions was greater in cv Wanmun (870 g/plant) than in cv Lole (644
g/plant) when supplied with 100 kg of N/ha (Fig. 4.8). Under water stressed conditions,
however, the greater nitrogen supplies produced greater tuber yields. Tuber yield was
optimal (391 g/plant from cv Wanmun and 411 g/plant from cv Lole) at a nitrogen
application of 100 kg/ha (Fig. 4.8; Table A4: 33).
Under water stress conditions, tuber yields increased when potassium application rates
were increased, but the yields were much lower than those of the well watered plants
when grown in soils with the same level of potassium. Under such conditions, the
cultivars produced their greatest yields of tubers (Lole: 426 g/plant; Wanmun: 403
g/plant, respectively) with the application of 200 kg/ha of N and 160 kg of K per ha
(Fig. 4.8; Tables A: 33 and 34).
146

The effects of potassium on tuber yields were significant (Tables 4.2 and A4: 12). Non-
limiting water and moderate N applications (160 kg N per ha) produced the greatest
yields of 774 g/plant in cv Wanmun and 643 g/plant in cv Lole (Fig. 4.8, Table A: 33).
The tuber yields of cv Wanmun declined when the application rate of potassium was
reduced to 80 kg of K/ha (Fig. 4.8, Table A: 34). Increasing potassium rate to 80 and
160 kg K/ha increased the tuber yield in cv Lole to 647 g/plant, and 643 g/plant,
respectively (Fig. 4.8). Hence, 160 kg/ha of K is needed to ensure optimal tuber yields
from cv Wanmun.
444 444N =
Lole cultivar
Nitrogen (kg/ha)
20010020
Tube
r yie
ld (g
/pla
nt) 1000
800
600
400
200
0
Soil FC
30%
80%
444 444N =
Wanmun cultivar
Nitrogen (kg/ha)
20010020
Tube
r yie
ld (g
/pla
nt) 1000
800
600
400
200
0
Soil FC
30%
80%
444 444N =
Lole cultivar
Potassium (kg/ha)
1608016
Tube
r yie
ld (g
/pla
nt) 1000
800
600
400
200
0
Soil FC
30%
80%
444 444N =
Wanmun cultivar
Potassium (kg/ha)
1608016
Tube
r yie
ld (g
/pla
nt) 1000
800
600
400
200
0
Soil FC
30%
80%
Figure 4.8 The effects of nitrogen and potassium on tuber yields of Lole and Wanmun cultivars grown under 30% and 80% of soil field capacity. Error bars represent standard errors of means with 4 replications. (The nitrogen responses are shown for the non-limiting K trial, and the potassium responses for the non-limiting N trial).
147
These results show that, although there was a lack of response to potassium in root
development in both cultivars and a much smaller response in shoot growth, the
potassium content of the soil may limit tuber yield even when no effect is seen in vine
growth.
Greater nitrogen applications to infertile growing media promoted the growth of the
vegetative parts of the Lole and Wanmun cultivars. The lack of increase in tuber
production with soil nitrogen levels greater than 100 kg N/ha may be attributed to the
influence of nitrogen on tuber growth and development. Kelm et al. (2000) showed that
tuber initiation was delayed with high nitrogen supply in 2 sweet potato genotypes.
Hartemink et al. (2000) also found that nitrogen fertilizer negatively affected tuber yield
of sweet potato by promoting vine growth, as was evident in the present trial.
Taufatofua and Fukai (1996) reported faster sweet potato growth and greater tuber
yields by increasing the soil nitrogen content under irrigation. They also observed that,
in the absence of a nitrogen fertilizer, the yield of tubers was still high, but this was
associated with adequate supplies of soil nitrogen. Hence, the responses of sweet potato
to applications of nitrogen depend on the cultivar, soil type, and climatic conditions
(O’Sullivan et al., 1997).
A greater potassium supply promoted greater tuber yields in both cultivars under both
water regimes. This result agrees with that of Bourke (1985) who also found that
potassium fertilization up to a rate of 375 kg K/ha increased sweet potato tuber yields in
the Papua New Guinea highlands. Such a response may be attributed to the role of
potassium in starch synthesis, leading to tuber growth and development through the
148

accelerated translocation of photosynthates from leaves to tubers (Mukhopadhyay et al.,
1992). In Colocasia, an increase in both soil nitrogen and potassium contents increased
growth and tuber yields, due to the greater assimilate translocation and accumulation
rates of the plants grown in enhanced soils (Vasudevan et al., 1996). Similarly, George
et al. (2002) also reported that a yield increase in sweet potato as a result of potassium
application, was mainly due to an increase in storage root to shoot ratio, which led to a
greater amounts of photosynthetic translocation to the tuber. Higher contents of
potassium in the soil, according to Hahn (1977) prevented excessive leaf growth,
resulting in higher tuber yield. Wang et al. (1995) demonstrated that a decrease of stem
and leaf yields, and consequent reduced transpiration, was caused by the application of
potassium; the associated increase in overall yield of tubers was consistent with the
results of the present experiment where increased levels of soil potassium also reduced
the leaf area and increased tuber yields.
The nutrient levels required to produce optimal growth in the present study demonstrate
the necessity to apply balance doses of nitrogen and potassium to sweet potato plants. It
also demonstrates that the balance of nitrogen and potassium is important in
determining tuber yield in sweet potato. Reducing nitrogen inputs to levels below the
optimal level (100 kg N/ha) with the addition of potassium had no effect on tuber
yields. For this reason, an imbalance of nutrients between nitrogen and potassium
should be avoided. On the other hand, tuber yields under water stress conditions
increased under greater nitrogen and potassium supplies. This may be attributed to the
fact that nitrogen and potassium are essential plant nutrients, which are widely reported
for increasing osmotic adjustment of plant cells under drought conditions (Mortlock and
Fukai, 1998; Ashraf et al., 2001). Hence, a greater nitrogen supply balanced with a
149
greater potassium supply, produced greater tuber yields under water stress conditions.
However, the nutrient requirement may depend on the cultivar, soil type, and climatic
conditions (O’Sullivan et al., 1997; George et al., 2002).
4.3.4 Pigment contents
Total chlorophyll and carotene concentrations of the leaves of both cultivars were
significantly affected by all of the nitrogen and potassium treatments (Table 4.2).
However the chlorophyll a/b ratio was affected only by soil water contents, and not by
any of the other treatments (Tables 4.2, A4: 13-18, and A4: 35-36).
4.3.4.1 Total chlorophyll
Under well watered conditions, the total chlorophyll concentrations in the youngest
fully mature leaves of the Lole and Wanmun cultivars were 1.9 and 1.7 mg/g of fresh
leaf, respectively, which were significantly greater than the 1.4 and 1.3 mg/g of fresh
leaf, respectively, and were produced under water stressed conditions. The chlorophyll
concentrations of the leaves increased with greater soil nitrogen inputs, but responded
less strongly to potassium additions to the soil (Fig. 4.9). The greatest total chlorophyll
concentrations in Lole and Wanmun cultivar leaves (2.5 and 2.4 mg/g of fresh weight,
respectively) developed under the application of 200 kg N/ha (Fig. 4.9; Table A4: 13).
150

Lole cultivar
Nitrogen (kg/ha)
N200N100N20
Tota
l Chl
orop
hyll
(mg/
g fre
sh w
eigh
t)
4.0
3.5
3.0
2.5
2.0
1.5
1.0.5
Soil FC
30%
80%
Wanmun cultivar
Nitrogen (kg/ha)
N200N100N20
Tota
l chl
orop
hyll
(mg/
g fre
sh w
eigh
t)
4.0
3.5
3.0
2.5
2.0
1.5
1.0.5
Soil FC
30%
80%
Lole cultivar
Potassium (kg/ha)
K160K80K16
Tota
l chl
orop
hyll
(mg/
g fre
sh w
eigh
t)
4.0
3.5
3.0
2.5
2.0
1.5
1.0.5
Soil FC
30%
80%
Wanmun cultivar
Potassium (kg/ha)
K160K80K16
Tota
l chl
orop
hyll
(mg/
g fre
sh w
eigh
t)
4.0
3.5
3.0
2.5
2.0
1.5
1.0.5
Soil FC
30%
80%
Figure 4.9 The effects of nitrogen and potassium applications to the soil on the total chlorophyll concentration of the leaves of Lole and Wanmun cultivars grown under 30% and 80% of soil field capacity. Error bars represent standard errors of means with 4 replications. (The nitrogen responses are shown for the non-limiting K trial, and the potassium responses for the non-limiting N trial). From the results of the present study, it is suggested that water deficits and nitrogen
inputs consistently reduced the total chlorophyll concentrations of the leaves of both
cultivars (Fig. 4.9). The symptoms of chlorophyll reduction could be easily observed
from the colours of the leaves. Under nitrogen stress, leaves and petioles turned to
yellowish or reddish purple and the symptoms were most severe in the leaves of cv
Wanmun (Fig. 4.10). One of the visual symptoms of nitrogen deficiency is the
yellowing of the leaves (particularly the older leaves) due to the loss of protein nitrogen
from the chloroplasts and hence lower amounts of chlorophyll in the leaves. Under soil
nitrogen deficiencies in sugar beet, the decrease in chlorophyll concentration was found
151

to reduce photosynthetic rates (Draycott, 1993), and therefore to reduce overall growth.
A similar response was observed in the present experiment in sweet potatoes grown
under nitrogen stress.
Wanmun Lole
Figure 4.10 Leaves of Lole cultivar (left) and Wanmun cultivar (right) affected by low nitrogen supply.
The potassium content of the soil was also found to affect the total chlorophyll
concentrations in the leaves of both cultivars (Fig. 4.10; Table A4: 14). They were
relatively high in plants grown under well watered conditions where increasing
potassium levels increased the total chlorophyll concentration; they were greatest in cv
Lole (2.9 mg/g fresh weight) than in cv Wanmun (2.7 mg/g fresh weight) in the plants
supplied with 200 kg N / ha (Fig. 4.10; Table A4: 35). Under water stress conditions,
the highest potassium inputs (160 kg K / ha) also produced high chlorophyll
concentrations in the leaves of both cultivars, and their total chlorophyll contents
declined as the potassium supply decreased (Fig. 4.10; Table A4: 36). These results
conform with the findings of Ashraf et al. (2001) that chlorophyll a and b in certain
lines of pearl millet increased with an increasing soil potassium supply.
152

4.3.4.2 Carotene
The effects of soil nitrogen and potassium contents on the carotene concentrations in the
leaves of both cultivars grown under different soil water contents were statistically
significant; most of the interaction effects were also significant (Table 4.2).
Lole cultivar
Nitrogen (kg/ha)
20010020Car
oten
e (m
g/g
fresh
wei
ght)
.7
.6
.5
.4
.3
.2
.1
Soil FC
30%
80%
Wanmun cultivar
Nitrogen (kg/ha)
20010020Car
oten
e (m
g/g
fresh
wei
ght)
.7
.6
.5
.4
.3
.2
.1
Soil FC
30%
80%
Lole cultivar
Potassium (kg/ha)
1608016Car
oten
e (m
g/g
fresh
wei
ght)
.7
.6
.5
.4
.3
Soil FC
30%
80%
Wanmun cultivar
Potassium (kg/ha)
1608016Car
oten
e (m
g/g
fresh
wei
ght)
.7
.6
.5
.4
.3
Soil FC
30%
80%
Figure 4.11 The effects of nitrogen and potassium on the carotene concentrations of leaves of the Lole and Wanmun cultivars grown under 30% and 80% of soil field capacity. Error bars represent standard errors of means with 4 replications. (The nitrogen responses are shown for the non-limiting K trial, and the potassium responses for the non-limiting N trial).
When the soil water content was reduced from 80% to 30% soil field capacity, the
carotene concentration declined in the leaves of both cultivars (Fig. 4.11). Higher soil
nitrogen supplies produced significantly greater carotene concentration in the leaves
153

under both water contents (Fig. 4.11; Tables A4: 15, A4: 35). The highest nitrogen
fertilizer input (200 kg N / ha) produced the greatest carotene concentration in the
leaves of cultivars Lole and Wanmun (0.61 and 0.58 mg/g of fresh leaf, respectively)
under well watered conditions, and 0.46 and 0.45 mg/g of fresh leaf, respectively, under
water stress and the same nitrogen input. Low nitrogen inputs (20 kg N / ha)
significantly depressed carotene production by cvv Lole and Wanmun under water
stress (0.16 and 0.13 mg/g of fresh leaf, respectively), even when the soil water was not
limiting (0.25 and 0.21 mg/g of fresh leaf, respectively).
The effect of potassium additions on the carotene concentration of plant leaves was
statistically significant (Fig. 4.11; Table A4: 16). Both cultivars produced their highest
carotene concentrations (0.61 and 5.79 mg/g of fresh leaf in the Lole and Wanmun
cultivars, respectively) when water, nitrogen, and potassium supplies were not limiting.
A similar trend was evident in the leaves of the plants grown under water stress
conditions in which increased soil potassium contents promoted greater carotene
production in the plant leaves, but they never achieved the carotene contents of the well
watered plants (Fig. 4.11).
The results of the present study show that total chlorophyll and carotene concentrations
of both cultivars responded similarly to the application of nutrients under both soil
water regimes. The Lole cultivar consistently produced higher plant pigment contents
than did cv Wanmun under water stress, strongly suggesting that the former is well
adapted to growth under drought conditions. Similar results were obtained by Kelm et
al. (2000) who observed that a Tanzanian genotype of sweet potato (the cultivar name
was not given) characterized as water stress tolerant, also had high chlorophyll
154

concentrations in its leaves. In addition, George et al. (2002) revealed that carotene and
anthocyanin contents of sweet potato increased as a result of increased potassium
applications to the soil, and that the rate of increase varied with genotype. However it
should be noted that, as the different potassium rates did not strongly impact on vine
and leaf growth over the growing period, but there was a strong effect of potassium on
the leaf pigment content. This suggests that, by the time that the pigment analyses were
performed (5 months after planting), the potassium supply had run low and was limiting
growth in the soils that had received the lighter K treatments. It is suggested that leaf
analysis at such a growth stage does not necessarily reflect limitations to photosynthesis
over the whole growing period, because it cannot be assumed that any such differences
were present throughout the whole experiment.
4.3.4.3 Chlorophyll a/b ratio
There was no significant effect of nitrogen supply on the chlorophyll a/b ratio in plant
leaves, nor were there significant differences between cultivars (Fig. 4.12; Tables A4:
17, A4: 35).
155

Lole cultivar
Nitrogen (kg/ha)
20010020
Chl
orop
hyll
a/b
ratio
5.0
4.8
4.6
4.4
4.2
4.0
Soil FC
30%
80%
Wanmun cultivar
Nitrogen (kg/ha)
20010020
Chl
orop
hyll
a/b
ratio
5.0
4.8
4.6
4.4
4.2
4.0
Soil FC
30%
80%
Lole cultivar
Potassium (kg/ha)
1608016
Chl
orop
hyll
a/b
ratio
5.0
4.8
4.6
4.4
4.2
4.0
Soil FC
30%
80%
Wanmun cultivar
Potassium (kg/ha)
1608016
Chl
orop
hyll
a/b
ratio
5.0
4.8
4.6
4.4
4.2
4.0
Soil FC
30%
80%
Figure 4.12 The effects of nitrogen and potassium on the chlorophyll a/b ratio in leaves of Lole and Wanmun cultivars grown under 30% and 80% of soil field capacity. Error bars represent standard errors of means with 4 replications. (The nitrogen responses are shown for the non-limiting K trial, and the potassium responses for the non-limiting N trial).
That the chlorophyll a/b ratio was not significant in the present trial is attributed to
the time of sample collection; all of the leaf results presented in previous sections of
this thesis had been collected at 2 and 3 months after planting when the vegetative
growth was still active. In the present trial, however, the leaf samples were collected
a week before harvesting which was 5 months after planting, and there may have
been considerable pigment breakdown in the mature leaves. This explanation is
consistent with the findings of Mukhopadhyay et al. (1999) who found that the
concentration of leaf N in sweet potato was at a maximum during the primary
vegetative stage (2 months after planting) and declined gradually towards plant
156

maturity as the pigment concentrations declined, thereby affecting the chlorophyll
a/b ratio of the leaves.
Changing leaf colour from green to yellow indicated the breakdown of chlorophyll
at maturity. Atwell et al. (1999) found that the common pattern of leaf yellowing
varied with nitrogen supply: pale colours developed first in the older leaves of N-
deficient plants, and they extended to the younger leaves as the nitrogen deficiency
intensified. Although leaf sampling at the harvest stage of the present experiment
collected only the youngest fully expanded leaves, it is possible that a loss of
chlorophyll may have occurred in the older leaves as a consequence of nutrient
translocation into the tubers at this late stage of growth.
The chlorophyll a/b ratios of the present study showed a small, but not statistically
significant trend toward higher values under lower soil nitrogen supplies, possibly
suggesting that nitrogen deficiency may have had an influence chlorophyll
synthesis.
In the potassium experiment, the effect of potassium on the chlorophyll a/b ratio
was not significant, however there was a significant effect of soil water contents in
the present experiment where plants were grown under water stress treatments
showed statistically greater chlorophyll a/b ratios than did those of the well watered
treatments (Fig. 4.12; Tables A4: 18, A4: 36). It is possible that chlorophyll
synthesis was affected under low potassium supply, indicating that the whole
photosynthesis process may also have been affected. This result agrees with that of
Sen Gupta et al. (1989), who found that photosynthesis was much less inhibited
157

under drought conditions when sweet potato plants were given an enhanced
potassium supply. Similar results were obtained by Ashraf et al. (2001) who showed
increased chlorophyll a and b concentrations in pearl millet grown under a greater
potassium supply and watering regimes that did not affect chlorophyll a/b ratio. In
earlier studies, the chlorophyll a/b ratio in maize and alfalfa leaves was shown to
increase under water stress (Alberte and Thornber, 1977; Estill et al., 1991).
Despite no significant effect of potassium on the chlorophyll a/b ratio in the present
trial, water stress was found to produce a significant, slight increase in the
chlorophyll a/b ratio in the leaves of both sweet potato cultivars studied.
4.3.5 Plant water relations
4.3.5.1 Daily transpiration
Daily transpiration losses, recorded as pot mass losses (Section A1. 3.4) throughout
both nutrient trials from 1 to 5 months after planting, showed that the transpiration
rates of both cultivars were affected by most of the treatments applied (Table 4.3).
An interaction effect was also statistically significant, apart from the effects of
potassium 1 month after planting and nitrogen 3 months after planting, suggesting
that the responses of the cultivars to the soil water content and nutrient supply were
similar (Tables 4.3, A4: 19-28, A4: 37-38).
158
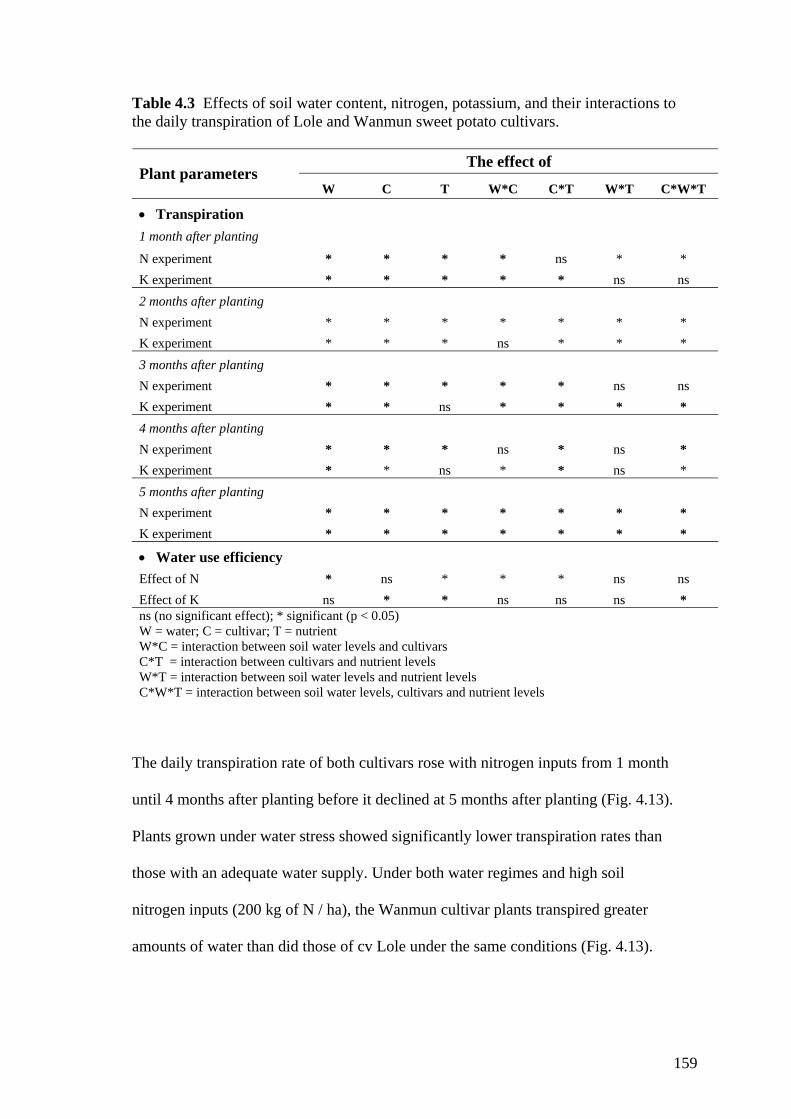
Table 4.3 Effects of soil water content, nitrogen, potassium, and their interactions to the daily transpiration of Lole and Wanmun sweet potato cultivars.
The effect of Plant parameters
W C T W*C C*T W*T C*W*T
• Transpiration 1 month after planting N experiment * * * * ns * * K experiment * * * * * ns ns 2 months after planting N experiment * * * * * * * K experiment * * * ns * * * 3 months after planting N experiment * * * * * ns ns K experiment * * ns * * * * 4 months after planting N experiment * * * ns * ns * K experiment * * ns * * ns * 5 months after planting N experiment * * * * * * * K experiment * * * * * * *
• Water use efficiency
Effect of N * ns * * * ns ns Effect of K ns * * ns ns ns * ns (no significant effect); * significant (p < 0.05) W = water; C = cultivar; T = nutrient W*C = interaction between soil water levels and cultivars C*T = interaction between cultivars and nutrient levels W*T = interaction between soil water levels and nutrient levels C*W*T = interaction between soil water levels, cultivars and nutrient levels
The daily transpiration rate of both cultivars rose with nitrogen inputs from 1 month
until 4 months after planting before it declined at 5 months after planting (Fig. 4.13).
Plants grown under water stress showed significantly lower transpiration rates than
those with an adequate water supply. Under both water regimes and high soil
nitrogen inputs (200 kg of N / ha), the Wanmun cultivar plants transpired greater
amounts of water than did those of cv Lole under the same conditions (Fig. 4.13).
159

Lole cultivar 1 month after planting
0
100
200
300
400
500
20 100 200Nitrogen (kg/ha)
Tran
spira
tion
(ml/p
lant
/day
)
30%80%
Wanmun cultivar 1 month after planting
0
100
200
300
400
500
20 100 200Nitrogen (kg/ha)
Tran
spira
tion
(ml/p
lant
/day
)
30%80%
Lole cultivar1 month after planting
0
100
200
300
400
500
16 80 160Potassium (kg/ha)
Tran
spira
tion
(ml/p
lant
/day
)
30%80%
Wanmun cultivar 1 month after planting
0
100
200
300
400
500
16 80 160Potassium (kg/ha)
Tran
spira
tion
(ml/p
lant
/day
)
30%80%
Lole cultivar 5 months after planting
0
100
200
300
400
500
600
700
16 80 160Potassium (kg/ha)
Tran
spira
tion
(ml/p
lant
/day
)
30%80%
Wanmun cultivar 5 months after planting
0
100
200
300
400
500
600
700
16 80 160Potassium (kg/ha)
Tran
spira
tion
(ml/p
lant
/day
)
30%80%
Lole cultivar 5 months after planting
0
100
200
300
400
500
600
700
20 100 200
Nitrogen (kg/ha)
Tran
spira
tion
(ml/p
lant
/day
)
30%80%
Wanmun cultivar 5 months after planting
0
100
200
300
400
500
600
700
20 100 200Nitrogen (kg/ha)
Tran
spira
tion
(ml/p
lant
/day
)
30%80%
Figure 4.13 Effects of nitrogen (20, 100, and 200 kg of N / ha) and potassium (16, 80, and 160 kg of K / ha) applications on the average daily transpiration of Lole and Wanmun cultivars grown under 30% and 80% of the soil field capacity, at 1and 5 months after planting. Monthly transpiration data are shown in the Appendix (Fig. A4:1).
160
There was a rapid increase in the transpiration per plant of both cultivars between
1 month and 3 months after planting, particularly in those grown under 80% of the
soil field capacity, but only a gradual increase in the plants grown under 30% of the
soil field capacity (Figures A4.1; Tables A4: 37 and 38). The rate of average daily
transpiration per plant was steady for 4 months after planting, then showed a slight
decrease between months 4 and 5 as leaf area declined with tuber development
(Sections 2.3.2.2.1, 3.5.3.1, and 5.5.6.3).
The effect of potassium on the mean daily transpiration was also significant; the
interactions between the main effects were mostly significant, apart from the main
effect interaction recorded at 3 months after planting (Fig. 4.13; Table 4.3).
Potassium had less effect than nitrogen on mean daily transpiration of both cultivars
grown under both water regimes (Fig. 4.13; Table A4: 19–28).
The dramatic transpiration increase in both cultivars with the higher rates of nitrogen
fertilizer matched the concomitant increase on dry matter production discussed above
(Section 4.3.2.1). Active vegetative growth and tuber initiation was associated with the
transpiration of large amounts of water as a consequence of greater water extraction
from the soil, and biomass production in the vegetative parts of the plant, particularly in
leaf area. The decrease in transpiration rate as the plants approached maturity is
attributed to the decline in vegetative growth and reduction in leaf area with the age of
the sweet potato vines (Section 3.5.2); it was also coincident with lower temperatures
occurring during the winter season (Fig. 4.1). All of the plants grown under water stress
transpired less water as a consequence of their reduced leaf areas (Fig. 4.13).
161

The plants supplied with low nitrogen transpired less water than the plants grown
with a greater nitrogen supply, regardless of soil water regimes (Fig. 4.13). It is
widely known that adequate nitrogen is required for optimal plant growth, and the
present nutrition trials showed that greater nitrogen supplies promoted vegetative
growth increased leaf area in both cultivars of sweet potato, and was associated with
greater leaf transpiration. In addition, greater potassium levels not only promoted
tuber yields but also have been reported to enhance water use efficiency in some
legumes by controlling soil moisture uptake (Sangakkara et al., 2000). Greater
potassium supply was therefore expected to promote sweet potato growth under low
soil water regimes.
The present study showed that the plants grown in the soils with the greater
potassium supplies transpired less water than those grown under the lower
potassium supply, particularly during the early vegetative stage and rapid tuber
bulking stage (Fig. 4.13). The lower amount of water transpired under the higher
potassium supplies was attributed to the reduction of leaf area and the development
of tubers at these critical stages. Potassium is widely reported to have enhanced
plant growth by increasing osmotic adjustments under low soil water regimes,
strongly promoting sink capacity for photosynthates in storage organs, and is
associated with depressed leaf growth in sweet potato (Hahn, 1977).
Therefore, a good balance of nitrogen and potassium is needed for optimal growth
of sweet potato. Nitrogen applications without potassium promoted shoot growth;
but low soil nitrogen supplies suppressed overall plant growth. Nitrogen
applications with low soil potassium contents depressed tuber development and
162

increased transpiration as a consequence of the larger leaf area produced. This can
all be explained by the fact that nitrogen influenced the yield of tubers by increasing
leaf area, which in turn increased photosynthesis, and resulted in enhanced tuber
weight. On the other hand, potassium influenced tuber yield by increasing the
proportion of dry matter diverted to tuber development, and producing greater tuber
numbers per plant (Bourke, 1985).
4.3.5.2 Water use efficiency
Soil water regimes and nutrient levels produced statistically significant effects on
water use efficiency of both sweet potato cultivars; their interactions were mostly
significant showing that the responses to the treatments were similar (Table 4.3).
Water use efficiency is the ratio of dry matter produced (g of total dry biomass) to
the amount of water used in transpiration (kg of water applied /plant) during the
whole growth period. There were statistically significant differences between the
water use efficiency responses of the plants grown under different nitrogen and
potassium fertilizer inputs (Figure 4.14, Tables A4: 29-30, A4: 37-38). The Lole
cultivar had significantly greater water use efficiency than cv Wanmun at each
corresponding fertilizer input level. The greatest water use efficiency of cv Lole was
obtained under the supply of 100 kg N / ha which was not statistically different from
its water use efficiency under 200 kg N / ha for both cultivars under both water
regimes, and it was driven by lower dry matter production. The water use efficiency
of both cultivars was significantly greater under the low soil water treatments in the
nitrogen experiment and, although not significantly significant, tended to be higher
in low soil water treatments in the potassium experiment (Fig. 4.14).
163

444 444N =
Lole cultivar
Nitrogen (kg/ha)
20010020
WU
E (g
/kg
H2O
)
4.0
3.5
3.0
2.5
2.0
1.51.0
Soil FC
30%
80%
444 444N =
Wanmun cultivar
Nitrogen (kg/ha)
20010020
WU
E (g
/kg
of H
2O)
4.0
3.5
3.0
2.5
2.0
1.51.0
Soil FC
30%
80%
444 444N =
Lole cultivar
Potassium (kg/ha)
1608016
WU
E (g
/kg
of H
2O)
4.0
3.5
3.0
2.5
2.0
1.51.0
Soil FC
30%
80%
444 444N =
Wanmun cultivar
Potassium (kg/ha)
1608016
WU
E (g
/kg
of H
2O)
4.0
3.5
3.0
2.5
2.0
1.51.0
Soil FC
30%
80%
Figure 4.14 Effects of nitrogen and potassium inputs on the water use efficiency (WUE) of Lole and Wanmun cultivars grown under 30 and 80% of the soil field capacity (Soil FC).
The lowest water use efficiency was produced by plants growing under low nutrient
inputs (Fig. 4.14), and was a consequence of poor growth and low transpiration
rates.
Plant water use efficiency increased as the potassium supply also increased (Fig.
4.14; Table A4: 38). Under well-watered conditions, plant growth under the addition
of 160 kg K per ha produced high water use efficiency in both cultivars (Fig. 4.14).
This suggests that potassium has a beneficial effect in improving water use
efficiency in sweet potatoes. Similarly the water use efficiency increased under
164

water stress conditions when greater amounts of potassium were supplied to both
cultivars (Fig. 4.14).
The overall effect of nitrogen and potassium soil nutrients on water use efficiency
showed that optimal soil nitrogen contents (100 kg N/ha), with high potassium
applications (160 kg K/ha), increased water use efficiency in both cultivars under
both soil water regimes. Potassium at this rate particularly contributed to improved
water use efficiency under water stress conditions.
4.4 CONCLUSIONS
The supply of nitrogen and potassium fertilizers at 100 kg N / ha and 160 kg K / ha
produced the highest tuber yields under both well watered and water stressed
conditions. A higher nitrogen supply in the soil produced greater shoot mass, leaf mass,
leaf area, and specific leaf weight, but increasing soil nitrogen availability beyond 100
kg N / ha reduced tuber yields. This suggests that the amount of nitrogen is important in
regulating the balance between vegetative and tuber growth.
The lack of nitrogen, on the other hand, resulted in stunted growth and affected the
overall plant growth and tuber yield. It also resulted in lower chlorophyll production
that affected the overall photosynthetic process and plant metabolism. Greater
potassium availability enhanced tuber yields when the soil was also supplied with basal
amounts of the other plant nutrients; the potassium applications increased tuber yield
but did not enhance growth of the vegetative parts of the sweet potato.
165

Low nitrogen and potassium supplies in the soil reduced plant growth and yields that
are both characteristics of poor water use efficiency. The significance of greater water
use efficiency of cv Lole under water stressed conditions was attributed to its relatively
low transpiration rates.
The Wanmun cultivar consistently produced a greater mass of tubers than cv Lole under
well watered conditions. When the soil water content was restricted, however, cv Lole
supplied with 100 kg N / ha and 160 kg K / ha produced its greatest tuber mass.
The sweet potato cultivars Lole and Wanmun, grown under 30% of the soil field
capacity, consistently produced stunted plants and low tuber yields. The extent of the
reduction of growth and yields varied between the drought tolerant Lole and drought
sensitive Wanmun cultivars. The growth and yields of cv Lole were less affected by
water stress than were those of cv Wanmun. Despite cv Wanmun produced greater dry
shoot mass and tuber yield, cv Lole produced greater dry root mass and more fibrous
roots. The latter is associated with mechanisms for drought adaptation under field
conditions (O’Toole and Chang, 1979, Holwerda and Ekanayake, 1991), while greater
shoot mass in cv Wanmun resulted in greater transpiration per plant (Kirnak et al.,
2001, Saraswati et al., 2004). However under water stress conditions, cv Wanmun
produced lower tuber yields than did cv Lole.
The mean rate of daily transpiration was higher in the well watered plants than in those
under water stress. The Wanmun cultivar sustained significantly greater transpiration
than cv Lole, and the highest transpiration rates coincided with the combination of a
high nitrogen and low potassium applications through their influence on leaf growth and
166

leaf area development. A low nitrogen supply with high potassium applications, on the
other hand, resulted in lower transpiration rates and low tuber yields because of an
overall reduction in growth.
Thus, the use of 100 kg N / ha and 160 kg K / ha, applied as ammonium nitrate and
potassium chloride respectively, was found to be the best combination of nutrients to
sustain sweet potato growth under well watered and water stressed conditions
encountered in the present experiment.
167

CHAPTER 5
GRAFTING TO IMPROVE WATER USE EFFICIENCY IN SWEET POTATO GENOTYPES
5.1 INTRODUCTION Drought is a serious constraint to agricultural production; even in normally well watered
regions, occasional droughts have a devastating effect on local food production.
Drought tolerance is often a desirable trait or selection criterion in plant breeding
programs. Breeding for specific suboptimal environments (such as nutrient or water
deficits) involves a deep understanding of the yield-determining process (Blum et al.,
1983). Hence, an understanding of the morphological and physiological traits that
contribute to drought tolerance can greatly assist plant breeders.
Sweet potato is commonly propagated by vegetative methods, such as vine cuttings
rather than using tuber sprouts, to reduce the impact of soil borne diseases (Onwueme
and Charles, 1994). Sexual breeding strategies, on the other hand, have not been very
effective (Prakash, 1994), as incompatibility or sterility is common in the sweet potato
(Reynoso et al., 1997). Traditionally, farmers have selected seedlings from natural
(segregating) populations, for specific traits. Also the use of polycross seeds have been
used to a limited degree and still have potential for breeding programs.
Sexual breeding is long-term job requiring a lot of resources and has often been
unsuccessful for sweet potato. Grafting may offer a short term solution by combining
the desirable characteristics of different cultivars into one plant. If successful, the
168

grafted plants open up possibilities for enhanced sweet potato production in drought-
prone areas.
Grafting is an asexual propagation technique, which can be used to combine the
desirable characters of the root and vegetative parts of different plants. The grafting
method has been used in sweet potato to screen the yield potential and relative sink
strength (Kuo and Chen, 1992). However, there is a lack of information in relation to
the effect of grafting on transpiration, sink capacity, tuber production and water use
efficiency.
Various studies reported in the earlier chapters of this thesis indicated that the Wanmun
and Lole sweet potato cultivars differ in their responses to water stress. The Wanmun
cultivar produced higher tuber yields but was very susceptible to water stress, the Lole
cultivar, however, had a lower tuber yield but was more drought tolerant as a
consequence of its smaller leaf area, fewer stomata per leaf, higher leaf water potential,
and higher relative water content than cv Wanmun. Therefore, cv Lole offers more
efficient mechanisms for conserving water.
A grafting experiment was carried out in an attempt to obtain sweet potato plants that
embodied cv Lole’s tolerance to drought and cv Wanmun’s high tuber yields. The study
also examined the nature of the root and shoot factors influencing growth and yield
responses to water stress. The study was also aimed to at identifying the physiological
traits contributing to drought tolerance in cv Lole. The compatibility of grafted plants
and their growth and yield performance, anatomy, and physiology under water stress
conditions were also addressed.
169

5.2 EXPERIMENTAL MATERIALS AND METHODS
5.2.1 Experimental location
The experiments were carried out from 1 December 2003 to 30 April 2004, in a
shadehouse of the School of Marine and Tropical Biology, James Cook University,
Townsville.
5.2.2 Research preparation
Pots of 10 L volume without drainage holes were used to accommodate 11 kg of
growing medium similar to the sand used the nutrition trials (Chapter 4). It was a clean
coarse sand that had been washed to remove any soil components, passed through a 2
mm sieve, and air dried to a constant moisture content. The amount of water required to
bring the soil in the pots to field capacity was calculated using a gravimetric method
(Appendix A1.1).
The grafting technique used stem tips of about 25 cm length of Lole and Wanmun
cultivars that were grafted onto the rootstocks of Wanmun and Lole cultivars that had
been growing in the pots for 2 months at 80% of soil field capacity (Figs 5.1a, b). The
scions and rootstock were cut into keyhole shapes using a hand-operated Omega
Grafting Tool distributed by H.T.C. International Pty. Ltd., Victoria, Australia. The
grafted unions were covered with a 3 cm length of a plastic drinking straw and held in
place with parafilm. The grafted plants were kept humid by spraying them with water
regularly for a day, then were kept in a shaded area for one month until the graft union
was established and had healed. Very few of the grafts were unsuccessful.
170

C B A
Figure 5.1 Grafted sweet potato cultivars: (A) the grafted union between Lole rootstock and Wanmun scion one week after grafting; (B) Wanmun rootstock and Lole scion 4 weeks after grafting; (C) the grafted cuttings imbibing water for 2 days before planting.
One month after grafting, the tip-grafted shoots were cut from the parent plant at a point
15 cm below the graft union and 15 cm above the union. Cuttings from non-grafted
Lole and Wanmun cultivar stems were similarly prepared. The cuttings were kept in
water for 2 days until roots appeared from the nodes (Fig. 5.1c) and were then planted
into the pots containing the sandy growing medium 11 kg of sand and maintained at
80% of field capacity for 2 days. Water was then withheld until the pots reached the
desired treatment water content (30% or 80% of field capacity) after which they were
watered every second day to maintain the growing medium at those moisture contents
for the rest of the experimental period.
The amount of water applied in any one irrigation given was equal to the quantity lost
by evapotranspiration to maintain the targeted soil water contents. The pots and growing
media were covered with aluminium foil to reduce evaporative losses to a minimum.
Fertilizer requirements were supplied by adding Soluble Osmocote every second week
171

at a rate of 1 g/plant for the first three months. Additional potassium was given as 1 g of
potassium sulphate /plant at one week after planting (Appendix A1. 2).
In order to prevent sweet potato scab and insect pest damage, particularly red spider, the
plants were sprayed regularly with fungicide (Fungoride) 1 g/1 L of water, and with Red
Spider Miticide (Garden King brand: active constituent of 150 g/L Dicofol) at 5 mL of
insecticide / 1 L of water.
5.2.3 Experimental design
The experimental design included 4 types of planting materials and 2 soil water
treatments in a factorial design using 40 pots in a complete randomised design with 5
replications, as follows.
1. Planting materials, 4 levels:
a. Non-grafted cv Lole
b. Non-grafted cv Wanmun
c. Grafted: Lole rootstock and Wanmun scion
d. Grafted: Wanmun rootstock and Lole scion
2. Soil water, 2 levels:
a. 30% of soil field capacity
b. 80% of soil field capacity
3. Replicates: 5
An additional 64 pots were included to allow for destructive sampling (4
replications) at 1 and 2 months after planting.
172

5.3 EXPERIMENTAL VARIABLES
Observations were made on the following variables that are described in some detailed
in Appendix A1. 3.
5.3.1 Plant growth and tuber yields
Data on shoot biomass, leaf mass, leaf area, root mass, tuber mass, and tuber number
were collected. Shoot and root data were collected by destructive sampling at 1 and 2
months after planting. At the end of the experiment (5 months after planting), the plants
were harvested and the leaf and total shoot masses determined. Fibrous roots were
separated from the tubers and measured separately. These data were used to compute
specific leaf weight (mass), water use efficiency, and harvest index with 5 replications.
5.3.2 Water relations
Daily transpiration was recorded as daily pot mass changes from two weeks after
planting until one week before harvesting, and each measurement was replicated 5
times.
Leaf water potential was recorded at midday when water stress was at its maximum at 3
months after planting. A pressure chamber was used to measure the water potential of
three replicates of the youngest fully expanded leaves from each of the experimental
units.
Leaf relative water content was also measured at midday at 3 months after planting in
the youngest fully expanded leaf in 5 replications from each of the experimental units (5
leaves per treatment).
173

Water use efficiency was calculated as the ratio of the total dry biomass that
accumulated to the total mass of water used during the growing period.
5.3.3 Leaf pigment contents
The contents of photosynthetic pigments in the plant leaves (chlorophyll a, chlorophyll
b, total chlorophyll, the chlorophyll a/b ratio, and carotene) were determined using a
spectrophotometric method (Wintermans and De Mots, 1965).
5.3.4 Leaf anatomy
Leaf anatomy is strongly related to the gas exchange and loss of water from plants
(Hopkins, 1999). In an attempt to determine some of the mechanisms by which the
sweet potato copes with water stress, various leaf anatomy characteristics were
observed including stomatal density, the lengths of guard cells, and the thicknesses of
cuticle waxes. Leaf samples for anatomical study were collected at 4 months after
planting and were prepared for study in the Histology Laboratory of the School of
Marine and Tropical Biology, James Cook University, Townsville.
5.4 STATISTICAL ANALYSIS
Analyses of variance based on a factorial experiment in a complete randomised design
were conducted for all characters measured. The statistical significance of treatments or
combinations of main effects were determined using the Duncan Multiple Range Test at
the 95% probability level.
174

5.5 RESULTS AND DISCUSSION 5.5.1 Climatic conditions Daily minimum and maximum air temperatures, and relative humidity data for the
experimental period (December 2003 – April 2004) were obtained from the
Commonwealth of Australia, Bureau of Meteorology, Queensland (Figs 5.2 and 5.3).
Average minimum and maximum temperatures were relatively constant during the
summer wet season from December 2003 to February 2004. The temperature steadily
declined from the 2nd week of March and slightly increased in April 2004 (Fig. 5.2).
Relative humidity was also fairly constant between December 2003 and February 2004,
and after that it gradually declined. The lowest humidity was recorded between the first
week and the third week of April 2004 (Fig. 5.3).
175

0
5
10
15
20
25
30
35
40
1 2 3 4 5 1 2 3 4 5 1 2 3 4 1 2 3 4 5 1 2 3 4
December January February March April
Month and week
Tem
pera
ture
(oC
)
Maximum daily temperature
Minimum daily temperature
Figure 5.2 Weekly mean maximum and minimum air temperatures (oC), at Townsville Airport, from 1 December 2003 to 30 April 2004. Source: Commonwealth of Australia, Bureau of Meteorology, Queensland.
0
5
10
15
20
25
30
35
40
1 2 3 4 5 1 2 3 4 5 1 2 3 4 1 2 3 4 5 1 2 3 4
December January February March April
Month and week
Tem
pera
ture
(oC
)
Maximum daily temperature
Minimum daily temperature
Figure 5.3 Relative humidity of 09.00 am and 15.00 pm at Townsville area, from 1 December to 30 April 2004. Source: Commonwealth of Australia, Bureau of Meteorology, Queensland.
176

5.5.2 Success of grafting technique Lole scions grafted onto Wanmun rootstocks were very compatible as indicated by the
rapid healing and even formation of calluses at the graft union which was helped by the
good fit and the alignment between the grafted sections (Figures 5.4a). Because of its
bigger stem diameter, the Wanmun rootstock could easily hold the Lole scion, therefore,
the graft union was readily healed. Since the vascular tissues were connected and
aligned, the translocation of assimilates, and the flow of water and inorganic nutrients,
were not affected. It appeared that the metabolic function was not interrupted in such
grafted unions.
LR WR
WS LS
(b) (a)
Figure 5.4 The grafted unions of sweet potato cultivars: (a) a Lole scion (LS) and Wanmun rootstock (WR); (b) a Wanmun scion (WS) and Lole rootstock (LR). The arrow points to an area where the phloem of the scion is not well connected to the phloem of the rootstock.
On the other hand, the union of the Wanmun scion grafted onto Lole rootstock was not
as good which was a consequence of poor alignment of the stem parts, or lack of
mechanical strength in the Lole rootstock of small diameter to hold the Wanmun scion
with a large stem diameter (Figs 5.4b).
177

Figures 5.4b shows that the translocation of sap and its organic contents is disrupted
through the grafted union, and this occurred in all such cases where the larger diameter
of the Wanmun scion was not strongly connected or attached to the cv Lole rootstock.
Andrews and Marquez (1999) suggested that internal symptoms of grafting
incompatibility precedes the external symptoms, and the phloem tissues may be more
severely affected than xylem tissues. Because the phloem tissue of scion was not well
connected to that of the rootstock, the metabolic function of the plant, including
transport from the leaves, was interrupted. On the other hand, some of the xylem tissue
that translocate water from the root to the leaves was attached across the grafted union.
Therefore, some water and nutrient from the roots were able to reach the leaves, and the
plant was still able to grow (Hopkins, 1999), despite its ability to translocate
photosynthates produced in the leaves through the phloem vessels into the roots being
severely impaired.
5.5.3 Plant growth characters
The effects of experimental factors (water contents and the grafted treatments) on fresh
and dry shoot biomass, leaf mass and area, fresh and dry root masses, and tuber
components are summarised in Table 5.1.
Water stress had a significant effect on the growth of both the grafted and non-grafted
sweet potato cultivars (Table 5.1). The interactions between soil water contents and the
sweet potato planting materials were significant for most of the variables, apart from the
fresh and dry leaf masses at 2 months after planting. This suggests that the response of
the plant combinations to the water stress was not similar.
178

Table 5.1 Effects of soil water contents and their interactions on the growth of Lole and Wanmun, Lole grafted onto Wanmun and Wanmun grafted onto Lole at 1, 2, and 5 months after planting.
Significance Plant parameters
Water contents Planting material Interaction
Time of measurement (months after planting) 1 2 5 1 2 5 1 2 5
Fresh shoot mass * * * * * * * * * Dry shoot mass * * * * * * * * * Leaf fresh mass * * * * * * * ns * Leaf dry mass * * * * * * * ns * Leaf area na na * na na * na na * Specific leaf mass na na * na na * na na * Root fresh mass * * * * * * * * * Root dry mass * * * * * * * * * Tuber mass per plant na na * na na * na na * Tuber number na na * na na * na na * Average mass of tuber na na * na na * na na * Harvest index na na * na na * na na ns ns (no significant effect); * the main effect or interaction of soil water by type of planting material are significant (p < 0.05); na: not available
5.5.3.1 Fresh and dry shoot mass Table 5.2 shows the shoot biomass of non-grafted and grafted sweet potato plants
grown under two water contents (30% and 80% soil field capacity). Shoot biomass was
affected by soil water regimes, planting material type, and their interactions, recorded
from the early plant development (1 month after planting) until harvest stage (5 months
after planting) (Tables 5.2 and A5: 1 – 6).
179

Table 5.2 Effects of soil water content (30 and 80% soil field capacity) on the fresh and dry shoot mass of grafted and non-grafted sweet potato plants sampled at 1, 2, and 5 months after planting. Number of replicates for each treatment = 5.
Fresh and dry shoot mass (g/plant) after the indicated number of months since planting
Fresh shoot mass (g/plant) Dry shoot mass (g/plant)
Months after planting 1 2 5 1 2 5
Soil water content 30% field capacity 66.2b 172.3b 235.5b 9.6b 23.6b 12.1b 80% field capacity 105.8a 279.1a 387.2a 17.5a 40.6a 19.4a Planting material Lole (L) 83.8d 222.0e 250.0e 12.5f 31.4e 12.6e Wanmun (W) 102.2c 251.7c 329.2d 16.7d 35.5c 18.3d L-W 81.6be 171.8d 208.3f 13.6e 22.8d 11.9e W-L 76.5e 257.2c 457.8c 11.3c 38.6c 20.2c Interactions 30% x Lole 68.6 178.0 213.2 9.4 23.7 8.9 30% x Wanmun 72.6 187.6 240.0 11.0 26.7 15.7 30% x L-W 64.5 135.6 159.8 9.8 16.7 7.9 30% xW-L 59.1 188.0 329.0 8.0 27.3 15.7 80% x Lole 98.9 266.0 286.8 15.7 39.1 16.3 80% x Wanmun 131.8 315.8 418.4 22.3 44.3 20.8 80% x L-W 98.7 208.0 256.8 17.3 28.9 15.9 80% x W-L 93.8 326.4 586.6 14.5 49.9 24.6
Values within a column followed by the same letter symbol were not significantly different (p < 0.05). All the interactions of soil water content by type of planting material were significant (p < 0.05). L-W= Lole scion and Wanmun rootstock; W-L= Wanmun scion and Lole rootstock.
Shoot growth of both the grafted and non-grafted plants declined under water stress.
Although the non-grafted Wanmun cultivar and the Wanmun scion grafted onto Lole
rootstock produced greater shoot biomass, they showed the greatest decline in
production under water stress (40%), compared to that of the non-grafted Lole cultivar
and the Lole scion on the Wanmun rootstock, which had a 30% decline in shoot
biomass in the water-stressed plants (Table 5.2). The Wanmun scion on Lole rootstock
started shoot growth more slowly during the early growth phases than did either the
non-grafted plants or those with a cv Lole scion. However, as the experiment
180

progressed, the biomass of the Wanmun scions grafted onto Lole rootstocks increased
greatly. They showed biomass production characters intermediate between those of their
mother plants (Table 5.2).
5.5.3.2 Fresh and dry leaf mass
Fresh and dry leaf mass was significantly affected by water stress in both cultivars and
their grafted combinations (Tables 5.3 and A5: 7-8). The interactions between the main
effects were significant.
Fresh and dry leaf mass declined under the imposed water stress, and the greatest
decline was evident in the Wanmun cultivar and in the Wanmun scion grafted onto Lole
rootstock. The reduction of leaf dry mass followed the same order as the reduction of
leaf fresh mass: non-grafted cv Wanmun and the Wanmun scion (46% and 45%,
respectively), followed by non-grafted cv Lole and the Lole scion (39% and 29%,
respectively). It has been shown above that reduced leaf mass under water stress was
associated with the reduction of leaf area and total leaf number (Chapters 2 and 3). It
was in accord with the common response to water deficit (Ludlow and Muchow, 1990),
of leaf growth reduction and increased senescence.
181
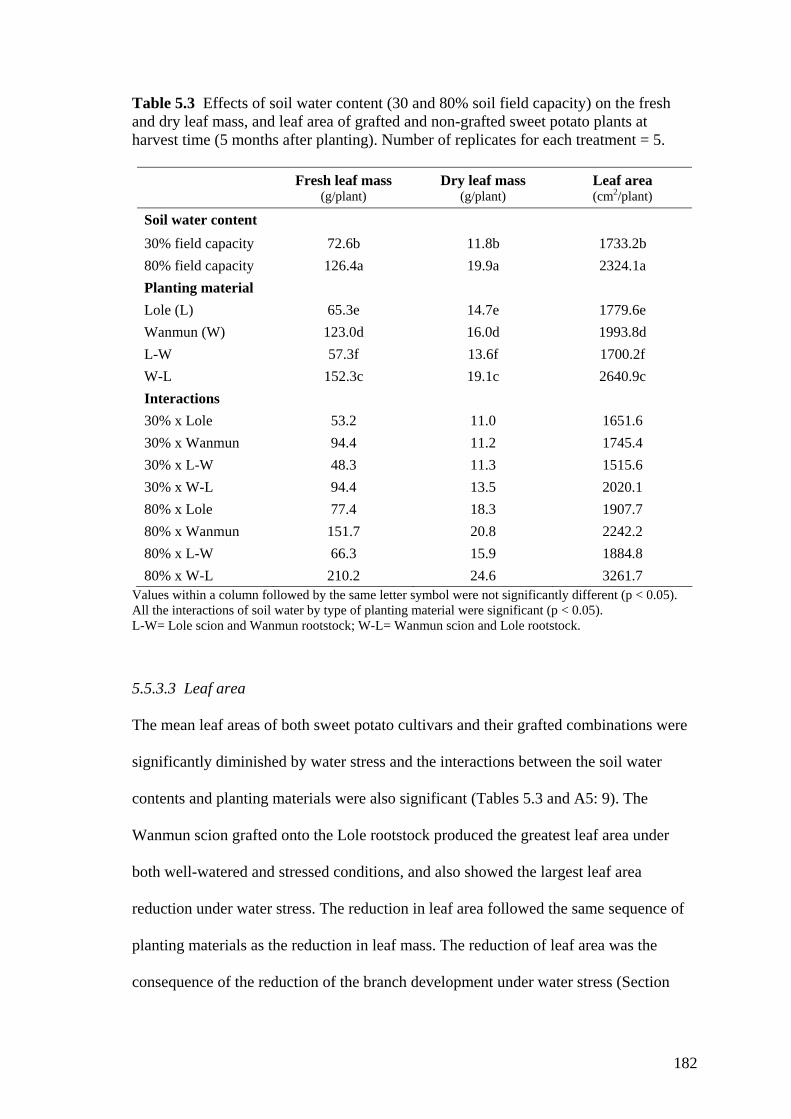
Table 5.3 Effects of soil water content (30 and 80% soil field capacity) on the fresh and dry leaf mass, and leaf area of grafted and non-grafted sweet potato plants at harvest time (5 months after planting). Number of replicates for each treatment = 5.
Fresh leaf mass (g/plant)
Dry leaf mass (g/plant)
Leaf area (cm2/plant)
Soil water content 30% field capacity 72.6b 11.8b 1733.2b 80% field capacity 126.4a 19.9a 2324.1a Planting material Lole (L) 65.3e 14.7e 1779.6e Wanmun (W) 123.0d 16.0d 1993.8d L-W 57.3f 13.6f 1700.2f W-L 152.3c 19.1c 2640.9c Interactions 30% x Lole 53.2 11.0 1651.6 30% x Wanmun 94.4 11.2 1745.4 30% x L-W 48.3 11.3 1515.6 30% x W-L 94.4 13.5 2020.1 80% x Lole 77.4 18.3 1907.7 80% x Wanmun 151.7 20.8 2242.2 80% x L-W 66.3 15.9 1884.8 80% x W-L 210.2 24.6 3261.7
Values within a column followed by the same letter symbol were not significantly different (p < 0.05). All the interactions of soil water by type of planting material were significant (p < 0.05). L-W= Lole scion and Wanmun rootstock; W-L= Wanmun scion and Lole rootstock.
5.5.3.3 Leaf area
The mean leaf areas of both sweet potato cultivars and their grafted combinations were
significantly diminished by water stress and the interactions between the soil water
contents and planting materials were also significant (Tables 5.3 and A5: 9). The
Wanmun scion grafted onto the Lole rootstock produced the greatest leaf area under
both well-watered and stressed conditions, and also showed the largest leaf area
reduction under water stress. The reduction in leaf area followed the same sequence of
planting materials as the reduction in leaf mass. The reduction of leaf area was the
consequence of the reduction of the branch development under water stress (Section
182
3.5.2.2). However, the graft with large source capacity in terms of leaf area and mass
(i.e. Wanmun scion on Lole rootstock) produced the greatest leaf area.
Leaf area is an important trait in contributing to yield since any reduction in leaf area
will affect photosynthesis, and therefore tuber yields. Reduced leaf area tends to
enhance survival under water stress; however, it can be detrimental to productivity if the
leaf area index (the area of leaves per unit area of land) falls below a value of 3 (Ludlow
and Muchow, 1990). An excessively large leaf area index can also reduce yield if there
is strong shading of the lower leaves (Ravi and Indira, 1999). If sweet potato plants
have access to large supplies of soil nitrogen, their growth often becomes vegetative and
very little carbon or energy is transported to the roots; consequently, tuber yield can be
greatly reduced. Hence, a balance is needed to produce enough leaf area to give a
maximum photosynthesis and at the same time trigger the plant to develop a strong sink
for the carbohydrate in the tubers. Unlike cereal crops, there is no direct relationship
between leaf area (or leaf area index) and tuber yield in sweet potato which complicates
interpretations and makes yield prediction difficult, especially as the relationship
between leaf area and yield varies considerably among cultivars.
5.5.3.4 Specific leaf weight
Specific leaf weight (mass) was significantly different between the plants grown under
different soil water contents, between the parent sweet potato cultivars and their grafted
combinations, and their interactions (Fig. 5.5; Table A5: 10).
183

Cultivar/grafting combination
W-LL-WWanmunLole
Spe
cific
leaf
wei
ght (
mg/
cm2)
11
10
9
8
7
6
5
Soil FC
30%
80%
Figure 5.5 Specific leaf weight mass of Lole, Wanmun, Lole scion grafted onto Wanmun rootstock, and Wanmun scion grafted onto Lole rootstock under 30 and 80% soil field capacity (FC).
Under well watered conditions, the non-grafted parent plants produced the largest
specific leaf masses which were not statistically different from each other (Fig. 5.5).
Specific leaf mass declined when the water stress was imposed. The Lole scion grafted
onto Wanmun treatment produced the greatest specific leaf mass under water stressed
conditions (Fig. 5.5).
Specific leaf weight is the ratio of leaf mass to the leaf area, is used as a drought
tolerance estimate in several crops, and has been considered as a selected trait for
breeding programs (Nobel, 1980). Genotypes with a high specific leaf mass have leaves
with a small surface area to volume ratio, or thick leaves, which is thought to be an
advantage in using water efficiently (Kuo and Chen, 1992; Suja and Nayar, 1996). The
experimental results showed that grafted plants growing under well watered conditions
did not produce greater specific leaf mass. In contrast, however, the Lole scion grafted
onto Wanmun rootstock produced greatest specific leaf mass of the plants grown under
184
water stress. The reduction in the specific leaf mass under water stress is probably due
to water loss for the leaf and if great enough this will reduce photosynthesis and
eventually lead to wilting of the leaf. The Lole scion on the Wanmun rootstock
managed to either extract more moisture from the soil or lose less from its leaves. This
shows that grafting plant materials with a strong sink capacity (Wanmun rootstock) and
a water use efficient source (Lole scion) resulted in increased specific leaf mass under
water stress.
Kuo and Chen (1992) found that sweet potato grafts with a large source (leaves) or a
weak sink (tubers), increased the specific leaf mass, whereas grafts with strong sinks
decreased specific leaf mass under well watered conditions (AVRDC 1990, in Kuo and
Chen, 1992). Sangakkara et al. (2000) showed that specific leaf mass was usually
higher in plants grown under lower soil moisture contents. The increase in specific leaf
mass, according to Kuo and Chen (1992), represents an increase in palisade cell
thickness, or leaf thickening, and may indicate the immobilization of material from the
leaves. However, higher specific leaf mass attained under water stressed conditions in
the present trial was considered to be a beneficial trait in relation to water use
efficiency.
5.5.3.5 Fresh and dry root masses Fresh and dry root masses of all of the planting materials were significantly diminished
by water stress. There was a significant difference in the root mass among both the non-
grafted and grafted sweet potato plants; the interactions between the main effects were
also significant (Tables 5.4 and A5: 11-16).
185

Table 5.4 Effects of soil water contents (30 and 80% soil field capacity) on the fresh and dry root mass of grafted and non-grafted sweet potato cultivars from 1 to 5 months after planting. Number of replicates for each treatment = 5.
Fresh and dry root mass (g/plant) after the indicated number of months since planting
Fresh root mass (g) Dry root mass (g)
Time of measurement (months after planting) 1 2 5 1 2 5
Soil water content 30% field capacity 35.9b 38.3b 55.6b 5.0b 3.9b 7.2b 80% field capacity 52.8a 102.3a 125.2a 9.4a 12.6a 24.0a Planting material Lole (L) 36.1e 63.0e 130.0d 7.5d 10.4c 19.0d Wanmun (W) 49.0c 34.7f 27.0e 7.2d 5.4e 6.1e L-W 49.8c 76.7d 42.2e 8.5c 7.7d 4.3e W-L 42.6d 106.6c 161.8c 5.6e 9.6c 33.0c Interactions 30% x Lole 26.4 30.4 72.0 3.7 4.1 10.4 30% x Wanmun 34.9 30.0 30.0 5.9 3.3 4.0 30% x L-W 41.2 36.4 33.4 5.9 2.2 2.3 30%xW-L 41.2 56.2 86.8 4.3 6.1 12.2 80%xLole 45.8 95.6 188.0 11.2 16.6 27.5 80% x Wanmun 63.0 39.4 24.0 8.4 7.5 8.2 80% x L-W 58.4 117.0 52.0 11.1 13.3 6.3 80% x W-L 44.0 157.0 236.8 6.8 13.1 53.8
Values within a column followed by the same letter symbol are not significantly different (p < 0.05). All the interactions of soil water by type of planting material are significant (p < 0.05). L-W= Lole scion and Wanmun rootstock; W-L= Wanmun scion and Lole rootstock.
Table 5.4 shows the average root masses of all of the planting materials grown under
30% and 80% of soil field capacity. The root mass increased over the first 2 months
after planting in response to active vegetative growth, but then declined as tuber bulking
was initiated in the reproductive growth stage. The root mass decline at harvest is a
response to the maximization of tuber yields. This pattern was also observed in the
nutrition trials reported in the previous chapter of this thesis (Section 4.3.3.1).
186

The Wanmun cultivar is recognized as a high-yielding sweet potato under well watered
conditions (Taufatofua, 1994) and was shown in Section 2.3.3.3 to produce relatively
large tubers and few fibrous roots. The Wanmun cultivar, and the Lole scion grafted
onto the Wanmun rootstock under well watered conditions, both produced low root
masses in comparison with the non-grafted Lole cultivar and with the Wanmun scion
grafted onto Lole rootstock (Table 5.4; Sections 3.5.2.7 and 4.3.3.1). On the other hand,
the root growth of the Lole scion grafted onto Wanmun rootstock was similar to that of
the ungrafted Wanmun cultivar (Table 5.4).
The root mass of the water stressed Wanmun scion grafted onto Lole rootstock had
declined by 77% at 5 months after planting. The root mass reduction was greater than
that of the Lole scion grafted onto Wanmun, and of the non-grafted cv Lole and cv
Wanmun cultivars whose root masses were diminished by the imposed water stress by
63%, 62%, and 51%, respectively.
5.5.4 Tuber components
Tuber yields were reduced significantly by water stress irrespective of the planting
material used, and the interactions between the soil water contents and planting
materials also had a significant effect on tuber yields (Fig. 5.6; Tables 5.1 and A5: 17-
20).
5.5.4.1 Tuber weight
Tuber weight (tuber mass) declined under the imposed water stress. The Wanmun
cultivar produced the greatest tuber mass under well watered conditions (708.4 g/plant).
Under water stress, however, its tuber mass declined by 63%. The Lole cultivar
187

produced a smaller mass of tubers (640.4 g/plant), but showed less reduction under
water stress (49%), and the effect was similar to that of the Lole scion grafted onto
Wanmun rootstock (46%). The Wanmun scion grafted onto Lole rootstock produced
luxuriant top growth but only a few, small tubers under both soil water regimes; this
response might be attributed to the graft incompatibility discussed above (Section
5.5.2).
Cultivar/grafting combination
W-LL-WWanmunLole
Tube
r wei
ght (
g/pl
ant)
800
600
400
200
0
Soil FC
30%
80%
Figure 5.6 Effects of soil water contents (30 and 80% of soil field capacity) on the mass of tubers at harvest of the sweet potato cultivars (Lole, Wanmun) and grafted cultivars (Lole scion on Wanmun rootstock L-W, and Wanmun scion on Lole rootstock W-L). Number of replicates for each treatment = 5. Under well-watered conditions, this plant only produced 102 g tuber/plant, or less than
one sixth of that of the Lole scion grafted onto Wanmun rootstock (640.4 g/plant). The
fibrous root system of the Wanmun scion grafted onto Lole rootstock was extensive and
penetrated deeply into the soil, similarly to that of the non-grafted Lole cultivar grown
under well watered conditions. These results show that the root growth of the Lole
cultivar reduced the tuber storage sink capacity, and may have affected partitioning of
188

assimilates into storage roots and it is also possible that hormonal differences may have
affected source allocation to sinks (fibrous roots vs storage roots) both in Lole
especially in the Wanmun scion on Lole rootstock (W-L) (with the poor graft).
Under water stress, the Lole scion grafted onto Wanmun rootstock produced slightly
higher tuber yields than did the non-grafted cv Wanmun (348 and 260 g/plant,
respectively). Under similar conditions, the Wanmun scion grafted onto Lole rootstock
produced only 34 g of tuber/plant, which much lower than the tuber yield of the non-
grafted cv Lole (280.4 g/plant). According to Kuo and Chen (1992), both source
potential (leaves) and sink strength (tubers) play a vital role in regulating the yields of
sweet potato. The results of the present study have confirmed that sink strength, more
than source potential, affects photosynthesis and translocation. The sink thereby
controls dry matter production and the development of storage roots, as was also found
by Kuo and Chen (1992).
5.5.4.2 Tuber numbers
The Lole cultivar produced significantly higher tuber numbers under well watered
conditions than under water stress (10 / plant and 2 / plant, respectively), and the larger
number of tubers was at the expense of lower masses per tuber (Figs 5.7 and 5.8). The
water stress did not greatly affect the number of tubers produced by cv Wanmun or the
Lole scion grafted onto the Wanmun rootstock (3 tubers / plant compared with 4 tubers /
plant when grown under well watered conditions). It was suggested by Kuo and Chen
(1992) that grafts with strong sinks (storage roots) will produce greater tuber yields than
those with weak sink strength irrespective of the source (leaves) potential. On the other
hand, the Wanmun scion grafted onto Lole rootstock produced abundant fibrous roots
189

and few tubers, possibly as a result of grafting incompatibilities, in that, of the 4 grafted
plants (Wanmun scion onto Lole rootstock), only 2 plants produced tubers which were
smaller than those of the original non-grafted cv Lole. Kuo and Chen (1992) suggested
that the ability of clones to develop storage roots in early or late maturity was
determined by their sinks, not by their sources, as was also indicated by the present
experiment.
Cultivar/grafting combination
W-LL-WWanmunLole
Tube
r num
ber/p
lant
12
10
8
6
4
2
0
Soil FC
30%
80%
Figure 5.7 Effects of soil water contents (30 and 80% of soil field capacity) on the number of tubers at harvest for the sweet potato cultivars (Lole, Wanmun) and grafted cultivars (Lole scion on Wanmun rootstock L-W, and Wanmun scion on Lole rootstock W-L). Number of replicates for each treatment = 5.
190

Cultivar/grafting combination
W-LL-WWanmunLole
Mea
n of
tube
r wei
ght/t
uber
300
200
100
0
Soil FC
30%
80%
Figure 5.8 Effects of soil water contents (30 and 80% of soil field capacity) and the sweet potato cultivars (Lole, Wanmun) and grafted cultivars (Lole scion on Wanmun rootstock L-W, and Wanmun scion on Lole rootstock W-L) on the average mass of tuber at harvest time. Number of replicates for each treatment = 5.
There is a general association between tuber mass and tuber number in many crops, in
that high tuber numbers are likely to relate to low individual tuber masses (Norman et
al., 1995). The highest mean tuber mass produced in the present study under well
watered conditions was from the non-grafted cv Wanmun (188.6 g/tuber) followed by
the Lole scion grafted onto Wanmun rootstock (180.6 g/tuber), non-grafted cv Lole (55
g/tuber), and the Wanmun scion grafted onto Lole rootstock (29 g/tuber). Under water
stress conditions, however, the Lole scion grafted onto Wanmun rootstock, and cv Lole
produced the greatest tuber mass (139 g/tuber and 129 g/tuber, respectively). The
Wanmun cultivar and the Wanmun scion grafted onto Lole rootstock produced
somewhat lower tuber yields (106.7 g/tuber and 8.8 g/tuber, respectively). Previous
results (Section 3.5.5.2) showed that cv Lole, grown under water stress, produced a
comparable mean mass per tuber with that of cv Wanmun grown under well watered
conditions.
191

The Wanmun cultivar and the Lole scion grafted onto Wanmun rootstock started tuber
growth early in the maturity stage under well watered conditions. This also helped to
determine their potential in maximising tuber yield compared with faster than the other
sweet potato planting materials.
5.5.4.3 Harvest index Harvest index, an indicator of the relative distribution of carbon, was significantly
affected by soil water contents and grafting (Tables 5.1 and A5: 20). Under well
watered conditions (80% of soil field capacity), the harvest index was greatest for the
Lole scion grafted onto Wanmun rootstock, followed by cv Wanmun, then cv Lole (Fig.
5.9). The same pattern was observed with the plants grown under water stress (30% of
field capacity), but the water stress reduced the harvest index. The higher harvest index
indices were attributed to the greater distribution of assimilates into the tubers and
resulted in greater tuber production. The Wanmun scion grafted onto Lole rootstock
produced the lowest harvest index as a consequence hormonal differences, which may
have affected source allocation to sinks (fibrous roots vs storage roots).
These results, like the tuber growth responses, are consistent with those of Kuo and
Chen (1992) who found that sweet potato grafts with a strong sink (storage roots)
produced a greater yield of storage roots than those with weak sink strength,
irrespective of the source potential (leaves). The reciprocal graft treatment also showed
that the ability of clones to develop storage roots early or late was determined by their
sinks, not by their sources (Hozyo et al., 1971 in Kuo and Chen, 1992). Kuo and Chen
(1992) also showed that grafts with a large source and weak sink produced an
intermediate content of total dry matter and storage root yield.
192

Cultivar/grafting combination
W-LL-WWanmunLole
Har
vest
Inde
x
.7
.6
.5
.4
.3
.2
.1
0.0-.1
Soil FC
30%
80%
Figure 5.9 Effects of soil water contents (30 and 80% of soil field capacity) on the harvest index of the sweet potato cultivars (Lole, Wanmun) and grafted cultivars (Lole scion on Wanmun rootstock L-W, and Wanmun scion on Lole rootstock W-L). Number of replicates for each treatment = 5. The high harvest index of the Lole scion grafted onto Wanmun rootstock, according to
Kuo and Chen (1992), indicates high efficiency in storage root formation. It is implied,
then, that efficient carbon mobilization to the storage roots from the leaves rather than
larger source leaf area is critical for the development of high harvest index in sweet
potato.
5.5.5 Physiological traits
Table 5.5 shows the effects of soil water contents on the physiological traits of the
sweet potato cultivars Lole, Wanmun, and their grafted combinations.
The main effects and interactions were mostly significant (Table 5.5). Significant
interactions indicate that the cultivars and grafting combinations responded differently
to different soil water contents for that parameter. The interactions between soil water
193

contents and the grafted and the non-grafted plants was not significant for chlorophyll b,
chlorophyll a/b ratio, and plant water relations. Stomatal density was not affected by
different soil water contents, however it was significantly different among cultivars.
Interactions between soil water contents and the grafted and non-grafted plants were
also not significant for stomatal density, indicating that the cultivars and their grafted
combinations responded similarly to the different soil water contents sustained
throughout the experimental period.
Table 5.5 The significance of soil water contents on the physiological aspects of sweet potato cultivars Lole, Wanmun, Lole grafted onto Wanmun, and Wanmun grafted onto Lole and their interactions, grown at 30% and 80% of soil field capacity.
Significance Plant parameters
Soil water content Planting material Interaction
Leaf pigments Chlorophyll a * * * Chlorophyll b * * ns Carotene * * * Total chlorophyll (a+b) * * * Chlorophyll a/b ratio * * ns Anatomy Stomatal density ns * ns Length of guard cell * * ns Cuticle thickness * * ns Plant water relations Leaf water potential * * ns Leaf relative water content * * ns Water use: 1st month of growth * * * 2nd month of growth * * * 3rd month of growth * * ns 4th month of growth * * * 5th month of growth * * ns Water use efficiency * * * ns (not significant); * the main effect or interaction was significant (p < 0.05)
194

5.5.5.1 Leaf pigments
Soil water contents had a significant effect on the pigment contents of the two cultivars,
their grafted combinations, and their interactions (Tables 5.5 and A5: 21 –25).
Table 5.6 Effects of soil water contents (30 and 80% of soil field capacity) on the leaf pigment content on the sweet potato cultivars Lole, Wanmun, and their grafted combinations, at 3 months after planting. Number of replicates for each treatment = 6.
Leaf pigment content (mg / g leaf fresh mass)
Chlorophyll a Chlorophyll b Chlorophyll a/b ratio
Total chlorophyll (a + b) Carotene
Water content 30% field capacity
1.8b 0.5d 0.4b 2.3b 3.7a
80% field capacity
2.3a 0.7a 0.5a 3.0a 3.5b
Cultivar Lole (L) 2.2c 0.6b 0.5c 2.8c 3.8c Wanmun (W) 1.9d 0.5c 0.4d 2.4d 3.9c Lole-Wanmun 2.1c 0.6b 0.5c 2.7cd 3.5d Wanmun-Lole 2.0bc 0.6b 0.5c 2.7cd 3.2e Interactions 30% x Lole 1.7 0.4 0.4 2.2 4.1 30% x Wanmun 1.7 0.4 0.4 2.1 3.9 30% x L-W 1.9 0.5 0.4 2.4 3.7 30% x W-L 1.9 0.6 0.4 2.5 3.5 80% x Lole 2.7 0.7 0.6 3.4 3.7 80% x Wanmun 2.2 0.6 0.5 2.8 3.9 80% x L-W 2.3 0.7 0.5 3.0 3.5 80% x W-L 2.2 0.7 0.5 2.8 3.1
Values within a column followed by the same letter symbol are not significantly different (p < 0.05). All the interactions of soil water by type of planting material are significant (p < 0.05). In general, the pigment contents (chlorophyll a, chlorophyll b, total chlorophyll (a + b),
and carotene) declined in the plants grown under water stress. The chlorophyll a/b ratio,
on the other hand, was significantly higher under water stress and varied among the
grafted and non-grafted sweet potatoes (Table 5.6). The results are consistent with the
195

previous results that the pigment content declined under water stress (Sections 3.5.4.1,
and 4.3.4).
5.5.5.1.1 Chlorophyll a and b
Under well watered conditions, chlorophyll a content per unit of leaf fresh mass was
significantly higher in both the non-grafted cv Lole and Lole scion grafted onto
Wanmun rootstock plants compared with that of cv Wanmun (Table 5.6). Under water
stressed conditions, however, both of the grafted plants had greater chlorophyll a
contents than their non-grafted parents (Table 5.6). Chlorophyll b contents were not
significantly different between cv Lole and the two grafted combinations, but cv
Wanmun leaves, on the other hand, had a significantly lower chlorophyll b content than
all of the others (Table 5.6).
5.5.5.1.2 Total chlorophyll
Under well watered conditions the total chlorophyll (a + b) concentration was
significantly higher in cv Lole and in the Lole scion grafted onto Wanmun rootstock,
but it was higher in both of the grafted plant combinations grown under water stress
(Table 5.6).
Chlorophyll plays an important role as a structural component in photosynthesis. High
chlorophyll contents indicate better organization of the light harvesting complex in the
thylakoid membranes (Dahlin, 1988), and low chlorophyll contents may cause a
reduction of light absorption by leaves (Evans, 1996).
196

5.5.5.1.3 Chlorophyll a/b ratio
The decrease of chlorophyll concentrations in leaves under water stress was associated
with an increase in the chlorophyll a/b ratio with respect to well-watered sweet potato
plants. Under water stressed conditions, cv Wanmun produced the greatest chlorophyll
a/b ratio in its leaves, followed by cv Lole, and the Lole scion grafted onto Wanmun
rootstock. The Wanmun scion grafted onto Lole rootstock produced the lowest
chlorophyll a/b ratio, under both the water-stressed and well watered conditions.
The chlorophyll a/b ratio is an index for determining the photosynthetic efficiency in
that chlorophyll a is present in the reaction centre and chlorophyll b is only present in
the light-harvesting complex (Nordenkampf and Lechner, 1988). A high chlorophyll
a/b ratio also indicates that the ratio between photosystem I and II contents changes in
stressed leaves (Anderson, 1986), and this indicates a poor physiological status of the
plants. Alberte and Thornber (1977) found that the ratio of chlorophyll a/b under water
stress increased and reduced photosynthetic unit sizes both in mesophyll and bundle
sheath chloroplast of maize (Zea mays L.). Water stress also decreased chlorophyll a
and b contents but increased chlorophyll a/b ratio of wheat (Triticum aestivum L.)
cultivars (Haider and Paul, 2003). Under water stress conditions, cv Wanmun had
greatest ratio of chlorophyll a/b ratio, followed by cv Lole, and then both of the grafted
plants.
5.5.5.1.4 Carotene
Under water stressed conditions, the Lole and Wanmun cultivars produced greater
carotene contents in their leaves than when grown that under well watered conditions.
The Lole cultivar produced greater carotene than cv Wanmun under water stress, and
the result was reversed under well watered conditions (Table 5.6).
197

The role of carotene in photosynthesis is in light harvesting and photoprotection
(Hopkins, 1999). Carotenoids absorb and transfer light energy to chlorophyll a, and are
used in photosynthesis (Devlin and Witham, 1983). It is suggested that, as the water
stress was imposed in the present experiment, that the leaf pigment contents including
the carotenoids declined, and such a change is usually associated with a decrease in
photosynthesis and growth, however the present results showed a greater carotene under
water stress conditions.
It is possible that the carotenoid concentration of leaves may increase under water stress
to protect the system by minimising photoinhibition, but this was not obvious from the
present analysis of the total carotenoid concentrations of sweet potato leaves. An
analysis of the pool sizes of the different carotenoids would be needed to verify if the
carotenoids are protecting the plants against photoinhibition under water stress.
5.5.5.2 Leaf anatomy 5.5.5.2.1 Stomatal density Previous results (Section 3.5.4.2) showed that stomatal density was not affected by
water stress, but was significantly different between cvv Lole and Wanmun on both the
adaxial (upper) and abaxial (lower) leaf surfaces and under both the well-watered and
stressed conditions (Fig. 5.10; Tables 5.5 and A5: 26-27). The densities of stomata on
the leaves of the grafted plants were similar to those of the parent scion, which was
attributed to the maintenance of leaf morphology characters after grafting (Fig. 5.10).
198

Adaxial leaf surface
Cultivar/grafting combination
W-LL-WWanmunLole
Sto
mat
al d
ensi
ty (m
m2)
16
14
12
10
8
6
Soil FC
30%
80%
Abaxial leaf surface
Cultivar/grafting combinations
W-LL-WWanmunLole
Sto
mat
al d
ensi
ty (m
m2)
80
70
60
50
40
30
20
Soil FC
30%
80%
Figure 5.10 Effects of soil water contents (30 and 80% of soil field capacity) on the stomatal density of (a) the adaxial and (b) abaxial leaf surfaces of the sweet potato cultivars (Lole, Wanmun) and grafted cultivars (Lole scion on Wanmun rootstock L-W, and Wanmun scion on Lole rootstock W-L). Number of replicates for each treatment = 10. 5.5.5.2.2 Lengths of guard cells
The lengths of guard cells (the cells that control the functioning of the stomatal pores;
Hopkins, 1999) were significantly shortened by soil water stress (Fig. 5.11; Tables 5.5
199

and A5: 28), but the interactions among the main effects were not statistically
significant.
Soil field capacity (%)
8030
Leng
th o
f gua
rd c
ell (
um)
10
9
8
7
6
5
Cultivar
Lole
Wanmun
Lole-Wanmun
Wanmun-Lole
Figure 5.11 Effects of soil water contents (30 and 80% soil field capacity) on the lengths of guard cells of the sweet potato cultivars (Lole, Wanmun) and grafted cultivars (Lole scion on Wanmun rootstock L-W, and Wanmun scion on Lole rootstock W-L). Number of replicates for each treatment = 10.
The opening and closing of the stomatal pores is related to the osmotic pressure of the
guard cell contents (Taiz and Zeiger, 2002). More sugar molecules in the guard cell
(under well watered conditions), create a greater tendency for water to enter the guard
cells. Hence, the longer guard cells produce greater stomatal pore openings, allowing
more water to escape from the leaf surface under well watered conditions.
5.5.5.2.3 Cuticular thickness
The cuticle is the outer surface of the leaves of vascular plants, which is covered with a
multi-layered wax deposit (Hopkins, 1999) which is part of a plant’s defence
mechanism to protect it from desiccation (Zobayed et al., 2000). While stomata
200

contribute to 90-95% of the water lost from the leaf surface to the atmosphere,
transpiration through the cuticle contributes only 5-10%, depending on the cuticle
thickness (Hopkins, 1999). Thicker cuticles are characteristic of plants growing in full
sun or dry habitat (Hopkins, 1999).
There was no real difference in cuticular thickness between cultivars. It decreased in all
of the sweet potato plants studied under water stress (Fig. 5.11; Tables 5.5 and A5: 29).
However, the interactions between soil water contents and the grafting treatments were
not significant.
Higher stomatal numbers and thinner cuticular wax are important leaf characters
thought to be responsible for the high water transpiration rates found in cv Wanmun
(Section 3.5.4.2). The smaller leaf areas of cv Lole and of the Lole scion, combined
with their thicker cuticular waxes, gave better control of transpiration, hence, reduced
water loss and increased drought tolerance.
Soil field capacity (%)
8030
Cut
icle
thic
knes
s (u
m)
3.5
3.0
2.5
2.0
1.5
1.0
Cultivar
Lole
Wanmun
L-W
W-L
Figure 5.12 The leaf cuticle thickness of Lole, Wanmun, Lole scion grafted onto Wanmun rootstock, and Wanmun scion grafted onto Lole rootstock grown at 30% and 80% soil field capacity.
201

Cv Lole, 30% of field
capacity Cv Wanmun, 30% of
field capacity Lole scion-Wanmun
rootstock, 30% of field capacity
Wanmun scion-Lole rootstock, 30% of field
capacity
Cv Lole, 80% of field capacity
Cv Wanmun, 80% of field capacity
Lole scion-Wanmun rootstock, 80% of field
capacity
Wanmun scion-Lole rootstock, 80% of field
capacity
40 µm
uc
lc
40 µm 40 µm 40 µm
40 µm 40 µm 40 µm 40 µm
Figure 5.13 The structure of sweet potato leaves in cross-section. leaves of cv Lole (L), cv Wanmun (W), Lole scion grafted onto Wanmun (LW), and Wanmun scion grafted onto Lole root (WL) were grown under 30% and 80% of soil field capacity and sampled 4 months after planting. All of the leaf sections are orientated with their adaxial (upper) leaf surfaces towards the top of the page. The upper and lower cuticular waxes are indicated by arrows. 5.5.6 Plant water relations
5.5.6.1 Leaf water potential
Sweet potato plants subjected to water stress had significantly lower leaf water potential
compared to those grown under well watered conditions, but the interactions between
soil water contents and the cultivars and their grafting combinations were not significant
(Fig. 5.14; Tables 5.5 and A5: 30).
202

-1.2
-1
-0.8
-0.6
-0.4
-0.2
0
Lole Wanmun L-W W-L
Cultivar/Grafting combinations
Leaf
wat
er p
oten
tial (
M
30% 80% Soil FC
Figure 5.14 Effects of soil water contents (30 and 80% of soil field capacity) on the leaf water potential of the sweet potato cultivars (Lole, Wanmun) and grafted cultivars (Lole scion on Wanmun rootstock L-W, and Wanmun scion on Lole rootstock W-L) at 3 months after planting. Number of replicates for each treatment = 3. The mean leaf water potential of the grafted and non-grafted plants was –0.59 MPa
under well-watered conditions, which was significantly higher than –0.94 MPa in the
water stressed plants (Fig. 5.14). It is evident that cv Lole and the Lole scion grafted
onto Wanmun rootstock were more efficient than cv Wanmun in maintaining their leaf
water potentials. During the day when temperatures and transpiration were high, cv
Lole had more turgid leaves demonstrating the capacity of this cultivar to reduce
transpiration from the leaf surface. As a result, cv Lole and the Lole scion regulated
water use more efficiently, and had a less negative leaf water potential, than did the cv
Wanmun and Wanmun scion with large leaf areas and high leaf surface transpiration.
5.5.6.2 Leaf relative water content
Leaf water potential and leaf relative water content are physiological variables, which
are commonly used as indicators of plant water status. The ability to maintain leaf water
203

potential and leaf relative water content indicate a strong drought tolerance
characteristic that is needed to maintain yields under water stress conditions.
The relative water content of sweet potato leaf tissue grown under well watered
conditions was significantly higher than that of all of the plants grown under water
stress, but there were no interactions among the main effects (Fig. 5.15; Tables 5.5 and
A5: 31).
Cultivar/grafting combinations
W-LL-WWanmunLole
Leaf
rela
tive
wat
er c
onte
nt (%
) 90
80
70
60
50
Soil FC
30%
80%
Figure 5.15 Effects of soil water contents (30 and 80% of soil field capacity) on the leaf relative water content of the sweet potato cultivars (Lole, Wanmun) and grafted cultivars (Lole scion on Wanmun rootstock L-W, and Wanmun scion on Lole rootstock W-L) at 3 months after planting. Number of replicates for each treatment = 6. 5.5.6.3 Transpiration
The daily transpiration rate was affected by soil water contents in different cultivars and
their grafted combinations throughout the experimental period. Interactions between the
two main effects were also significant in the first 2 months after planting (Fig. 5.16;
Tables 5.5, A5: 32-36, and A5: 38).
204

Under well watered conditions, the sweet potato plants transpired an average 476.4 g
water/day in the first month of growth, which was more than twice that of the plants
under water stress (202.1 g water/day) (Fig. 5.16). At the same time, cv Wanmun and
the Wanmun scion had similar transpiration losses that were greater when grown under
well watered conditions compared with water stressed conditions (the order of 531 and
217 g water/day, respectively), followed by cv Lole and the Lole scion whose water
uses were closely similar under both well watered and water stressed conditions (the
order of 474 and 217 g water/day, respectively).
The present experiment has clearly shown that transpiration losses are dependent on
signals from the vegetative part of the sweet potato plant, and are independent of a root
signal.
Two months after planting, the mean transpiration across all the well watered plants was
62% greater than that of the water stressed plants. The amount of water consumed by
the well watered sweet potato plants increased rapidly from the first to the second
month after planting, then remained moderately stable (Fig. 5.16); the increased water
use was associated with an increase in biomass and initial tuber development.
At 3 months after planting, the sweet potatoes grown under well-watered conditions
used an overall mean of 711.4 g of water/day. This was 50% higher than mean mass of
water used by the stressed plants (355.3 g water/day). Transpiration in the well watered
plants increased dramatically from the initial vegetative growth (1 month after planting)
to 3 months after planting as tuber development proceeded.
205

1 month after planting
W-LL-WWanmun
Lole
Tran
spira
tion
(g o
f H2O
) 800
700
600
500
400
300
200100
Soil FC
30%
80%
2 months after planting
W-L
L-WWanmun
Lole
Tran
spira
tion
(g o
f H2O
) 800
700
600
500
400
300
200100
Soil FC
30%
80%
3 months after planting
W-L
L-WWanmun
Lole
Tran
spira
tion
(g o
f H2O
) 800
700
600
500
400
300
200100
Soil FC
30%
80%
4 months after planting
W-L
L-WWanmun
Lole
Tran
spira
tion
(g o
f H2O
) 800
700
600
500
400
300
200100
Soil FC
30%
80%
5 months after planting
W-L
L-WWanmun
Lole
Tran
spira
tion
(g o
f H2O
) 800
700
600
500
400
300
200100
Soil FC
30%
80%
Figure 5.16 The mean rate of daily transpiration of Lole, Wanmun, Lole scion grafted into Wanmun rootstock (L-W), and Wanmun scion grafted onto Lole rootstock (W-L), grown under 30% of soil field capacity and 80% of soil field capacity between 1 month and 5 months after planting.
206

As the plants approached maturity, their transpiration rates increased slightly and the
well-watered plants attained their maximum dry matter production levels; the greater
transpiration rates may also have been partly in response to an increase in temperature
and a decrease in relative humidity during the experimental period (Figs 5.2 and 5.3).
The water lost by the other plants during the reproductive stage is attributed to the
decreasing shoot growth and leaf area due to senescence at crop maturity.
Under a good water supply, total dry matter production in the leaves is thought to be
related to the proportion of dry matter diverted into tubers (Kuo and Chen, 1992). An
efficient transpiration capacity in the leaves combined with a good tuber yield capacity
in the sink was expected in cv Wanmun which extracted more water from the soil due to
its high water demand for growth and transpiration. As a result, however, tuber
production was severely restricted when the water supply was reduced.
Grafting of Lole scions onto Wanmun rootstocks produced a plant that transpired
efficiently through the leaves of the Lole scion, and its Wanmun rootstock produced
acceptable tuber yields. This grafting combination of sweet potato cultivars shows very
promising results: it produced a drought tolerant plant that can still produce satisfactory
tuber yields under dry conditions.
5.5.6.4 Water-use efficiency
Water-use efficiency was significantly influenced by the differences in soil water
contents on the growth of both the non-grafted and grafted sweet potato plants;
interaction effects were also significant (Tables 5.6, A5: 37 - 38). Water use efficiency
in plants grown under water stress was ranked in the following decreasing order: Lole
207

scion grafted onto Wanmun rootstock (3.9 g total plant dry mass/kg of water), followed
by non-grafted cv Lole (3.7 g/kg water), non-grafted cv Wanmun (3.6 g/kg water), and
the Wanmun scion (2.6 g/kg water). Under well-watered conditions, the plants were
ranked in water-use efficiency as follows: cv Wanmun (3.5 g/kg of water), followed by
cv Lole (3.2 g/kg of water), the Lole scion on Wanmun rootstock (3.0 g/kg of water),
and the Wanmun scion on Lole rootstock (2.7 g/kg of water). These results are
comparable those with Taufatofua (1994) who recorded that an average water use
efficiency of 3 - 4 g/kg for other well watered sweet potato cultivars.
The Wanmun cultivar consumed the greatest amount of water for its growth and
development as a consequence of its high biomass production and heavy tuber yields.
Crop growth rates were the highest in the early vegetative stage 1 - 2 months after
planting, when the plants consumed water most rapidly (Fig. 5.16). Therefore, water
stress during this stage is highly detrimental to the sweet potato growth and tuber
development. Taufatofua (1994) also found that the effects of water stress were most
severe in young plants, and reduced tuber yields more severely in the crops subjected to
water stress later in their growth cycle.
208

0
0.5
1
1.5
2
2.5
3
3.5
4
4.5
5
Lole Wanmun LW WL
Cultivars/grafting combinations
Wat
er u
se e
ffici
ency
(g D
M/k
g H
2O) 30% of field capacity 80% of field capacity
Figure 5.17 Water use efficiency of Lole and Wanmun cultivars, Lole scion grafted onto Wanmun rootstock (L-W), and Wanmun scion grafted onto Lole rootstock (W-L), grown under 30% and 80% of soil field capacity. 5.6 CONCLUSIONS
The application of a severe water stress by reducing the water availability to 30% of soil
field capacity, decreased the overall growth and physiological functioning of the non-
grafted and grafted sweet potato plants of the present study. Despite producing greater
biomass, the shoot mass of the non-grafted cv Wanmun and of the Wanmun scion
grafted onto Lole rootstock showed more severe decline under water stress than did that
of the non-grafted cv Lole and the Lole scion grafted onto Wanmun rootstock. The
reduction of shoot mass under water stress was associated with several factors. First,
soil water stress reduced the internal plant water status, which was expressed by
decreased leaf water potential, lower leaf relative water content, and reduced leaf
pigment content. Second, as a consequence of insufficient water available to plant cells,
the leaf mass and leaf area were reduced and this affected the whole biomass gain
through reduced radiation interception.
209

Water stress affected the development of leaf area and mass. Among the planting
materials studied, the non-grafted cv Wanmun and Wanmun scion grafted onto Lole
rootstock produced the greatest leaf areas and masses, and the highest water
transpiration losses, under both soil water regimes, and these growth parameters
declined under water stress.
Specific leaf weight was greater in the non-grafted sweet potato cultivars (cv Lole
greater than cv Wanmun) under well watered conditions. Under water stress, however,
the Lole scion grafted onto Wanmun rootstock had greatest specific leaf weight, while
the other plants showed no statistically significant difference from the corresponding
values for the well watered plants. This result implies that greater specific leaf weights
of cv Lole and the Lole scion are associated with more efficient use of water.
Root masses declined under water stress, and the greatest declines were in cv Lole and
in the Wanmun scion grafted onto Lole rootstock, both of which were characterised by
abundant fibrous roots. The less fibrous roots of cv Wanmun and of the Lole scion
grafted onto Wanmun rootstock favoured heavier tuber yields. The Wanmun cultivar
produced the greatest tuber masses under well watered conditions. Under water stress,
however, the Lole scion grafted onto Wanmun rootstock produced the greatest tuber
mass. This implies that scion and rootstock controlled different aspects of the growth
and development of vegetative and reproductive parts of the grafted plants.
The Wanmun cultivar showed poor compatibility when grafted as a scion onto Lole
rootstock and produced very few tubers compared with all of the other planting
210

materials, although cv Lole produced the largest number of tubers, but of relatively
small size, under well watered conditions. Under water stress, however, the number of
tubers declined in all the plants, particularly in cv Lole, but brought about a parallel
increase in average tuber mass.
The Lole scion grafted onto Wanmun rootstock produced the greatest harvest index.
This implies that the ability of plants to develop storage roots was determined by an
efficient top growth (leaves and stems) and a strong sink capacity in an effective root
system.
The content of pigments in the sweet potato plants (chlorophyll a, b, total chlorophyll,
carotene concentrations) all diminished under water stress, while the chlorophyll a/b
ratio increased, which implied that physiological functions were affected by the
imposed stress. Both grafted sweet potato plants produced only slightly lower
chlorophyll a/b ratios in both soil water regimes than did the non-grafted plants,
indicating a similarity of physiological function between the vegetative parts of the
grafted and non-grafted plants.
Stomatal density was not affected by water stress. However cv Lole, and the Lole scion
grafted onto Wanmun rootstock had lower stomatal densities in comparison to the non-
grafted Wanmun cultivar and the Wanmun scion grafted onto Lole rootstock. This
suggests that cv Lole and the Lole scion had a mechanism to regulate the efflux of water
efficiently from the leaf surface of the sweet potato. The stomatal guard cells were
longer and the leaf cuticle waxes were thicker in all of the plants grown under well
watered compared with water stress conditions.
211
An important finding presented in this chapter is that grafting did not change the
characteristics of the vegetative parts of the cultivars, nor the functioning of the sink in
the storage root. A strong sink was shown to improve tuber yield, and plant shoots that
conserved plant moisture, combined by grafting with a strong sink, produced good tuber
yields under water stress conditions.
The results show that the leaves of the Lole and Wanmun cultivars varied in their
morphologies and structural anatomies. The leaves of the grafted plants had similar
characters to those of the parent of the scion. The characteristically small leaves of cv
Lole and the Lole scion reduced water loss at the whole-plant level; their anatomical
features (lower stomatal density and thicker cuticle wax) helped to reduce leaf
transpiration and thus improved crop water-use efficiency in comparison to the cv
Wanmun and the Wanmun scion grafted onto Lole rootstock.
Leaf water potential and relative water content declined under water stress in all of the
studied plants. The non-grafted Wanmun cultivar and Wanmun scion grafted onto Lole
rootstock had strongly negative leaf water potential, a lower percentage of relative water
content, and high transpiration, all of which are associated with greater water losses and
lower water-use efficiency as a consequence of larger leaf areas and related anatomical
features.
Water use increased rapidly during the early stages of vegetative growth but became
constant towards plant maturity. As the consequence of biomass reduction at maturity,
212

water use by all of the studied plants was lower during the entire growth period under
water stress.
Under water stress, the Lole cultivar and the Lole scion grafted onto Wanmun rootstock
had high water-use efficiencies. On the other hand, the Wanmun cultivar had the
greatest water-use efficiency under well watered conditions. The results suggest that the
ability of plants to develop storage roots under water stress was determined by an
efficient transpiration capacity in the source (leaves) and a strong sink capacity in the
roots.
In general, the ability of sweet potato genotypes to partition carbon into the tubers is
important in determining storage root yields. Likewise, selection for greater leaf
transpiration efficiency is a useful criterion in coping with water deficit problems.
Therefore, combining the cultivar traits by grafting an efficient leaf transpiring organ
onto a strong potential sink (such as a cv Lole scion grafted onto a cv Wanmun
rootstock) resulted in a greater harvest index and increased water-use efficiency.
In searching for sweet potato varieties with drought tolerance characters and desirable
yields, the present study has shown that grafting between two cultivars with compatible
scions and rootstocks is possible. The compatibility of the grafted combination between
a Lole scion grafted and a Wanmun rootstock fulfils the criterion for a drought tolerant
strategy and good storage root yields under water stress conditions. The ability of this
grafted combination to produce high tuber yields was associated with low rate of
transpiration and high water-use efficiency. In addition, compatibility and good
alignment across the grafted union provided ready movement of assimilates from
leaves, and easy transport of water and inorganic substances from roots.
213

Grafting of appropriate sweet potato materials allows the option of new farming
systems to be developed so that the indigenous people of drought-prone environments,
where sweet potato is the staple diet, can use the benefits to flow from the results of the
present study. As a first step in that direction, it is proposed that indigenous gardeners
be encouraged propagate at least three different kinds of sweet potato planting
materials:
• cv Wanmun for high yields under good rainfall;
• cv Lole for subsistence yields to ensure survival of human communities
under severe drought conditions;
• cv Lole scions grafted onto cv Wanmun rootstocks (or other
combinations of drought tolerant sweet potato varieties grafted as scions
onto varieties with good storage root sink capacity as rootstocks) for
improved tuber yields under water stress conditions.
214

CHAPTER 6
SWEET POTATO CULTIVATION IN PAPUA: POTENTIAL FOR DEVELOPMENT
6.1 INTRODUCTION
Papua is the most eastern of the Indonesian provinces and borders on Papua New
Guinea. Indigenous people of the highlands of Papua depend to a great extent on sweet
potato as their main carbohydrate source and it accounts for nearly 100% of their staple
diet. The crop is also the main feed for pigs which are a vital part of the culture and
ritual dimensions in many Papuan ethnic groups. Even though sweet potato is grown
under a wide range of environments, both genetic and environmental factors determine
sweet potato growth and yields.
Regular droughts are the biggest problem threatening sweet potato growth and the lives
of highland people in Papua where death from starvation is still a real and present threat.
Government sources indicated 38 – 40 people died as a result of the 1997 – 1998
drought (Cenderawasih Pos, 1998), but this may be an underestimation. Urgent appeals
are frequently made to government and non-government agencies to help sustain the
local people, particularly through the supply of sweet potato planting materials which
maximize the production of preferred food supplies.
As sweet potato constitutes the major part of the daily diet, characterization of the
texture, size, yield, and taste of sweet potato tubers is common among the indigenous
Papuans. The large, sweet tubers with high dry matter content are preferred for human
215
consumption and cultivars with high starch content and sweet taste are reserved for
ritual and ceremonial use. Cultivars with big, fibrous roots and small and damaged
tubers are used as pig food, and are eaten by humans only during times of food shortage
(Peters, 2001).
In the highlands of Papua, sweet potato consumption has been estimated at 3 kg per
capita per day, or 13 kg per day for the average family (Soenarto, 1987). Each harvest is
targeted on the family size and the number of pigs to be fed (10-15 kg will feed a family
of three adults, three children and two big pigs; Peters, 2001). However, the average
production of sweet potato in highland Papua is low (4 to 10 t/ha) compared to that of
19, 21, and 24 t/ha in China, Japan, and South Korea, respectively. Among the factors
that contribute to the lower sweet potato yield is drought which devastates sweet potato
plants regularly.
6.2 SWEET POTATO GENETIC RESOURCES
Cultivar Lole, which is characterized by a small leaf area, showed more drought
tolerance than the other 15 cultivars tested in the present study; it grew well under low
soil moisture contents (Section 2.3.2). Under water stress conditions, cv Lole had the
greatest ability to maintain plant water status as shown by high transpiration
efficiencies, high leaf water potential, long periods to reach permanent wilting point,
and low percentage of growth reduction (Section 2.3.2.1 and 2.3.2.4). The Lole cultivar
had high leaf pigment contents, low stomatal density, and thick cuticular wax (Sections
3.5.4.1; 3.5.4.2 and 5.5.5.2.3). Such plant characteristics are usually associated with
effective control of transpiration, which reduces water loss and thereby give the plant a
greater relative tolerance to water stress, more vigorous growth, and higher productivity
216

when grown under water stress conditions (Parimelazhagan and Francis, 1996). The
tuber yield and average tuber size of cv Lole was greater than those of cv Wanmun
when the cultivars were grown under 40% of field capacity. In terms of tuber size, cv
Lole grown under water stress conditions produced tubers that met the market quality
size (average 247.5 g/tuber) which was comparable with those of cv Wanmun grown
under well watered conditions (average 243.8 g/tuber; Section 3.5.5). However, cv Lole
produced lower tuber yields than cv Wanmun under well watered conditions. The tuber
yield of Lole cultivar responded well to nitrogen fertilizer up to 100 kg/ha (Section
4.3.3.2). Under low soil nitrogen conditions, plants were stunted, leaf growth was
inhibited, and the leaves and stems showed chlorosis, which indicates chlorophyll
damage and impaired photosynthesis (Section 4.3.2). A greater potassium supply not
only promoted tuber yield (Section 4.3.3.2), but it also enhanced water use efficiency
(Section 4.3.5.2). Therefore, any nitrogenous fertilizer should be applied to cv Lole in
association with potassium inputs.
The Wanmun cultivar was classified as a drought susceptible cultivar (Section 2.3.2.1
and 2.3.2.4). In contrast with cv Lole, cv Wanmun produced high yields of large sweet
potato tubers under well watered conditions (1228.5 g per plant), but lower masses of
edible tubers under water stress conditions (Section 3.5.5.1). Greater leaf photosynthetic
capacity in cv Wanmun required a high water demand for growth and transpiration
(Section 3.5.3.1). Its growth and the physiological aspects including pigment
concentrations, leaf water potential, and relative water content decreased as growth
progressed, and their decline was greater in cv Wanmun than in cv Lole (Section 3.5.3
and 3.5.4). Therefore, tuber yield production was severely affected and declined when
the water supply was restricted in cv Wanmun (Section 3.5.5).
217
The Lole cultivar produced significantly greater tuber sucrose content than that of cv
Wanmun, and it was also greater when cv Lole was grown under restricted soil water
conditions (Section 3.5.4.3). The Wanmun cultivar, on the other hand, produced greater
starch content than did cv Lole (Section 3.5.4.3). Greater sucrose content gives the
tubers a sweeter taste which is generally demanded by the native Papuans, while greater
starch content may favour the starch production industry and pig feeding. However, the
preferences of the sucrose and starch contents of sweet potato tubers may vary from
region to region (Widyastuti, 1995). In the valleys of highland Papua, the people favor
sweet potatoes with a soft texture and a rather high water content, whereas at higher
altitudes, red-purple, elongated tubers like those of cv Lole are preferred for their taste
and their greater concentration of anthocyanins. People in this area believe that such
tubers provide protective mechanisms against disease, infection, and adverse conditions
(Widyastuti, 1995).
.
The Lole scion grafted onto Wanmun rootstock produced the greatest harvest index and
tuber mass under water stress. The tuber yield of the Lole scion grafted onto the
Wanmun rootstock was slightly better than the yield of cv Lole and cv Wanmun under
water stress but was still lower than that of the well watered ungrafted cv Wanmun
plants. Under water stressed conditions, however, the Lole scion grafted onto Wanmun
rootstock, and the ungrafted cv Lole plants, produced the greatest tuber size (139
g/tuber and 129 g/tuber, respectively; Section 5.5.4). This suggests that the scion and
rootstock regulated different aspects of vegetative and reproductive growth of the
grafted plants including the growth of storage roots which was determined by an
efficient top growth and a strong sink capacity.
218

There are approximately 5000 sweet potato cultivars grown in Papua (Yen, 1974). Of
these, the International Potato Centre in cooperation with the Root Crops and Tuber
Research Centre of Papua State University, Manokwari, collected 827 cultivars from in
situ and ex situ conservation sites in the Papua highlands during the period from 1993 to
1997. The fewer numbers compared to the previous estimate of Yen (1974) is thought to
be due to natural calamities such as drought, frost, and flooding during the more recent
collection period. The Indonesian government, through the Department of National
Education, Jakarta, and the Department of Agriculture, Papua Province, has recently
provided funding for a follow-up project to the work presented in this thesis using local
sweet potato cultivars. This research is about to start using 10 prominent cultivars (9
local Papuan cultivars of sweet potato obtained from the ex situ collection and 1 [Ciceh]
cultivar introduced from Bogor) which are morphologically similar to either cv Lole in
relation to smaller leaf area as an indicator drought tolerance as a result of low
evapotranspiration, or cv Wanmun for their high tuber yielding and eating quality
(Tables 6.1 and 6.2). The trial will screen the cultivars for drought tolerance or
susceptibility, and will help to identify local cultivars that may be used in future grafting
trials.
219

Table 6.1 The sweet potato cultivars selected with similar morphological characteristics to those of cv Lole (deeply lobed, almost divided leaves, high tuber numbers under water stress conditions) for drought tolerance screening trials. No. Name of cultivar Morphological characters 1 Ciceh Triangular and deep lobed leaves, medium leaf area, long
vines, purple storage roots, sweet, watery, low yielding cultivar (11.3 t/ha).
2 Miencon Triangular, lobed leaves, low leaf area, yellow storage roots, medium yielding cultivar (14 t/ha).
3 Tinta Semi elliptic, triangular and lobed leaves, medium leaf area, light purple storage roots, good taste, low yielding cultivar (8 t/ha).
4 Wenda Lobed leave, lanceolate, lower leaf area, long vines, white storage roots, slightly watery, less sweet, no yield record.
5 Bonsari Deep lobed leaf, lanceolate, small leaf, low leaf area, long vines, yellow storage soot flesh, watery, no yield record.
Table 6.2 The sweet potato cultivars which similar morphological characteristics to those of cv Wanmun (high tuber yields under well watered condition) for drought tolerance screening trials. No. Name of cultivar Morphological characters 1 Worembay Cordate, higher leaf area, long vines, purple storage roots,
delicious taste, favoured by people, high yielding cultivar (22 t/ha).
2 Sanday Cordate, low leaf area, short vines, purple storage roots, delicious taste, medium yielding cultivar (15 t/ha).
3 Halaleke Cordate, long vines, higher leaf area, yellow storage roots, good taste but slightly watery, good yield potency.
4 Kuyake-1 Cordate leaf, long vines, higher leaf area, yellow storage roots, slight watery, less sweet, no yield record.
5 Paniai Triangular, lobed leaf, long vines, medium leaf area, red storage root skin, yellow flesh, good taste, no yield record.
220
6.3 POSSIBLE GRAFTING COMBINATIONS
Desirable characters of the root and vegetative parts of different plants can be combined
by grafting to produce plants that embody cv Lole’s tolerance to drought and cv
Wanmun’s high tuber yields (Section 5.5.2).
Therefore, it is likely that a similar result will be achieved when scions of local Papuan
cultivars (providing a water use efficient source such as those of cv Lole scions) are
grafted onto local rootstocks with a strong sink capacity (i.e. those similar to cv
Wanmun rootstocks). Such grafted combinations are expected to produce water use
efficient plants with high yield under water stress conditions.
6.4 IMPROVEMENTS TO LOCAL SWEET POTATO CULTIVATION SYSTEMS 6.4.1 Use of local soil amendments
Most of the highland Papuan soils have developed from limestone and are low in
nutrients, particularly nitrogen and potassium, but are rich in phosphorus (Schroo, 1963
in Sunarto and Rumawas, 1997). On the other hand, sweet potato requires nitrogen and
potassium to promote the vegetative growth and to increase tuber yields, respectively
(Sections 4.3.2 and 4.3.3). An excess of soil nitrogen should be avoided as this may
result in excessive top growth and depress tuber yields. Potassium additions are known
to increase water use efficiency in sweet potato (Section 4.3.5.2). For areas that
regularly experience droughts such the highlands of Papua, potassium fertilization will
not only contribute to elevated tuber yields, but also will help the plants cope better with
drought conditions. However, the introduction of chemical fertilizer is not feasible, as
there is no transport infrastructure connecting the remotes areas, and using inorganic
221

chemical fertilizers is very expensive in this region; if not used correctly, fertilizers
damage the environment.
In the highlands of Papua, pig and chicken manure are available as organic inputs for
sweet potato cultivation, but are not currently used. Tree legume mulch could also be
applied as source of nitrogen. To increase the amount of potassium in the soils of sweet
potato gardens, ash from firewood used by the local Papuans after cooking, can be
spread on the tops of raised beds. Wood ashes are rich in potassium (Soenarto and
Rumawas 1997) which can increase soil water retention (Section 4.3.5.2). These local
resources are widely available, and the indigenous people could benefit if they were to
begin to use such agronomic practices. At present, however, there is a culture of
keeping sweet potato gardens free of mulch, and this will need to be addressed through
an active extension programs.
The most common practice used by the indigenous Papuans to produce sweet potatoes
is shifting cultivation, which has been practiced from generation to generation both on
hill slopes and on flat areas. This system has evolved in response to low soil fertility by
rotating the cultivation areas over a 10 – 15 annual cycle until the first area has
regenerated and is ready to be re-cultivated. However, population growth has resulted in
a significant agricultural intensification - a trend which will continue in the foreseeable
future. As a consequence of more intense land use, soil nutrient contents may diminish
faster due to removal of cultivated crops and may result in soil nutrient deficiencies.
Nutrient replenishment by addition of soil amendments using available local resources
such as animal manures or tree mulches (source of nitrogen) and wood ashes (source of
K) to help alleviate this problem is recommended.
222

6.4.2 Use of better adapted cultivars
Sweet potato cultivation systems can also be improved through the introduction of
cultivars that are better adapted to ranges of various environmental constrain. For
instance, during dry periods, it is recommended that farmers cultivate drought tolerant
local cultivars and/or grafted combinations using cultivars similar to the cv Lole as the
scion on the rootstock of cultivars similar to cv Wanmun.
6.4.3 Other agronomic practices
Mounds will dry out quicker than flat garden beds, so the use of mounds should be
avoided for growing sweet potatoes during dry conditions. Low water tables do not
favor the roots of sweet potato plants extracting water from deeper soil layers when
grown in a mounded system.
Mulch and wood ash are good practices for sweet potato production as these techniques
are expected to reduce evaporation and conserve soil water under unfavorable dry
conditions. They may also keep the soil warmer during the times when frosts occur in
the higher altitudes of the highlands.
To avoid the complete failure of sweet potato production under extremely dry
conditions, some of the land that lies adjacent to water courses, and in the vicinity
swampy areas, can be used for sweet potato gardens.
The adoption of these methods separately or in combination may add greatly to the
knowledge of sustainability of sweet potato production and may reduce malnutrition
223

problems, and perhaps even eliminate deaths by starvation, that still occur regularly as a
consequence of droughts in the Papuan highlands.
224

CHAPTER 7
GENERAL CONCLUSIONS AND FUTURE RESEARCH DIRECTIONS
7.1 GENERAL CONCLUSIONS
The overall results of the present study of sweet potato cultivars are summarised in the
following conclusions:
• Water stress significantly reduced plant growth. Stem length, internode length, stem,
diameter, plant biomass, leaf area, and root mass all declined in plants grown under
water stressed conditions. The extent of the reduction in plant growth varied with
cultivars (Section 2.3.2). Some cultivars including Lole and Hawaii were less
affected, as indicated by a lower percentage of biomass reduction under water stress
(Section 2.3.2).
• Under water stress, the Lole and Hawaii cultivars were able to delay wilting and had
greater leaf water potentials, and thereby preserved their plant water status. They
also transpired lower amounts of water than the other cultivars indicating their
adaptation to dry conditions (Section 2.3.2).
• When grown under non-limiting water conditions in the field, the Beerwah Gold,
LO323, NG7570, Wanmun, Mariken, L46, L135, L3, and L49 cultivars produced
significantly higher tuber yields than the other cultivars. The lowest tuber yields
were from the Lole, Hawaii, Markham, L18, and L11 cultivars (Section 2.3.3). This
225

suggests that drought tolerant sweet potato cultivars tend to produce lower tuber
yields, and the higher yielding cultivars are more sensitive to drought conditions.
• The plant vegetative components and tuber yields of the Lole and Wanmun cultivars
declined when the soil water levels were reduced from 80% to 40% or 20% of soil
field capacity (Sections 3.5.2 and 3.5.5). The Wanmun cultivar produced the highest
plant mass and tuber yield under 80% of soil field capacity. On the other hand, cv
Lole grown at 40% of soil field capacity produced comparable average tuber sizes
as those of the Wanmun cultivar grown at 80% of soil field capacity. This suggests
that 40% of soil field capacity was not below the critical soil moisture content for
the development of tubers in cv Lole. Despite cv Wanmun producing greater shoot
mass, cv Lole produced the greatest dry mass of long, fibrous roots. An abundance
of fibrous roots that can penetrate deeply into the soil has been reported by several
authors to be associated with mechanisms for drought adaptation under field
conditions (Prakash, 1994; and Lin et al., 1996), while greater leaf area, higher
stomatal densities, and thinner leaf cuticles in cv Wanmun are consistent with its
high leaf transpiration rates and low drought tolerance (Sections 3.5.3 and 3.5.4).
• The plant water status of the Lole and Wanmun cultivars was affected by reducing
the soil water content. Leaf water potentials and leaf relative water contents declined
under increasing water stress, especially when transpiration was high at midday, and
was greater in cv Wanmun than in cv Lole (Section 3.5.3). When water stressed,
these cultivars transpired less water compared with corresponding well watered
plants, and cv Lole transpired less than cv Wanmun. The grafted plants followed a
similar pattern to that of the parent plants of the scions (Section 3.5.3). As a result,
226

cv Lole and the Lole scion grafted onto Wanmun rootstock were able to conserve
and utilize water efficiently under both well watered and water stressed conditions.
• Water stress caused a significant reduction in the concentration of leaf pigments
which varied with cultivars; cv Lole had greater leaf pigment concentration than cv
Wanmun under both well watered or water stressed conditions (Section 3.5.4). The
higher pigment concentration is associated with increased vigour and productivity
and suggest a higher relative tolerance to water stress. The chlorophyll a/b ratio
increased in both cultivars grown under water stress conditions, and cv Wanmun
had a higher ratio than cv Lole and the combinations of grafted plants, indicating
relatively poor drought tolerance of the cultivar (Section 5.5.5).
• Stomatal density was not affected by water stress in any of the sweet potato planting
materials used in the present study (Sections 3.5.4 and 5.5.5). The Wanmun cultivar
leaves carried a greater stomata density than the cv Lole leaves, and the lengths of
its guard cells and the thickness of the cv Wanmun leaf cuticles were greater under
well-watered conditions. The non-grafted cv Lole and the Lole scions grafted onto
Wanmun rootstocks had smaller leaf areas, fewer stomata, and slightly thicker leaf
cuticles than the cv Wanmun and the Wanmun scions grafted onto Lole rootstocks
(Sections 5.5.3 and 5.5.5). This shows that the anatomical features of the grafted
plants were similar to those of the parent plants of the scions. In all cases the
grafted plants had similar transpiration patterns and water-use efficiencies as the
parent plants of the scions.
227
• The sweet potato cultivars grown under non-limiting water conditions produced
lower sucrose and greater starch contents than those grown under water stressed
conditions. The tubers of cv Lole had significantly higher sucrose and lower starch
contents at harvest compared with those of cv Wanmun (Section 3.5.4). These
factors play a major role in determining the food preferences of the indigenous
Papuans.
• Tuber yields decreased when the soil water content was reduced, and the Wanmun
cultivar was more affected than cv Lole (Section 3.5.5). On the other hand, the
number of tubers was not affected by water stress in cv Wanmun. The Lole cultivar
grown under non-limiting water conditions produced a significantly higher number
of tubers, but their sizes were significantly smaller than those of the same cultivar
grown under water stresses at 20% and 40% of soil field capacity. In terms of
marketable tubers, the Lole cultivar grown at 40% of soil field capacity produced
comparable tuber quality and sizes to those of cv Wanmun grown under non-
limiting water conditions.
• The Lole cultivar yielded lower tuber masses per plant than those of cv Wanmun.
This suggests that tuber yield depends greatly not only on soil water contents, but
also on the cultivar (Sections 2.3.3.1 and 3.5.5).
• In a grafting trial, cv Lole scions grafted onto Wanmun rootstocks produced the
greatest tuber mass compared with those produced by from non-grafted cv Lole and
cv Wanmun plants under water stress conditions (Section 5.5.4). On the other hand,
cv Wanmun scions were incompatible when grafted onto Lole rootstocks and
228

produced relatively few tubers. It can be concluded that the scion controlled the
growth and development of vegetative plant parts, and the rootstock controls the
functioning of the tubers as storage organs.
• Plants consisting of Lole scions grafted onto Wanmun rootstocks produced the
highest harvest index, showing that the ability of plants to develop storage roots was
determined by efficient top growth (leaves and stems) and root growth, and also by
a strong sink capacity in the root (tubers).
• Water use increased rapidly during vegetative growth of all of the sweet potato
planting materials studied, but stabilized toward maturity (Section 3.5.3). As a
consequence of reduced biomass production under water stress, water use by the
non-grafted and grafted plants was lower during the entire growth stage when the
water supply was limited to 30% of soil field capacity. The non-grafted cv Wanmun
and the Wanmun scions grafted onto Lole rootstocks used relatively large amounts
of water as a consequence of abundant, actively transpiring leaf surfaces (Section
5.5.6).
• Low soil nitrogen and potassium supplies led to decreased plant growth and yield,
and thereby reduced the water-use efficiency of all of the planting materials studied
(Sections 4.3.2; 4.3.3 and 4.3.5). The significantly greater water-use efficiency
under water stress in cv Lole and Lole scions grafted onto Wanmun rootstocks was
attributed to low transpiration rates as a result of small leaf surface areas, few
stomata, and thick leaf cuticles in these plants (Sections 4.3.2 and 4.3.5 and 5.5.5).
229

• Nitrogen and potassium inputs of 100 kg/ha and 160 kg/ha, respectively, were found
to be optimal for tuber yields of sweet potato cultivars grown under both well
watered and water stressed conditions (Section 4.3.3). A greater nitrogen supply
resulted in increasing the vegetative plant parts and reducing tuber yields. A lack of
nitrogen resulted in low chlorophyll synthesis that affected overall photosynthesis
and plant metabolism processes and became evident in stunted growth and reduced
tuber yields. Increasing the potassium supply increased tuber yields but not the
vegetative plant parts when the nitrogen supply was optimal.
7.2 FUTURE RESEARCH DIRECTIONS
The present study has produced useful information in relation to the effects of drought
on water relations of a range of sweet potato cultivars. The data have helped to develop
new understandings of some of the physiological mechanisms that underpin drought
tolerance and drought susceptibility in sweet potato. The interactions between genotype
and environmental constraints, including drought, require further study to produce the
best-adapted cultivars with high tuber yield potentials and suited to different local
conditions.
There are several projects that may be addressed in the future:
• Different agro-ecological conditions may produce different growth responses in the
cultivars studied in the present project. Therefore, the principles of the present
project should be applied in local environments with local cultivars. In order to
adopt the present research technology, simple techniques should be introduced to
meet local needs in areas of subsistence agriculture.
230

• In dealing with intermittent drought conditions, selection for genotypes that have
greater transpiration efficiency and high tuber yields may be a useful approach in
sweet potato breeding programs. However, the performance of a wide range of
genotypes should be studied under different growing conditions throughout the year.
Research institutions, scientists, extension officers, and local farmers should work
cooperatively in order to manage existing cultivars better, and to ensure successful
outcomes from field-based projects.
• Some of the more detailed physiological aspects of sucrose and starch production by
sweet potatoes could not be answered by the present project and might be a priority
for future projects. For example, the sucrose content of tubers of drought resistant
cultivars increased under water stress conditions (Section 3.5.4). It has been
reported by Premachandra et al. (1992) that an increase in solutes in the plant cell
sap, including sucrose and inorganic substances such as potassium and nitrogen,
may contribute to increased osmotic potential, hence increasing water use
efficiency.
• The grafting method needs further study, as it was observed that tuber yield was
poor when the Lole cultivar was used as a rootstock (Section 5.5.4). This was
attributed to the incompatibility between the small diameter of cv Lole rootstock
and greater diameter of the cv Wanmun scion. Grafting studies might be carried out
with different sweet potato cultivars that may produce compatible stem sizes, and
more successful grafting unions.
231

• A future project associated with nutrient analysis could be carried out on leaves,
whole plant tissues, and tubers in a time series (from 1 month after planting until
harvest) to observe nutrient assimilation and distribution patterns. The nutrient
analyses of the present trial were conducted when the plants were mature.
Interpreting trends in nutrient analyses needs comprehensive observations from
early vegetative stages, when the mobility of nutrients is slow and tubers are
undeveloped, until the plants mature.
7.3 EXTENSION OF RESEARCH RESULTS
Extension activities in the near future should focus on:
• Set up sweet potato production nurseries as demonstration plots for local farmers to
demonstrate a range of varieties with desirable characters, and to demonstrate the
benefits of grafting sweet potato cultivars using a simple grafting technique with
simple tools such as drinking straws, ice block wrappers, and raffia rope which local
people can easily use and adopt.
• Demonstrate the efficiency of sweet potato cultivation through the integration of
sweet potatoes with tree legumes in crop production systems, in demonstration plots
in gardens on research stations, and in community gardens. Apply chicken and pig
litter or legume mulches (nitrogen sources) and wood ash (potassium source) to help
maintain soil fertility, to conserve soil water, and to minimise the effects of
extremely cold conditions.
• Conduct demonstrations on the land of local farmers aimed at determining the
effects of pig and chicken manures on the yield of sweet potato, as there is currently
232
little or no use of organic manures by indigenous Papuans. In fact, the use of these
wastes, which may contribute to the sustainability of soil management practices,
have been overlooked by the highland Papuan people.
• The Indonesian government, through the Department of National Education,
Jakarta, and the Department of Agriculture, Papua Province, has recently provided
funding for a follow-up project to the work presented in this thesis using local sweet
potato cultivars. This research is about to start using 10 prominent cultivars which
are morphologically similar to either Lole cultivar in relation to smaller leaf area, as
an indication of drought tolerance as a result of low evapotranspiration, or are
similar the Wanmun cultivar for their high tuber yielding and eating quality (Tables
6.1 and 6.2). The initial trial will identify drought tolerant and susceptible cultivars.
This will then be followed up with a series of grafting trials using the local Papuan
cultivars to produce grafted plants with a strong sink capacity (i.e. those similar to
cv Wanmun rootstocks) and a water use efficient source (i.e. as those similar to cv
Lole scions) to produce water use efficient plants with high yields under water stress
conditions. The results of these trials should provide a wider range of food
production strategies for the sweet potato farmers of the Papuan highlands.
233
REFERENCES
Abdollahian-Noghabi M and Froud-Williams RJ (1998) Effects of moisture stress and re-watering on growth and dry matter partitioning in three cultivars of sugar beet. Aspects of Applied Biology 52, 71-78.
Alberte RS and Thornber JP (1977) Water stress effects on the content and organization
of chlorophyll in mesophyll and bundle sheath chloroplasts of maize. Plant Physiology 59(3), 351-353.
Allison ML, Ammerman GR, Garner JO, Hammett HL, Singletary C, Withers FT,
Palmertree HD (1981) Vardaman, a new early maturing sweet potato variety for Mississippi. Mississippi Agricultural and Forestry Experiment Station, Information Sheet 1305, Mississippi.
Alves AAC and Setter TL (2000) Response of cassava to water deficit. Crop Science
40, 131-137. Anderson JM (1986) Photoregulation of the composition, function and structure of the
thylakoid membranes. Annual Review of Plant Physiology 37, 93 136. Andrews PK and Marquez CS (1999) Graft incompatibility. Horticulture Reviews 23,
183-231. Apaseray MG, Saraswati P, Chadikun P (2001) Morphological characteristic and tuber
culinary test of Papuan highland sweet potato (Ipomoea batatas L.). Hyphere Journal 6(2), 6-14.
Anselmo BA, Ganga ZN, Badol EO, Heimer YM, Nejidat A (1998) Screening sweet
potato for drought tolerance in the Philippine highlands and genetic diversity among selected genotypes. Tropical Agriculture, Trinidad. 75, 189-196.
Asher C, Grundon N, Menzies N (2002) How to unravel and solve fertility problems.
ACIAR Monograph No. 83. ACIAR. Canberra. Ashraf MY, Azmi AR, Khan AH, Ala SA (1994) Effect of water stress on total phenols
peroxidase activity and chlorophyll content in wheat (Triticum aestivum L.). Acta of Plant Physiology 16, 185-191.
Ashraf M, Ashfag M, McNeilly T (2001) Growth and photosynthetic characteristics in
pearl millet under water stress and different potassium supply. Photosynthetica 39 (3), 389-394.
Atwell B, Kriedemann P, Turnbull C (1999) Plants in action. Adaptation in nature,
performance in cultivation. MacMillan Education Australia Pty. Ltd. South Yarra, Victoria.
234

Ballard C (1999) Condemned to Report History. Enso-related drought and famine in Irian Jaya, Indonesia, 1997-1998. In ‘A Special report’. Resource Management in Asia Pacific Project, Division of Pacific and Asian History, Research School of Pacific and Asian Studies, Australian National University, Canberra.
Barden JA (1977) Apple tree growth, photosynthesis, dark respiration, and specific leaf
weight as affected by continuous and intermittent shade. Journal of American Society Horticulture Science 102(4), 391-394.
Beadle CL, Ludlow MM, Honeysett JL (1993) Water relations. In ‘Photosynthesis and
production in a changing environment: a field and laboratory manual’. Eds. DO Hall, JMO Scurlock, HR Bolhar-Norednkampf, RC Leegod, and SP Long. Chapman & Hall; London. 113-128 pp.
Beekman AGB and Bouma WF (1986) A possible screening technique for drought
tolerance in potato. In’ Potato research of tomorrow. Drought tolerance, Virus resistance and analytic breeding methods’. Proceedings of An International Seminar, Wageningen, Netherlands, 30-31 October 1985. Centre for Agricultural Publishing and Documentation; Wageningen. 55-64 pp.
Begg JE and Turner NC (1976) Crop water deficits. Advances in Agronomy 28, 161-
217. Beringer H and Nothdurft F (1985) Effects of potassium on plant and cellular structures.
In ‘Potassium in agriculture’. Ed. ED Munson. American Society of Agronomy - Crop Science Society of America - Soil Science Society of America; Madison, Wisconsin, USA. 352-368 pp.
Bhagsari AS and Harmon (1982) Photosynthesis and photosynthate partitioning in
sweet potato genotypes. Journal of American Society Horticulture Science 107, 506-510.
Bhagsari AS and RH Brown (1986) Leaf photosynthesis and its correlation with leaf
area. Crop Science 26, 127-132. Bhagsari AS (1990) Photosynthetic evaluation of sweet potato germplasm. Journal of
American Society Horticulture Science 115, 634-639. Blum A, Mayer J, Gozlan G (1983) Associations between plant production and some
physiological components of drought resistance in wheat. Plant Cell and Environment 6, 210-225.
Blum A, Mayer J, Golan G (1989) Agronomic and physiological assessment of
genotypic variation for drought resistance in sorghum. Australian Journal of Agriculture Research 40, 49-61.
Blum A (2000) Towards standard assays of drought resistance in crop plants.
http://www.cimmyt.C/WSMolecular/WsdroughtTowards.htm [Accessed: 28/07/2000 at 16:39 pm].
235

Bourke RM (1984) Growth analysis of four sweet potato (Ipomoea batatas) cultivars in Papua New Guinea. Tropical Agriculture, Trinidad 61, 177-181.
Bourke RM (1985) Influence of nitrogen and potassium fertilizer on growth of sweet
potato (Ipomoea batatas) in Papua New Guinea. Field Crop Research 12, 363-375. Bourke RM (1989) Influence of soil moisture extremes on sweet potato yield in the
Papua New Guinea Highlands. Mountain Research and Development 9(3), 322-328. Bouwkamp JC (1983) Growth and partitioning in sweet potatoes. Annals of Tropical
Research 5(2), 53-60. Bouwkamp JC (1989) Differences in mid-day wilting and yield among sweet potato
genotypes. Journal of American Society Horticulture Science 114(3), 383-386. Boyer JS (1982) Plant productivity and environment. Science 219, 443-448. Bradford KJ and Hsiao TC (1982) Physiological response to moderate stress. In’
Encyclopaedia of plant physiology. Physiological plant ecology II. Water relations and carbon assimilation’. Eds. OL Lange, PS Nobel, CB Osmond, and H Ziegler. Heidelberg Springer; New York, Berlin. 263-324 pp.
Brown RH (1992) Photosynthesis and plant productivity in sweet potato. In ‘Sweet
potato technology for the 21st century’. Eds. WA Hill, CK Bonsi, PA Loretan. Tuskegee University; Tuskegee, Alabama. 273-281 pp.
Brown RW and Oosterhuis (1992) Measuring plant and soil water potentials with
thermocouple psychrometer: some concerns. Review and interpretation. Agronomy Journal 84, 78-86.
Buttery BR, Tan CS, Buzzell RI, Gaynor JD, MacTavish DC (1993) Stomatal numbers
of soybean and response to water stress. Plant and Soil 149(2), 283-288. Campbell CS and McInnes KJ (1999) Response of in situ leaf psychrometer to cuticle
removal by abrasion. Agronomy Journal 91, 859-862. Cellier F, Conejero G, Breitler JC, Casse F (1998) Molecular and physiological
responses to water deficit in drought-tolerant and drought sensitive lines of sunflower. Accumulation of dehydrin transcripts correlates with tolerance. Plant Physiology 116, 319-328.
Cenderawasih Pos (1998) Badai El Nino menyebabkan bencana kelaparan di
pegunungan tengah Jaya Wijaya. Local Papua Newspaper (In Indonesian Language).
Chandrasekar V, Sairam RK, Srivastava GC (2000) Physiological and biochemical
responses of hexaploid and tetraploid wheat to drought stress. Journal of Agronomy and Crop Science 185, 219-227.
236

Cock JH, Porto MCM, El-Sharkawy MA (1985) Water use efficiency of cassava III. Influence of air humidity and water stress on gas exchange of field grown cassava. Crop Science 25, 265-272.
Collins WW (1995) Sweet potato. http://www.hort.purdue.edu/newcrop/sweetpotato.html
[Accessed: 9/12/00 at 8:40 am]. Collin P (2001) Plant adaptation to environmental conditions. Année Biologique 40, 21-
42 (CAB International, 2002. Accessed: 5/4/2002 at 12.30 pm). Connor DJ and Cock JH (1981) Response of cassava to water shortage II. Canopy
dynamics. Field Crop Research 4, 285-296. Constantin RJ, Hernandez TP, Jones LG (1974) Effects of irrigation and nitrogen
fertilization on quality of sweet potato. Journal of American Society Horticulture Science 99, 308-310.
Cornish K and Zeevaart JAD (1984) Abscisic acid metabolism in relation to water stress
and leaf age in Xanthium strumarium. Plant Physiology 76, 1029-1035. Dahlin C (1988) Correlation between pigment contribution and apoproterm of the light
harvesting complex II (LHC II) in wheat (Triticum aestivum). Plant Physiology 74, 342-348.
Da Matta FM, Chaves ARM, Pinheiro HA, Ducatti C, Loureiro ME (2003) Drought
tolerance of two field-grown clones of Coffea canephora. Plant Science 164, 111-117.
Del Campo GM, Ruiz C, Baeza P, Lissarrague JR (2003) Drought adaptation strategies
of four grapevine cultivars (Vitis vinifera L.): modification of the properties of the leaf area. Journal International des Sciences de la Vigne et du Vin. 37(3), 131-143. (CAB International, 2004. Accessed: 12/12/2004 at 11.40 am).
Devlin RM and Witham FH (1983) Plant physiology. 4th ed. Willard Grant Press;
Boston. Draycott AP (1993) Nutrition. In’ The sugar beet crop, science into practice’. Eds. DA
Cooke and RK Scott. Chapman and Hall; London. 239-278 pp. Duke JA (1983) Ipomoea batatas (L.) Lam. Handbook of Energy Crop (unpublished).
Available from:http://www.hort.purdue.edu/newcrop/duke_energy/Ipomoea_batatas.html [Accessed on 9/12/00 at 8:39 am].
Eguchi T, Kitano KM, Eguchi H (1998) Water relations and dynamics of tuber growth
rate in sweet potato plants (Ipomoea batatas Lam.). Environment Control in Biology 36(2), 91-95.
237
Ekanayake IJ (1997) Evaluation of potato and sweet potato genotypes for drought resistance. In ‘Sweet potato germplasm management training manual’. Ed. Z Huaman. International Potato Center (CIP); Lima, Peru. Sect.3.5; 2-9 pp.
Ekanayake IJ and Collins WW (2004) Effects of irrigation on sweet potato root
carbohydrates and nitrogenous compounds. Journal of Food, Agriculture and Environment 2(1), 1459-1463.
El-Sharkawy MA and Cock JH (1984) Water use efficiency of cassava I. Effects of air
humidity and water stress on stomatal conductance and gas exchange. Crop Science 24, 497-502.
Estill K, Delaney RH, Smith WK, Ditterline RL (1991) Water relations and productivity
of alfalfa leaf chlorophyll variants. Crop Science 31, 1229-1233. Evans JR (1996) Developmental constraints on photosynthesis: effects of light and
nutrition. In ‘Photosynthesis and the Environment’. Ed. NR Baker. Kluwer Academic Publishers; Dordrecht, The Netherlands. 281 304 pp.
Evenari M, Lange OL, Schulze ED, Kappen L, Buschbom U (1977) Net photosynthesis,
dry matter production, and phenological development of apricot trees (Prunus armeniaca L.) cultivated in the Negev Highlands Israel. Flora 166, 383-414.
Fischer RA and Turner NC (1978) Plant productivity in the arid and semiarid zones.
Annual Review Plant Physiology 29, 277-317. Garner Jr JO, Phromtong C, Newell L, Woods FM, Silva JL (1992) Chilling and
drought stress tolerance in selected sweet potato genotypes. In’ Sweet potato Technology for the 21st Century’. Eds. WA Hill, CK Bonsi, and PA Loretan. Tuskegee University, Tuskegee, AL. 318-324 pp.
Garnier E, Shipley B, Roumet C, Laurent G (2001) A standardized protocol for the
determination of specific leaf area and leaf dry matter content (technical report). Functional Ecology 15, 688-695.
Geigenberger P, Reimholz R, Deiting U, Sonnewald U, Stitt M (1999) Decreased
expression of sucrose phosphate synthase strongly inhibits the water stress-induced synthesis of sucrose in growing potato tubers. The Plant Journal, 19(2), 119-129.
George MS, Lu G, Zhou W (2002) Genotypic variation for potassium uptake and
utilization efficiency in sweet potato (Ipomoea batatas L.). Field Crops Research 77(1), 7-5.
Ghuman BS and Lal R (1983) Mulch and irrigation effects on plant-water relations and
performance of cassava and sweet potato. Field Crops Research 7, 13-29. Goswami SB, Sen H, Jana PK (1995) Tuberization and yield potential of sweet potato
cultivars as influenced by water management practises. Journal of Root Crops 21(2), 77-81.
238

Hahn SK (1977) Sweet Potato. In’ Ecophysiology of tropical crops’. Eds. Paulo de T. Alvin and TT Kozlowski. Academic Press; New York. 237-248 pp.
Hahn SK and Hozyo Y (1984) Sweet potato. In ‘The physiology of tropical field crops’.
Eds PR Goldsworthy, NM Fisher. John Wiley & Sons; United Kingdom 551-567 pp.
Haider SA and Paul NK (2003) Physio-biochemical investigations on four bread wheat
cultivars under different irrigation regimes. Bangladesh Journal of Botany 32(1), 39-42.
HaiQiu Y, ZhiHai W, XiuYing S, KeZhang X (2003) Changes of stomatal density,
length, width and microstructure of maize leaves under water stress. Journal of Jilin Agricultural University 25(3), 239-242. (CAB International, 2005. Accessed: 5/1/2005 at 11.30 am).
Hammet HL, Constantin RJ, Jones LG, Hernandez TP (1982) The effect of phosphorous
and soil moisture levels on yield and processing quality of ‘Centennial” sweet potatoes. Journal of American Society Horticulture Science 107(1), 119-122.
Hameed M, Mansoor U, Ashraf M, Rao AR (2002) Variation in leaf anatomy in wheat
germplasm from varying drought-hit habitats. International Journal of Agriculture 4 (1), 12-16. (CAB International, 2003. Accessed: 29/12/2003 at 11.30 am).
Hartemink AE, Johnston M, O’Sullivan JN, Poloma S (2000) Nitrogen use efficiency of
taro and sweet potato in the humid lowlands of Papua New Guinea. Agriculture, Ecosystems and Environment 79, 271-280.
Hill WA (1984) Effect of nitrogen nutrition on quality of three important root/tuber
crops. In ‘Nitrogen in crop production’. Ed. Hauck RD. American Society Agronomy, Soil Science Society of America and Crop Science Society of America. Madison, WI 627-641 pp.
Hill WA, Loretan PA, Bonsi CK (1984) The sweet potato for space missions-controlled
environmental life support systems. George Washington Carver Agriculture Experimental Station, Tuskegee University. Monograph no.1, 66 pp.
Hinckley TM (1973) Responses of black locust and tomato plants after water stress.
Horticulture Science 8, 405-407. Hirasawa T (2001) Physiological characterization of the rice plant for tolerance of water
deficit. In’ Genetic improvement of rice for water-limited environments’. Eds. J O’Toole, O Ito, and B Hardy. Proceedings of a workshop, 1-3 December, 1998. Los Banos, Laguna, Philippines. http://www.cgiar.org/irri/AbstractsWaterlimited.htm [Accessed on 5/14/01 at 4:00 pm].
Holwerda HT and Ekanayake IJ (1991) Establishment of sweet potato stem cuttings as
influenced by size depth of planting water stress hormones and herbicide residues for two genotypes. Scientia Horticulturae 48, 193-204.
239

Hopkins WG (1999) Introduction to plant physiology’. 2nd edition. John Wiley & Sons, Inc; New York.
Hsiao TC and Lauchli A (1986) Role of potassium in plant water relations. Advanced in
Plant Nutrition 2, 281-312. Huaman Z (1992) Descriptor for sweet potato. International Potato Centre, Asian
Vegetable Research and Development Centre (AVRDC), International Board for Plant Genetic Resources (IBPGR). Lima, Peru.
Huaman Z (1997) Botany, origin, evolution and biodiversity of the sweet potato. In
‘Sweet potato germplasm management training manual’. Ed. Z Huaman. International Potato Center (CIP); Lima, Peru.
Huang B and Gao H (2000) Root physiological characteristics associated with drought
resistance in tall fescue cultivars. Crop Science 40, 196-207. Hurd EA (1974) Phenotype and drought tolerance in wheat. Agriculture Meteorology
14, 39-55. Ike IF and Thurtell GW (1981) Response of indoor-grown cassava to water deficits and
recovery of leaf water potential and stomatal activity after water stress. Journal of Experimental Botany 32, 1029-1034.
Indira P (1989) Drought tolerant traits in sweet potato genotypes. Journal of Root Crops
15, 139-144. Indira P and Kabeerathumma S (1988) Physiological response of sweet potato under
water stress. 1. Effect of water stress during the different phases of tuberization. Journal of Root Crops 14(2), 37-40.
International Potato Center (CIP) (1998) CIP sweet potato facts.
http://www.cipotato.org/data/sweetpotato/facts/swtpfact.htm [Accessed: 8/2/00 at 11:48 am].
Jones ST (1961) Effect of irrigation at different levels of soil moisture on yield and
evapotranspiration rate of sweet potato. Proc. Am. Soc. Hortic. Sci. 77, 458-462. Jones MM, Osmond CB, Turner NC (1980) Accumulation of solutes in leaves of
sorghum and sunflower in response to water deficits. Australian Journal of Plant Physiology 7, 193-205.
Jones MM, Turner NC, Osmond CB (1981) Mechanisms of drought resistance. In ‘The
physiology and biochemistry of drought resistance in plants’. Eds. LG Paleg and D Aspinall. Academic Press; Sydney, Australia. 15-37 pp.
Jayawardena T (1984) Phosphorus fertilizer and organic matter effect on yield of sweet
potato. Asian Regional Center-The Asian Vegetable Research and Development. http://www.arc-avrdc.org/html_files/research-sweetpotato.html [Accessed: 12/4/2003 at 5:30 pm].
240

Kaiser WM (1987) Effects of water deficit on photosynthetic capacity. Physiol. Plant
71, 142-149. Karyudi (2001) Osmoregulative capacity in birdseed millets (Setaria italica L. and
Panicum miliaceum L.) in response to water stress. Summary of PhD thesis. http://www.newscrops.uq.edu.au/people/peo-7.htm [Accessed 5/14/01 at 3:21 pm].
Kay DE (1973) Root crops. In ‘Crop and product digest 2’. Tropical Products Institute,
London. 240 pp. Kays SJ (1985) The physiology of yield in sweet potato. In’ Sweet potato products: A
natural resource for the tropics’. Ed. JC Bouwkamp. CRC Press; Boca Raton, Florida. 79-132 pp.
Kelm M, Bruck H, Hermann M, Sattelmacher (2000) Plant productivity and water use
efficiency of sweetpotato (Ipomoea batatas) as affected by nitrogen supply. International Potato Centre Program Report 1999-2000. International Potato Centre (CIP), Lima, Peru.
Kirnak H, Kaya C, Tas I, Higgs D (2001) The influence of water deficit on vegetative
growth, physiology, fruit yield and quality in eggplants. Bulgarian Journal of Plant Science 27(3-4), 34-46.
Kramer PJ (1980) Drought stress and the origin of adaptation. In ‘Adaptation of plants
to water and high temperature stress.’ Eds. NC Turner and PJ Kramer. John Wiley & Sons; New York. 7-20 pp.
Kramer PJ (1983) Water relations of plant. Academic Press Inc.; San Diego, CA. 342-
415 pp. Kriedeman PE (1986) Stomatal and photosynthetic limitations to leaf growth. In ‘Plant
growth, drought and salinity’. Eds. NC Turner and JB Passioura. CSIRO Australia. 15-31 pp.
Kuo G and Chen HM (1992) Source-sink relationships of sweet potato. In ‘Sweet potato
technology for the 21st century’. Eds. WA Hill, CK Bonsi, PA Loretan. Tuskegee University, Tuskegee, Alabama. 282-295 pp.
Lambers H, Chapin III FS, Pons TL (1998) Plant physiological ecology. Springer; New
York. Larcher W (1995) Physiological plant ecology. 3rd ed. Springer-Verlag; New York. Leopold AC (1964) Plant growth and development. McGraw-Hill Book Company; New
York. 393-409 pp. Levitt J (1972) Responses of plants to environmental stresses. Academic Press; New
York. 322-446 pp.
241

Lin ZBZ, Guo LJ, Guo KJ (1996) Relationship of hydraulic capacitance and drought endurance of plants. Journal of Plant Resources and Environment 5(2), 23-27.
Losch R, CR Jensen, MN Andersen (1992) Diurnal courses and factorial dependencies
of leaf conductance and transpiration of differently potassium fertilized and watered field grown barley plants. Plant Soil 140, 205-224.
Lu Z, Tamar K, Neumann PM, Nevo E (2000) Physiological characterization of drought
tolerance in wild barley (Hordeum spontaneum) from Judean desert. Barley Genetics Desert Vol. 29. http://wheat.pw.usda.gov/ggpages/bgn/29/a29-09.html [Accessed: 3/13/01 at 2:58 pm].
Ludlow MM (1989) Strategies in response to water stress. In ‘Structural and functional
responses to environmental stresses: Water Shortage’. Eds. KH Kreeb, H Richter, and TM Hinckley. SPB Academic Publishing; London. 269-282 pp.
Ludlow MM and Muchow RC (1990) A critical evaluation of traits for improving crop
yields in water-limited environments. Advanced in Agronomy 43, 107-153. Luh CL and Moowaw JC (1979) Present role and future outlook for sweet potato in
tropical Asia research and development needs. In ‘Proceedings of the Symposium of the International Society for Tropical Root Crops’. Manila, Philippines. 5-7 pp.
Mansfield TA and Davies WJ (1981) Stomata and stomatal mechanisms. In ‘The
physiology and biochemistry of drought resistance in plants’. Eds. LG Paleg and D Aspinal. Academic Press; Sydney, Australia. 315-346 pp.
Mansfield TA and Atkinson CJ (1990) Stomatal behaviour in water stressed plants. In’
Stress responses in plants: Adaptation and acclimation Mechanism’. Eds. RG Alscher and JR Cumming. Wiley-Liss; New York. 241-264 pp.
Marcum KB,.Engelke MC, Morton SJ, White RH (1995) Rooting characteristics and
associated drought resistance of zoysiagrass. Agronomy Journal 87, 534-538. Marschner H (1995) Mineral nutrition of higher plants. 2nd ed. Academic Press;
London. 889 pp. Marti HR and Mills HA (2002) Nitrogen and potassium nutrition affect yield, dry
weight partitioning, and nutrient-use efficiency of sweet potato. Commun. Soil Sci. Plant Anal. 33(1&2), 287-301.
Martin FW (1988) Sweet potato. http://echonet.org/Technotes/sweetpotato.htm
[Accessed: 27/07/00 at 16:18 pm]. McCraw D (2000) Sweet potato production.
http://agweb.okstate.edu/pearl/hort/vegetables/f6022.htm [Accessed: 9/12/00 at 8:47 am].
242

Medina AJF, Gallegos AJA, Posadas RM, Shibata JK, LŐpez TC (2002) Morphological differences on the leaf epidermis of common bean and their relationship to drought tolerance. Agricultura Técnica en México 28(1), 53-64. (CAB International, 2003. Accessed: 12/12/2003 at 16.35 pm).
Monneveux P and Belhassen E (1996) The diversity of drought adaptation in the wide. Plant Growth Regulation 20, 85-92.
Morgan JM (1984) Osmoregulation and water stress in higher plants. Annual Review
Plant Physiology 35, 299-319. Morris HG, Ephrathl JE, Hesketh JD, Hummel JW (1998) Maize root growth under
water, nitrogen, and weed stress. Agricultural Research Service, United States Department of Agriculture.
Http://www.nal.usda.gov/ttic/tektran/categoryV3/Agrochemical_Technology.html [Accessed: 5/11/00 at 5:47 pm].
Mortlock MY and Fukai S (1998) Osmotic adjustment of sorghum genotypes under two nitrogen levels in the field. School of Land and Food, The University of Queensland, Brisbane, Queensland. http://www.regional.org.au/asa/1998/4/253mortlock.htm [Accessed: 5/1/2005 at 10:30 am].
Mullet JE and Whitsitt MS (1996) Plant cellular responses to water deficit. Plant
Growth Regulation 20, 119-124. Mukhopadhyay SK, Sen H, Jana PK (1992) Effect of potassium on growth and yield of
sweet potato. Journal of Root Crops 18(1), 10-14. Mukhopadhyay SK, Sen H, Jana PK (1999) Dry matter accumulation, starch and NPK
concentration in sweet potato as influenced by planting materials. Journal of Root Crops 25(1), 79-83.
Nair GM and Nair VM (1995) Influence of irrigation and fertilizers on the growth
attributes of sweet potato. Journal of Root Crops 21, 17-23. Naskar SK and Roychowdhury (1995) Genotypic variation in relative water content and
nitrate reductase activity in sweet potato under field drought condition. Journal of Root Crops 21(1), 46-49.
Newell LL (1991) Screening sweet potato genotypes (Ipomoea batatas L. Lam) for
drought tolerance. Abstract of MS thesis. Mississippi State University, Mississippi. (Unpublished).
Newell LL, Garner JO, Silva JL (1994) Estimation of drought tolerance in sweet potato.
International Journal of Experimental Botany 12(56), 119-125. Nobel PS (1980) Leaf anatomy and water use efficiency. In ‘Adaptation of plants to
water and high temperature stress’. Eds. NC Turner and PJ Kramer. John Wiley & Sons; New York. 43-55 pp.
243

Nonami H and Boyer JS (1989) Turgor and growth at low water potentials. Plant
Physiology 89, 798-804. Nordenkampf HB and Lechner E (1988) Temperature and light dependent modification
of chlorophyll fluorescence kinetics in spruce needle during water stress. Photosynthetic Res. 18, 287.
Norman MJT, Pearson CJ, Searle PGE (1995) Sweet potato (Ipomoea batatas). In ‘The
ecology of tropical food crops’. 2nd ed. Cambridge University Press. 291-304 pp. O’Hair SK (1990) Tropical root and tuber crops. In ‘Advances in new crops’. Eds. J
Janick and JE Simon. Timber Press; Portland, Oregon. 424-428 pp. Onwueme IC (1978) The tropical tuber crops: Yams, cassava, sweet potato and
cocoyams. John Wiley & Sons; Chic`hestar, Great Britain. 234 pp. Onwueme IC and Charles WB (1994) Tropical root and tuber crops. Production,
perspectives and future prospects. Food and Agriculture Organization (FAO) of the United Nations. Plant Production and Protection Paper No. 126, Rome. 122 pp.
O’Sullivan JN, Asher CJ, Blamey FPC (1997) Nutrient disorders of sweet potato.
Australian Centre for International Agricultural Research. Canberra, Australia. 53-54 pp.
O’Toole JC and Chang TT (1979) Drought resistance in cereals. Rice: A case study. In
‘Stress physiology in crop plants’. Eds. H Mussels and R Staples. Wiley and Sons; New York. 373-406 pp.
Parimelazhagan T and Francis K (1996) Effects of water stress and salinity on
photochemical activity of green gram (Vigna radiata L.). Bioved. 7(1), 47-52. (In, CAB International, 2002. Accessed: 1/11/2002 at 12.30 pm).
Passioura JB (1996) Drought and drought tolerance. Plant Growth Regulation 20, 79-
83. Peet M (2000) Sweet potato. Production practices. http://www.cals.ncsu.edu/sustainable/peet/profiles/pps_pot.html [Accessed 9/11/00
at 4:00 pm]. Peters D and Wheatley C (1997) Small scale agro-enterprises provide opportunities for
income generation: sweet potato flour in East Java, Indonesia. http://www.eseap.cipotato.org/Library/SP-Flour.html [Accessed: 9/4/00 at 6:23pm].
Peters D (2001) Local human-sweet potato-pig systems. Characterization and research
in Irian Jaya, Indonesia with limited reference to Papua New Guinea. International Potato Center (CIP) and the Australian Council for International Agricultural Research (ACIAR).
244

Pier PA and Berkowitz GA (1987) Modulation of water stress effects on photosynthesis by altered leaf K. Plant Physiology 85, 665-661.
Prain G and Widyastuti CA (1998) Sweet potato conservation means survival for Irian
Jaya families. UPWARD Fieldnotes Vol.7 No.1 June 1998, 5-6 pp. Prakash CS (1994) Sweet potato biotechnology: Progress and potential. Biotechnology
and development monitor 18,18-19 http://www.pscw.uva.nl/monitor/1811.htm [Accessed: 9/5/00 at 5:55 pm].
Prakash M and Ramachandran K (2000) Effects of chemical ameliorants on stomatal
frequency and water relations in brinjal (Solanum melongena L.) under moisture stress conditions. Journal of Agronomy and Crop Science 185, 273-239.
Prakash M and Ramachandran K (2000) Effects of moisture stress and anti-transpirant
on leaf chlorophyll. Journal of Agronomy and Crop Science 184, 153-156. Premachandra GS, Saneoka H, Fujita K, Ogata S (1992) Leaf water relations, osmotic
adjustment, cell membrane stability, epicuticular wax load and growth as affected by increasing water deficits in sorghum. Journal of Experimental Botany 43, 1569-1576.
Pugnaire FI, Endolz LS and Pardos J (2002) Constrains by water stress on plant growth.
In ‘Handbook of plant and crop physiology’. 2nd ed. (Ed. M. Pessarakli). Marcel Dekker. Inc. New York. 247-259.
Ravi V and Indira P (1999) Crop physiology of sweet potato. Horticulture Reviews 23,
277-338. Raven PH, Evert RF, Eichhorn SE (1999) Biology of Plant. 6th ed. WH Freeman and
Company Worth Publishers. New York. 729 pp. Ray LL, Wendt CW, Roark B, Quisenberry JE (1974) Genetic modification of cotton
plants for more efficient water use. Agriculture Meteorology 14, 31-38. Reddy VR, Acock B, Baker DN, Acock M (1989) Seasonal leaf area-leaf weight
relationships in the cotton canopy. Agronomy Journal 81,1-4. Reynoso D, Huaman Z, Aguilar C (1997) Methods for flowering induction in sweet
potato. In ‘Sweetpotato germplasm management’. Training manual. (Ed. Z Huaman). International Potato Centre (CIP). Lima, Peru. Section 2.7.
Riga P and Vartanian N (1999) Sequential expression of adaptive mechanisms is
responsible for drought resistance in tobacco. Australian Journal of Plant Physiology 26, 211-220.
Robitaille HA and Lawrence BE (1992) Cropping systems for mass education. In
‘Sweet potato technology for the 21st century’. Eds. WA Hill, CK Bonsi, PA Loretan. Tuskegee University, Tuskegee, Alabama. 126-132 pp.
245

Rufty Jr TE and Huber SC (1983) Changes in starch formation and activities of sucrose phosphate synthase and cytoplasmic fructose-1, 6-bisphosphate in response to source-sink alterations. Plant Physiology 72, 474-480.
Ruinard J (1969) Notes on sweet potato research in West New Guinea (West Irian). In
‘Proceedings of the international symposium on tropical root crops’. Vol. I. Eds. EA Tai, WB Charles, EF Iton, PH Hayness, and KA Leslie. University of the West Indies; Trinidad. 88-111 pp.
Russell EJ and Russell WJ (1973) Soil conditions and plant growth.10th ed. Longmans
Green Co. Ltd; London. 31-33 pp. Salih AA, Ali IA, Lux A, Luxova M, Cohen Y, Sugimoto Y, Inanaga S (1999) Rooting,
water uptake, and xylem structure adaptation to drought of two sorghum cultivars. Crop Science 39, 168-173.
Sam O, Jeréz E, Dell’Amico J, Ruiz-Sánchez MC (2000) Water stress induced changes
in anatomy of tomato leaf epidermis. Biologia Plantarum 43(2), 275-277. Sangakkara UR, Frehner M, Nösberger J (2000) Effect of soil moisture and potassium
fertilizer on shoot water potential, photosynthesis and partitioning of carbon in mungbean and cowpea. Journal of Agronomy and Crop Science 185, 201-207.
Sanger JE (1971) Quantitative investigation of leaf pigments from their inception in
buds through autumn coloration to decomposition in falling leaves. Ecology 52, 1075-1089.
Saraswati P, Johnston M, Coventry R, Holtum J (2004) Identification of drought
tolerant sweet potato (Ipomoea batatas (L.) Lam) cultivars. In ‘New directions for a diverse planet’. Eds. T Fischer, N Turner, J Angus, L McIntyre, M Robertson, A Borrell, and D. Lloyd. Handbook and abstracts for the 4th International Crop Science Congress, Brisbane, Australia, 26 September-1 October 2004.
Satchithanantham S and Bandara DC (2002) Physiological responses of maize (Zea
mays L.) to the interactive effects of nitrogen fertilizer and water regimes. Tropical Agricultural Research 12, 22-32.
Schneider J, Widyastuti CA, Djazuli M (1993) Sweet potato in the Baliem Valley area,
Irian Jaya. In ‘A report on collection and study of sweet potato germplasm, April-May 1993’. International Potato Center (CIP), ESEAP-Region; Bogor, Indonesia.
Schultheis JR and Wilson LG (2000) What is the difference between a sweet potato and
a yam ? http://www.ces.ncsu.edu/depts/hort/hil/hil-23-a.html [Accessed 9/12/00 at 8:44 AM].
Schulze E.D (1986) Whole-plant responses to drought. In ‘plant growth, drought and
salinity’. Eds. NC Turner and JB Passioura. CSIRO Australia. 127-141 pp. Scott LE and Bouwkamp JC (1974) Seasonal mineral accumulation by the sweet potato.
Horticulture Science 9, 233-237.
246

Scott GJ (1992) Transforming traditional food crops: product development for roots and
tubers. In ‘Product development for root and tuber crops’. Eds. GJ Scott, S Wiersema, and PI Ferguson. Proceedings of the international workshop, Visca, Baybay, Leyte, Philippines, April 22-May 1, 1991, International Potato Centre (CIP); Lima, Peru. Volume 1, 3-20 pp.
Sen Gupta A, Berkowitz GA, Pier PA (1989) Maintenance of photosynthesis at low leaf
water potential in wheat. Role of potassium status and irrigation history. Plant Physiology 89, 1358-1365.
Sen H, Mukhopadhyaya SK, Gosami SB (1990) Performance of some promising sweet
potato hybrids in Rajendranagar. Journal of Root Crops 16(1), 46-47. Shaw B, Thomas TH, Cooke DT (2002) Responses of sugar beet (Beta vulgaris L.) to
drought and nutrient deficiency stress. Plant Growth Regulation 37, 77-83. Siddique MRB, Hamid A, Islam MS (2000) Drought stress effects on water relations of
wheat. Botany Bulletin Acad. Sinica 41, 35-39. Sims DA and Gamon JA (2003) Estimating anthocyanin, chlorophyll, and cariotenoid
concentrations using hyperspectral reflectance. http://vcsars.calstatela.edu/esa_posters/ds/dan_esa99.html [Accessed: 16/04/2003 at 15.30 pm].
Sinclair TR and Ludlow MM (1985) Who taught plants thermodynamics? The
unfulfilled potential of plant water potential. Australian Journal of Plant Physiology 33, 213-217.
Singh TN, Aspenall D, Paleg LG (1972) Proline accumulation and varietal adaptability
to drought in barley: a potential metabolic measure of drought resistance. Nature New Biology 236, 188-189.
Sinha SK, Aggarwal PK, Khanna CR (1985) Irrigation in India: a physiological and
phenological approach to water management in grain crops. Advance Irrigation 3, 129-212.
Sivan P, Asher CJ, Blamey FPC (1996) Effects of potassium on drought tolerance of
taro and tannia. In ‘Mineral nutrient disorder of root crops in the Pacific’. Eds. ET Craswell, CJ Asher and JN O’Sullivan. Proceedings of a workshop, Nuku’alofa, Kingdom of Tonga, 17-20 April 1995. The Australian Center for International Agricultural Research (ACIAR); Canberra, Australia.100-104 pp.
Soenarto (1997) Wen hipere suatu budidaya ubijalar di lembah Balliem, Irian Jaya.
M.Sc. Thesis. Fakultas Paska Sarjana. Institut Pertanian Bogor. Indonesia. (In Indonesian Language).
Soenarto and Rumawas F (1997) An agro-ecological analysis of wen-tinak, a
sustainable sweet potato wetland production system in the Baliem Valley, Irian Jaya, Indonesia. Science in New Guinea. 23(2), 55-66.
247

Stanislaw G, Morio I. Yasuhiro K, Akira (1997) Differences in drought tolerance
between cultivars of field bean and field pea: A Comparison of drought-resistance and drought-sensitive cultivars. Acta Physiologiae Plantarum 19(3), 349-357.
Sullivan CY (1971) Technique for measuring plant drought stress. In ‘Drought injury
and resistance in crops’. Eds. KL Larson and FD Eastin. Crop Science Society of America, Madison, Wisconsin. Special publication No. 2. 1-18 pp.
Suja G and Nayar TVR (1996) Water management in tropical tuber crops: a critical
evaluation. Journal of Root Crops 22(2), 65-77. Swindale LD and Bidinger FR (1981) Introduction: the human consequences of drought
and crop research priorities for their alleviation. In ‘The physiology and biochemistry of drought resistance in plants’. Eds. LG Paleg and D Aspinal. Academic Press; Sydney, Australia. 1-13 pp.
Taiz L and Zeiger E (2002) Plant physiology. Sinauer Associates, Inc.; Sunderland,
Massachusetts. Taufatofua P (1994) Agronomic manipulation of sweet potato (Ipomoea batatas L.)
grown under water limiting conditions. PhD thesis. University of Queensland. 168 p. (Unpublished).
Taufatofua P and Fukai S (1996) Effects of nitrogen and water stress on growth and
yield of sweet potato. In ‘Proceedings of a workshop, Nuku’alofa, Kingdom of Tonga, 17-20 April 1995’. The Australian Centre for International Agricultural Research [ACIAR] Canberra, Australia No. 65. 76-79 pp.
Topp GC (1993) Soil water content. In ‘Soil sampling and methods of analysis’. Ed.
MR Carter. Canadian Society of Soil Science. Lewish Publishers. 541-557 pp. Toshihiko E, Masaharu K, Hiromi E (1998) Water relations and dynamics of tuber
growth rate in sweet potato plants (Ipomoea batatas Lam). Environment Control in Biology 36(2), 91-95.
Turner NC (1975) Concurrent comparison of stomatal behaviour, water status, and
evaporation of maize in soil at high or low water potential. Plant Physiology 55, 932-936.
Turner NC (1979) Drought resistance and adaptation to water deficits in crop plants. In
‘Stress physiology in crop plants’. Eds. H Mussel and RC Staples. John Wiley & Sons; New York. 343-72 pp.
Turner NC (1986) Crop water deficits: a decade of progress. Advances in Agronomy
39, 1-51. Turner NC, Wright GC, Siddique KHM (2001) Adaptation of grain legumes (pulses) to
water-limited environments. Advances in Agronomy 71, 195-231.
248

Valenzuela H, Fukuda S, Arakaki A (2000) Sweet potato production guidelines for Hawaii. http://www.extento.hawaii.edu/kbase/reports/sweetpot_prod.htm [Accessed: 9/4/00 at 6:29 pm].
Van der Mescht A, de Ronde JA, Rossouw FT (1999) Chlorophyll fluorescence and
chlorophyll content as a measure of drought tolerant in potato. Abstract . South African Journal of Science. Vol 95, number 9 http://www.nrf.ac.za/sajs/absep99j.stm [Accessed: 1/12/2005 at 5:50 pm].
Van Loon CD (1981) The effect of water stress on potato growth, development and
yield. American Potato Journal 58, 51-69. Van Oosterom EJ, Mahalakshmi V, Arya GK, Dave HR, Gothwal BD, Joshi AK, Joshi
P, Kapoor RL, Sagar P, Saxena MBL, Singhania DL, Vyas KL (1995) Effect of yield potential, drought escape and drought tolerance on yield of pearl millet (Pennisetum glaucum) in different stress environment. Indian Journal of Agriculture Sciences 65(9), 629-35.
Vasudevan K, Padmaja G, Jayakumar S (1996) Effect of nitrogen and potassium levels
on growth, yield and nutrient uptake of Colocasia. Journal of Root Crops 22(2), 139-143.
Villagarcia MR and Collins WW (1998) Nitrate uptake and nitrogen use efficiency of
two sweet potato genotypes during early stages of storage root formation. Journal of American Society Horticulture Science 123(5), 814-820.
Villarreal RL, Tsou SC, Lo HF, Chiu SC (1985) Sweet potato vine tips as vegetables. In
‘Sweet potato products: a natural resource for the tropics’. Ed. JC Bouwkamp. CRC Press; Boca Raton, Florida. 175-183 pp.
Walker DW and Miller Jr. C (1986) Rate of water loss from detached leaves of drought
resistant and susceptible genotypes of cowpea. Horticulture Science 21, 131-132. Wang Y, Xi G, Zhang L, Hu Z, Guan R (1995) Effects of potassium fertilizer on sweet
potato. In’ Proceedings of the First Chinese-Japanese Symposium on Sweet Potato and Potato’. Eds. Q Liu, T Kokubo. Beijing Agricultural University Press; Beijing. 199-203 pp.
Widyastuti CA (1995) The collection of associated knowledge during short germplasm
collections: field experiences in Java and Irian Jaya. In ‘Indigenous Knowledge in Conservation of Crop Genetic Resources’. Ed. J Schneider. International Potato Center (CIP) and Central Research Institute for Food Crops (CRIFC), Bogor. 35-45 pp.
Willmer C and Fricker M (1996) The distribution of stomata. In ‘Stomata’. 2nd ed.
Chapman and Hall; London. 12-35 pp. Wintermans JFGM and De Mots A (1965) Spectrophotometric characteristics of
chlorophyll a and b and their pheophytin in ethanol. Biochemical Biophysical Acta 109, 448-453.
249

Woolfe JA (1992) Sweet potato: An untapped food resource. Cambridge University
Press; Cambridge, United Kingdom. Xia MZ (1990) Physiological effects of water stress during the flowering and podding
stages of Vicia faba. Plant Physiology Communications 1, 14-19 (CAB International, 2002. Accessed: 4/5/2002 at 11.30 am).
Yamasaki S and Dillenburg LR (1999) Measurements of leaf relative water content in
Araucaria angustifolia. Revista Brasilleira de Fisiologia Vegetal 11(2), 69-75. Yen DE (1974) The sweet potato in the Pacific and Oceania: An essay in ethno botany.
Bishop Museum Press; Honolulu. Yen DE (1982) Sweet potato in historical perspective. In ‘Sweet potato’. Eds. RL
Villareal and TD Griggs. Proceedings of the First International Symposium. Asian Vegetable Research and Development Centre (AVRDC), Taiwan. 2-30 pp.
Zeevaart JAD and Creelman RA (1988) Metabolism and physiology of abscisic acid.
Annual Review Plant Physiology 39, 439-473. Zobayed SMA, Afreen F, Kubota C, Kozai T (2000) Water control and survival of
Ipomoea batatas grown photoautotrophically under forced ventilation and photomixotrophically under natural ventilation. Annals of Botany 86, 603-610.
250

APPENDIX A1
MATERIALS AND METHODS
1. SOIL MOISTURE STATUS
1.1 SOIL MOISTURE AT FIELD CAPACITY
Field capacity (FC) is defined as the water content remaining in the soil after saturation,
followed by drainage for 48 hours (Lambers et al., 1998). Twelve soil samples were
taken from the growing media in three of the pots used in each of the experiments
reported in this thesis to determine moisture content at field capacity. Computations of
the field capacity of the growing media used for each experiment are presented in the
relevant chapters.
To determine the soil moisture content at field capacity, 5L pots of soil were saturated
with water after which they were allowed to drain for 48 hours. Approximately 50 g
samples of soil were taken from the middle of the pots and about 6 cm below the soil
surface. They were immediately weighed, dried to constant weight at 105 0C, then
reweighed. The soil water content of air dried soil was also determined by weighing
approximately 40 g of an air dry soil sample that was then dried to constant weight at
105 0C, and reweighed.
To determine the amount of water needed to bring 1 kg of air dried soil to field
capacity, the following calculations were used:
251

% Moisture at field capacity/ mass of 105 0C dried soil = a
(Mass of soil sample after free drainage - Mass of oven dry soil) x 100 / (Mass of oven-dry soil)
% Moisture Air-dried soil/mass of 105 0C dried soil = b
(Mass of air-dried soil sample - Mass of oven-dried soil) x 100 / (Mass of oven-dry soil)
Amount of water needed to bring air-dried soil to field capacity
(a – b) / b x 1000 units: g water/kg air dry soil.
1.2 SOIL MOISTURE AT WILTING POINT
Water was withheld from the pots containing growing plants. After the plants showed
signs of severe wilting, some water was applied and the plants revived. As water was
progressively withheld, there came a time when the plants no longer revived after water
was applied. The soil moisture at this stage of plant growth is called the permanent
wilting point. Soil samples were collected from the soils beneath the plants that had died
at permanent wilting point. The samples were weighed, and oven-dried at 105 oC to a
constant weight to determine the soil moisture at wilting point.
The calculation of soil moisture at the wilting point is as follows:
Soil moisture at wilting point =
100 (Mass of soil at Wilting Point – Mass of oven dry soil) / (Mass of oven dry soil)
2. FERTILIZER APPLICATION
For experiments 2 and 3, a complete soluble fertilizer (Osmocote) was applied every
second week (1 g/plant) for three months. Additional potassium was given as 1 g of
252

potassium sulphate /plant at one week after planting. The calculation of fertilizer
requirement is presented in Appendix A4, section 1. The chemical composition of
Osmocote fertilizer is shown in Table A1.1.
Table A1.1 The chemical composition of Osmocote fertilizer (%).
N P K S Mg B Cu Fe Mn Mo Zn
28 1.8 14 0.5 0.5 0.025 0.07 0.16 0.05 0.002 0.06
A different method of fertilizer application was employed in the nutrient experiment
and is discussed in Chapter 4.
3. PLANT GROWTH OBSERVATIONS
Variables measured were plant growth (height, length of longest shoot, basal diameter
of shoots) tuber yield, plant water relations, morphology, anatomy, leaf chemical
contents, and tuber organic contents. The methods used are set out below.
3.1 Morpho-physiological plant growth traits
• Fresh and dry plant biomass
Leaf, vine, root, and tuber components were weighed separately and dried to constant
weight (normally for 48 hours) in an oven (70o C). Before weighing, tubers were
washed to remove soil, air-dried for approximately 30 minutes, and weighed to obtain
fresh weight.
253

• Branch number and the amount of leaf senescence per plant
Number of branches was counted at harvest time, while senescence’s leaves that had
been collected from 1 to 4 months after planting were also weighed at harvest time.
• Leaf area (LA)
Leaf area was determined using Paton Electronic Planimeter (Paton Industries, Stepney-
SA) at harvest time, expressed in cm2/plant. Leaf area is an important parameter as it is
usually very closely related to photosynthetic efficiency (Taiz and Zeiger, 2002). Leaf
area expansion is affected when a water deficit develops, however rapid leaf area
expansion can adversely affect water availability (Taiz and Zeiger, 2002).
• Specific leaf area (SLA)
Specific leaf area is expressed in cm2/g or m2/kg, is the ratio between leaf area and leaf
dry mass (Reddy et al., 1989). SLA indicates leaf thickness, and has been related to leaf
structure, growth and net photosynthesis (Barden, 1977). The computation of specific
leaf area is as follows:
Specific leaf area (cm2/g) = (area of leaves) / (mass of leaves) per plant
• Specific leaf weight (SLW)
Specific leaf weight (specific leaf mass) is expressed in g/cm2, is the ratio between leaf
mass and leaf area and is an indicator of leaf thickness (Nobel, 1980). The calculation of
specific leaf weight is as follows:
Specific leaf weight (g/cm2) = (Mass of leaves) / (Area of leaves) per plant.
254

• Leaf dry matter content (LDMC)
Leaf dry matter content is determined by the ratio of leaf dry mass to fresh mass.
Specific leaf area and leaf dry matter content reflect a fundamental trade-off in plant
functioning between a rapid production of biomass (high SLA, low LDMC species) and
an efficient conservation of nutrients (low SLA, high LDMC species) (Garnier et al.,
2001). The calculation of leaf dry matter content is as follows:
Leaf dry matter content = (Leaf dry mass) / (Leaf fresh mass) per plant
• Harvest index (HI)
Harvest index gives an indication of the relative distribution of assimilates between the
storage root and the remainder of the plant (Kuo and Chen, 1992). It is defined as the
ratio of economic yield to biological yield at maturity (Ludlow and Muchow, 1990).
This ratio varies on the ability of a genotype to partition current assimilates to the
economic yield and the reallocation of stored or structural assimilates to the economic
yield (Turner et al., 2001). Harvest index was measured as follows:
Harvest index = mass of tubers / shoot and root mass (g/plant)
3.2 Pigment contents
Plants contain pigment molecules that absorb light used in plant physiological process
(Hopkins, 1999). Chlorophyll is the pigment primarily responsible for harvesting light
energy used in photosynthesis (Hopkins, 1999). Carotene is lipid soluble, which also
collects energy for photosynthesis and protects the chlorophyll against photo-oxidation
(Leopold, 1964; Hopkins, 1999). Loss of photosynthetic pigments results in leaf
deterioration. In potato, the levels of chlorophyll a, chlorophyll b, total chlorophyll
concentration and the chlorophyll a/b ratio of cultivars can be used as an indication of
255

drought tolerance after four weeks without water (van der Mescht et al., 1999).
Chlorophyll a/b ratio is an index for determining photosynthetic efficiency. A high
chlorophyll a/b ratio also indicates that the ratio between photo system II/photo system I
contents change in stressed leaves (Anderson, 1986).
Photosynthetic pigments were determined using the method described by Wintermans
and de Mots (1965). Young fully expanded leaves were collected from the plants as the
maximum apparent photosynthetic rates of most crop species occur in the young fully
expanded leaves (Brown, 1992). Approximately 2 g of fresh leaves were cut and
weighed. The leaves were ground with a mortar and pestle with a pinch of acid-washed
sand, 0.2 g CaCO3, and 5 mL ethanol 100%. The solution was transferred to centrifuge
tubes and made up to 25 mL of ethanol 100% and centrifuged for 15 minutes at 3,000
rpm to separate the supernatant from the cell materials and sand. The optical density of
the supernatant was determined at 470, 649, 665 and 740 nm on a DMS 90 Varian
Techtron UV-Visible Spectrophotometer, made by Varian Techtron Pty Limited,
Australia. The amount of chlorophyll a, b and carotene were determined using the
formula of Wintermans and de Mots (1965) below, after the 740 nm absorbance reading
(A740) was subtracted from the others values to correct for background absorbance:
Chlorophyll a (g/mL) = 13.7 A665 – 5.76 A649
Chlorophyll b (g/mL) = 25.8 A649 – 7.60 A665
Carotene (g/mL) = (1000A470 – 2.05 Ca – 114.8 Cb)/245
3.3 Plant anatomy
Studies on leaf and stem anatomy were carried out under the guidance of Mrs. S. Reilly
in the Histology Laboratory of the School of Marine and Tropical Biology, James Cook
256

University. Young fully developed leaves and stems were collected from each of the
experimental pots for microscopic analysis. Transverse leaf sections were cut from the
middle of each leaf (1 cm x 2 cm), and stems were cut (3 cm) at the third node from the
end of the stem. Leaves and stems were put in the 10 mL of the botanical fixative
(formaldehyde acetic acid alcohol), which contains 27% formaldehyde, 70% ethanol,
3% glacial acetic acid for two days. After immersion in the botanical fixative for 2 days,
the plant tissues were stored in 70% ethanol. The tissues then were transferred to
cassettes, embedded in paraffin wax, and sliced using a microtome (6 µm thick sections
were made); plant tissues were processed through the alcohol series and stained with
alcian blue and safranine. Leaf (transverse sections) and stem section were observed
under a compound Olympus microscope to observe the leaf structure and the thickness
of the leaf cuticle.
The epidermis of fresh leaf samples was dissected manually to study the density of
stomata. Stomatal frequency or density, the lengths of guard cells and stomatal pores
were measured at a magnification of 400X under an Olympus compound microscope.
Stomata density was calculated based on the division between the number of stomata in
the field of view at (40X) magnification and true area of the field of view, which
approximately 45 mm2 (Willmer and Fricker, 1996). All anatomical sections were
photographed using a microscope digital camera DP 12 system.
The width and length of guard cells and length of stomatal pores were measured as
indicated in Fig. A1.1
257

Stomatal pore’s length Guard cells
B
Guard cell length Subsidiary cell
Figure A1.1 Measurements made on stomatal pores.
3.4 Plant water relations
The measurement of the components of plant water relations such as transpiration, leaf
water potential (LWP), and relative water content (RWC) is an important part of
understanding plant biomass production. Leaf water potential and relative water
content, which are the components of plant water status, were measured on plants
between 2 and 3 months after planting, as it has been reported that relative water
content of sweet potato did not differ significantly at the first month of growth, however
relative water content subsequently declined with age (Naskar and Roychowdhury,
1995).
• Transpiration
Monitoring the weight loss of moist soil in an experimental pot over a given time
interval once evaporative and drainage losses have been prevented is the most reliable
method for measuring plant transpiration and is easily adapted for potted plants (Kirnak
et al., 2001). The rate of water loss was determined by weighing the pots every 2 days
at the same time of day (Riga and Vartanian, 1999), and recording the amount of water
258

needed to bring the soil to a given field capacity. The soil surface in the pots was
covered with black polyethylene plastic in the preliminary experiment while the
remainder of experiments used aluminium foil to prevent the evaporation. A portable
balance was used to weigh the pots from 0 to 15 kg with an accuracy of ± 5 g. The
calculation of the water lost or transpiration rate is as follows:
Transpiration rate (g day-1) = Initial weight of pot – (Weight of pot after 48 hours) / 2
• Leaf water potential
Leaf water potential was measured in young fully expanded leaves taken from full light
positions. The two methods used to measure leaf water potential involve a pressure
chamber and thermocouple psychrometer (Beadle et al., 1993). The thermocouple
psychrometer is highly sensitive instrument in which if used with inadequate procedures
and attention can jeopardize the results (Brown and Oosterhuis, 1992). At equivalent
water potentials, plant tissues may require longer equilibration time than solutions, and
the equilibrium time may differ widely among different plant species (Brown and
Oosterhuis, 1992). It is important to get the accurate readings by knowing the right
equilibration time (Tru Psychrometer Water Potential Meter Operator Manual).
Preliminary studies were made to determine the optimum amount of leaf abrasion and
equilibration time of leaf samples inside the thermocouple psychrometer chambers for
sweet potato. The SC10A, Decagon Device Inc. Tru Psychrometer calibrates itself to a
salt solution of 0.5 molal KCl (Tru Psychrometer Water Potential Meter Operator
Manual). KCl in the sample cup of Tru Psychrometer equilibrated within a certain time,
and the vapour pressure was monitored by repeated measurements. The results showed
that KCl equilibrated with the air within the sample cup of thermocouple psychrometer
259

within 7 to 9 minutes (Table A1.2 and Figure A1.2) at temperatures between 26 and
27 oC.
Table A1.2 Tru Psychrometer calibration with KCl at different equilibration times.
Equilibrium time of KCl with temperature (minutes) Sample No.
1 2 3 4 5 6 7 8 9 1 -0.61 -0.54 -0.49 -0.47 -0.44 -0.44 -0.40 -0.39 -0.39
2 -0.59 -0.51 -0.44 -0.43 -0.41 -0.38 -0.34 -0.34 -0.35 3 -0.58 -0.51 -0.45 -0.45 -0.42 -0.40 -0.38 -0.40 -0.40
4
-0.57 -0.57 -0.54 -0.53 -0.45 -0.45 -0.42 -0.41 -0.42
Average (MPa) -0.59 -0.53 -0.48 -0.47 -0.43 -0.42 -0.38 -0.38 -0.39 The numbers in each cell of the table indicate the value of leaf water potential of sweet
potato leaf samples.
Time of equilibration (minutes)
-0.7
-0.6
-0.5
-0.4
-0.3
-0.2
-0.1
01 2 3 4 5 6 7 8 9
Tru
psyc
hrom
eter
read
ing
(MPa
)
Figure A1.2 Time required for salt solution (KCl) to equilibrate with the air inside the sample cup of thermocouple psychrometer.
Leaf samples need time to come to temperature equilibrium inside the cup chamber of
the psychrometer (Tru Psychrometer Water Potential Meter Operator Manual). Based
on a preliminary trial, the standard equilibration time curve of a Peltier thermocouple
for sweet potato leaf was from 2 to 3 hours (Figure A1.3).
260

-0.65
-0.64
-0.63
-0.62
-0.61
-0.6
-0.59
-0.58
-0.57
-0.56
-0.551hr 1hr20 1hr40 2hr 3hr 4hr 5hr
Time of Equilibrium
Leaf
Wat
er P
oten
tial (
MPa
)
Figure A1.3 Curve of the equilibrium time of sweet potato leaves in the sample cup of thermocouple psychrometer (Data represents the mean of 4 replications).
To increase the water vapour conductance across the leaf epidermis, the waxy leaf
cuticle should be removed or broken by abrasion (Brown and Oosterhuis, 1992). Fine
(600-grit) sandpaper was used as it was found to be the best method in producing the
greatest conductance (Campbell and McInnes, 1999). The preliminary trial of leaf
abrasion examined six abrasion treatments (leaves rubbed 1, 2, 3, 4, 5, and 6 times)
were compared to determine the most effective rubbing number. An analysis of variance
of the results showed that there was a significant difference across the leaf rubbing
treatments (Table A1.3). Based on the Duncan Multiple Range Test, 2, 3, and 4 leaf
rubbings were significantly different from 1 and 6 leaf rubbings, while 5 leaf rubbings
was not significantly different from all other treatments.
The four leaf rubbings had the smallest standard error (Figure A1.4) and was accepted
as the most effective way to increase leaf vapour conductance of sweet potato.
261

Excessive rubbing may have allowed moisture to be lost from the leaf prior to putting it
in the sample chamber of the Tru Psychrometer Water Potential Meter.
Table A1.3 Analyses variance of leaf rubbing treatments.
Sum of squares df Mean Square F Sig.
Between groups 0.074 5 0.015 4.227 0.003 Within groups 0.169 48 0.004 Total 0.243 53
-0.8
-0.7
-0.6
-0.5
-0.4
-0.3
-0.2
-0.1
01 2 3 4 5 6
Number of times leaves were rubbed
Leaf
wat
er p
oten
tial (
M.P
a)
Figure A1.4 Average leaf water potential as affected by the number of leaf rubbings. Vertical bars represent standard errors of the means of nine replications.
A Scholander type pressure chamber (Plant Moisture Stress, Corvalis, Oregon) was
used to determine leaf water potential. It is a rapid method, portable, and is commonly
used as a field instrument (Sullivan 1971). Sweet potato leaves were detached and
quickly placed in a pressure chamber with the cut end protruding a few millimetres
from the top exit. The plant part was sealed in the chamber with a rubber stopper. When
the leaf was severed the xylem sap, which was under tension, receded from the cut
(Sullivan, 1971). When pressure was slowly applied to the chamber, the sap was forced
262

back to the cut end. Some bubbles appeared first, but the pressure when sap first wet the
cut surface was taken as equal to the tension and water potential of the tissue before it
was excised (Sullivan, 1971). The latex appeared as a thick white fluid, which easily
recognised from the clear xylem sap bubble when emerged from the cut.
• Relative water content (RWC) of leaf tissue
This method is also used to assess the water status of plants. Leaf relative water content
was measured using the method of Kramer (1980); Weatherley (1950) in Sullivan
(1971) and Chandrasekar et al., (2000). Leaf discs (10 mm in diameter) were taken from
young fully expanded leaves in the field, and sealed in tubes. Weatherley (1950) in
Sullivan (1971) used leaf discs in order to shorten the saturation time. The tubes
containing leaf samples were immediately placed on ice in an insulated cool box but not
frozen, and immediately brought to the laboratory. Leaf discs that were cut from the
leaves were directly weighed to determine fresh weight (FW). Samples were then
floated in 100 mL of distilled water in a closed Petri dish under low light for 4 hours for
unstressed leaves, and for 5 hours for leaves from water stressed plants. The optimal
times for imbibition were determined in a preliminary experiment described below.
Leaf samples were taken out of water and were surface-dried with paper tissues, and
their turgid masses (TW) were recorded. The samples were packed in paper bags, and
oven dried at 65 oC for 48 hours for dry mass (DW) determination. The leaf discs were
weighed using an analytical balance with precision of 0.00001 g. The calculation of leaf
relative water content is as follow:
Leaf relative water content (%) = 100 (FW-DW) / (TW-DW)
263

Despite its simplicity, the technique needs to be adjusted for different plants.
Adjustment is mainly related to the length and environmental conditions of the
imbibition period needed to obtain the turgid mass (Yamasaki and Dillenburg, 1999).
Therefore, it is essential to determine the accurate saturation times for particular species
at the onset of experiment (Sullivan, 1971).
To calculate the leaf relative water content, a preliminary study was conducted to
determine the appropriate saturation time. The pattern of water absorption between
untreated controls and water stressed plants was observed in a preliminary trial. Young
fully expanded leaves were collected from sweet potato cultivars. Leaf discs of (1 cm
diameter) several replications were cut, weighed, and floated in distilled water from 1 to
8 hours. After imbibing, the leaves were weighed and oven dried at 60 oC. The leaf
discs were weighed using an analytical balance with precision of 0.00001 g. Relative
water content was calculated as the formula given in Appendix A1, section 3.4. It shows
that unstressed sweet potato leaves require 4 hours imbibition, whereas stressed sweet
potato leaves require 5 to 6 hours to reach the saturation time (Figure A1.5).
264

0
10
20
30
40
50
60
70
80
90
100
1 2 3 4 5 6 7 8
Imbibition time (hours)
Rel
ativ
e w
ater
con
tent
(%)
Water stressed leavesNon-stressed leaves
Figure A1.5 Effect of imbibition times on the determination of relative water content of stressed and non-water stressed sweet potato leaves.
Based on the saturation curves of Fig. A1.5, there were 2 phases for unstressed leaves,
namely 1-3 hours, and 4-8 hours. According to Weatherley (1950) in Sullivan (1971),
the first phase is where the most rapid uptake of water is associated with tissue growth
or perhaps penetration of water into the intercellular spaces. The second phase is the
saturation time, when no more tissue growth possibly occurred. However, in the
stressed leaf, there were 3 phases (Figure A1.5), namely 1 hour, 2-4 hours, and 5-8
hours. In the first phase, the sweet potato leaf slowly absorbed water, and was probably
related to the reactivation of cell structural function, followed by the second phase in
which the leaf regained its full turgidity. The third phase shows that leaf achieved
saturation. According to Yamasaki and Dillenburg (1999), the narrow leaves of
Araucaria angustifolia require a longer periods of imbibition than broad leaf species.
Also, leaves that develop under drought conditions require longer period of imbibition
than those that developed under conditions of higher water availability, probably as a
consequence of drought-induced structural changes in the leaf tissue.
265

• Water use efficiency (WUE)
This parameter is defined as the yield of plant product per unit of crop water used, and
is important in all areas of plant production (Atwell et al., 1999). It is defined in two
ways. First, the water use efficiency of productivity is the ratio between above-ground
gain in biomass and the loss of water during the production of that biomass; the water
lost may refer to total transpiration only. Second, photosynthetic water use efficiency is
the ratio between carbon gain in photosynthesis and the lost of water in transpiration
(Lambers et al., 1998). Water use efficiency plays an important role in productivity and
survival under drought stress (Da Matta et al., 2003). Water use efficiency is the amount
of the harvested product produced per unit of water used. A plant that has higher water
use efficiency will resist drought better (Taiz and Zeiger, 2002). Water use efficiency
was measured as follows:
Water use efficiency [g/kg of H2O] = dry biomass (g/plant)/ the amount of water used
(kg/plant)
3.5 Tuber organic contents
Tubers were harvested and dried to constant weight in an oven at 600C (normally 48
hours). The dried tubers were ground to powder using a plant grinding machine (Micro-
Feinmühle-Gulatti DCFH 48 type) made by Janke and Keenkel IKA-Labortechnik. The
powdered samples were kept in brown paper bags prior to analysis. Soluble
carbohydrates and total non-structural carbohydrates were analysed by the Analytical
Laboratory, School of Land and Food Sciences, University of Queensland, Brisbane
using the methods set out as follow:
266

• Analysis of tuber organic components
This procedure permits the determination of soluble carbohydrates (CHO) and Total
Non-Structural Carbohydrates (TNSC) with discrimination between starch and
fructosan polysaccharides.
• Reagents
1. Buffer pH 4.9. Dissolve 16.4 g Na acetate in 1L double deionised water (0.2
M). Prepare 0.2 M acetic acid by diluting 11.5 mL of glacial acetic acid to 1L.
Mix 100 mL of 0.2M acetic acid with 150 mL of 0.2M Na acetate. Adjust to pH
4.9. Add 50 mg thymol and store at 5 °C.
2. Amylase enzyme. Weigh out 300 mg of Amylase enzyme (MP Biomedicals
catalogue No. 0215037505) in 200 mL double deionised water add 100 mg
CaCl2, and one crystal of thymol. Store at 5 °C. Discard after 5 days.
3. Trichloroacetic acid 20%. Dissolve 100 g of trichloroacetic acid in 500 mL
double deionised water.
4. HCl 0.1 M. Dilute 10 mL HCl to 1 L with double deionised water.
5. NaOH 0.1 M. Dissolve 400 mg NaOH in 100 mL double deionised water.
6. Potassium ferricyanide. Dissolve 750 mg of K3Fe(CN)6 + 20 g Na2CO3 in 1 L
double deionised water.
• Stock standards
1. Glucose standard 20 mg/mL. Weigh out 1000 mg of AR glucose and dissolve in
30 mL double deionised water, dilute to 50 mL in a volumetric flask. Store at 5
°C.
267

• Procedure
Sample Preparation
Weigh 100-200 mg of plant material (ground to pass a 1 mm sieve) into a 50 mL
polypropylene tube. Extract each sample with 3 x 15 mL of 80% ethanol at 80 °C in
a water bath for 3 minutes to extract the soluble carbohydrates. Dilute the extracts
to 50 mL and retain for soluble carbohydrates determination. Dry the 50 mL tubes
overnight in the waterbath. Add 15 mL of double deionised water to each tube and
mix on vortex mixer. Place in the waterbath at 95 °C and heat for 1 hour. Agitate
the tubes every 10 minutes to solubilize the starch. Cool to room temperature and
add 10 mL of buffer plus 10 mL of amylase enzyme. Cap, vortex the tubes and
incubate @ 55 °C for 2 hours. Cool and add 9 mL of 20% trichloroacetic acid,
vortex, re-cap the tubes and centrifuge at 2500 rpm for 10 minutes. Transfer the
supernatant into a 100 mL volumetric flask and then add 15 mL of double deionised
water to the tube, cap and vortex. Centrifuge the tubes again and transfer the
supernatant to the volumetric flask. Dilute to 100 mL and mix. Filter 10 mL
through a Whatman glass fibre filter (GF/B) into a 10 mL plastic tube.
Note: For coloured samples or those known to contain phenolics, it is then
necessary to pass the filtered solution through a pre methanol wetted 300 mg C-18
Sep-Pak tube discarding the first 1 mL of solution.
For a recovery test, weigh out 25, 50 and 100 mg quantities of starch and process
these, along with a blank, using the following sample preparation procedure. Weigh
out a separate 100 mg sample of starch into a dry pre-weighed beaker, dry at 65 °C
for 6 hours and reweigh. Calculate the moisture content of the starch and the
correction factor to correct for this in the recovery calculation.
268

Glucose standards
The glucose standards must be processed through the same sample preparation
process as for the samples. Pipette 0.0, 0.50, 1.00, 1.50, 2.00, 2.50, 3.00 mL of the
glucose standard into separate 50 mL polypropylene tubes, add 15 mL of double
deionised water, cap and heat at 95 °C in a water bath for 1 hour. Cool to room
temperature and add 10 mL of buffer plus 10 mL of amylase enzyme. Cap, vortex
the tubes, and incubate at 55 °C for 2 hours. Add 9 mL of 20% trichloroacetic acid
and vortex. Transfer into a 100 mL volumetric flask and dilute to 100 mL and mix.
Final concentrations of glucose are: 0, 0.1, 0.2, 0.3, 0.4, 0.5, 0.60 mg/mL.
Colorimetric analysis
For the starch hydrolysed samples, take 0.2 mL of the final prepared sample, add to
0.4 mL of 0.1 M HCl. Where fructosans are to be included as part of the total non-
structural carbohydrates determination, heat at 85 °C for 10 minutes and cool,
otherwise if starch only is to be determined, proceed directly to the next step. Add
0.4 mL of 0.1 M NaOH + 5.0 mL of the potassium ferricyanide reagent into a 10
mL tube, cap and heat at 85 °C for 20 minutes. Cool and measure the absorbance at
420 nm.
The soluble carbohydrate content was determined by filtering the diluted ethanol
extract through a GF/B filter and if necessary treat with a tube to remove any
phenolics. Then pipette 0.2 mL of extract into a 10 mL tube, add 0.4 mL of 0.1M
HCl, heat at 85 °C for 10 minutes, cool and add 0.4 mL of 0.1 M NaOH + 5.0 mL of
the ferricyanide reagent, vortex and heat at 85 °C for 20 min. Cool and measure the
269

absorbance at 420nm. Prepare a standard curve from glucose standards of 0, 0.05,
0.1, 0.15, 0.20 mg/mL in 80% ethanol.
The colorimetric step for the standards prepared for starch analysis then follows the
same steps as for the samples.
Calculations
For the calculation of percentage starch or percentage total non-structural
carbohydrates an inverse calibration curve for the glucose standards was fitted using
Table Curve (Jandel scientific equation fitting program). This equation was used to
calculate the glucose concentrations in the sample. Then using the sample weights,
calculate the starch concentration in the samples using the equation:
% Starch = (mg/mL glucose*100/mg sample*100)*0.9
For the calculation of soluble carbohydrate the following equation was used:
% Soluble carbohydrate = (mg/mL glucose*50/mg sample*100)
270

271

271
APPENDIX A2
PLANT MEASUREMENTS AND RESULTS OF STATISTICAL
ANALYSES OF CHAPTER 2 Table A2: 1 Matrix multiple comparison of the mean of main stem length of 15 sweet potato cultivars (Experiment 1a).
1
1 - 2
2 * - 3
3 * * - 4
4 * * * - 5
5 * * * ns - 6
6 * * * * * - 7
7 * ns * * * ns - 8
8 * ns * ns * ns ns - 9
9 * ns * ns * ns ns ns - 10
10 * ns * ns * ns ns ns ns - 11
11 ns * ns * * * * * * * - 12
12 * ns * * * * ns ns ns ns * - 13
13 * ns * * * * ns ns * * * ns - 14
14 * * * ns * ns ns ns ns ns * ns * - 15
15 * ns * ns * ns ns ns ns ns * ns ns ns -
Table A2: 2 Matrix multiple comparison of the mean of main stem length of 15 sweet potato cultivars (Experiment 1b).
1
1 - 2
2 * - 3
3 * * - 4
4 * * * - 5
5 * * * * - 6
6 * * * ns * - 7
7 * ns * * * ns - 8
8 * ns * * * ns ns - 9
9 * ns * ns * ns ns ns - 10
10 * ns * ns * ns ns ns ns - 11
11 ns * ns * * * * * * * - 12
12 * ns * * * * ns ns ns ns ns - 13
13 * ns * * * * ns ns * * * ns - 14
14 * * * ns * ns ns ns ns ns * ns * - 15
15 * ns * ns * ns ns ns ns ns * ns ns ns - Number 1-15 represents cultivars (1= Beerwah Gold, 2= Hawaii, 3 =Lole, 4=Markham, 5= Mariken, 6= Wanmun, 7= NG7570, 8= LO323, 9= L3, 10= L11, 11= L18, 12= L46, 13= L49, 14= L131, 15= L135).
ns= not significant; * = significant different at p< 0.05, Bonferroni test.

272
Table A2: 3 Matrix multiple comparison of the mean of dry plant biomass of 15 sweet potato cultivars (Experiment 1a).
1
1 - 2
2 ns - 3
3 * ns - 4
4 ns ns ns - 5
5 ns ns * ns - 6
6 ns ns * ns ns - 7
7 ns ns ns ns ns ns - 8
8 ns * * * ns ns * - 9
9 ns ns * ns ns ns ns ns - 10
10 ns ns ns ns ns ns ns ns ns - 11
11 ns ns ns ns ns ns ns * ns ns - 12
12 ns ns * ns ns ns ns * ns ns ns - 13
13 ns * * ns ns ns ns ns ns * * ns - 14
14 ns ns ns ns ns ns ns * ns ns ns ns * - 15
15 ns ns ns ns ns ns ns * ns ns ns ns * ns -
Number 1-15 represents cultivars (1= Beerwah Gold, 2= Hawaii, 3 =Lole, 4=Markham, 5= Mariken, 6= Wanmun, 7= NG7570, 8= LO323, 9= L3, 10= L11, 11= L18, 12= L46, 13= L49, 14= L131, 15= L135).
ns= not significant; * = significant different at p< 0.05, Bonferroni test.
Table A2: 4 Matrix multiple comparison of the mean of dry plant biomass of 15 sweet potato cultivars (Experiment 1b).
1
1 - 2
2 * - 3
3 * ns - 4
4 ns * * - 5
5 ns * * ns - 6
6 ns * * ns ns - 7
7 * ns * * * * - 8
8 ns * * ns ns ns * - 9
9 ns * * ns ns ns * ns - 10
10 ns * * ns ns ns ns * ns - 11
11 * ns * * * * ns * ns ns - 12
12 ns * * ns ns ns ns * * ns ns - 13
13 ns * * ns ns ns * ns ns ns * ns - 14
14 * ns ns * * * * * * * ns * * - 15
15 ns * * ns ns ns ns ns ns ns * ns ns * -
Number 1-15 represents cultivars (1= Beerwah Gold, 2= Hawaii, 3 =Lole, 4=Markham, 5= Mariken, 6= Wanmun, 7= NG7570, 8= LO323, 9= L3, 10= L11, 11= L18, 12= L46, 13= L49, 14= L131, 15= L135).
ns= not significant; * = significant different at p< 0.05, Bonferroni test.
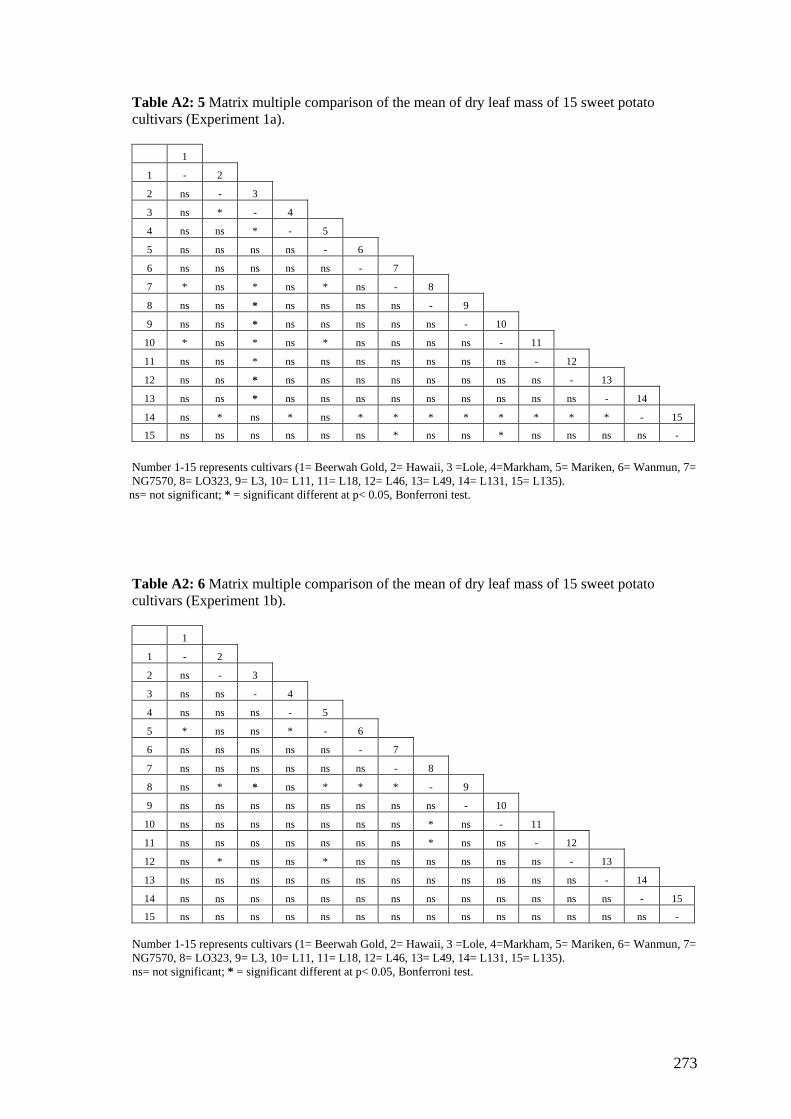
273
Table A2: 5 Matrix multiple comparison of the mean of dry leaf mass of 15 sweet potato cultivars (Experiment 1a).
1
1 - 2
2 ns - 3
3 ns * - 4
4 ns ns * - 5
5 ns ns ns ns - 6
6 ns ns ns ns ns - 7
7 * ns * ns * ns - 8
8 ns ns * ns ns ns ns - 9
9 ns ns * ns ns ns ns ns - 10
10 * ns * ns * ns ns ns ns - 11
11 ns ns * ns ns ns ns ns ns ns - 12
12 ns ns * ns ns ns ns ns ns ns ns - 13
13 ns ns * ns ns ns ns ns ns ns ns ns - 14
14 ns * ns * ns * * * * * * * * - 15
15 ns ns ns ns ns ns * ns ns * ns ns ns ns -
Number 1-15 represents cultivars (1= Beerwah Gold, 2= Hawaii, 3 =Lole, 4=Markham, 5= Mariken, 6= Wanmun, 7= NG7570, 8= LO323, 9= L3, 10= L11, 11= L18, 12= L46, 13= L49, 14= L131, 15= L135).
ns= not significant; * = significant different at p< 0.05, Bonferroni test. Table A2: 6 Matrix multiple comparison of the mean of dry leaf mass of 15 sweet potato cultivars (Experiment 1b).
1
1 - 2
2 ns - 3
3 ns ns - 4
4 ns ns ns - 5
5 * ns ns * - 6
6 ns ns ns ns ns - 7
7 ns ns ns ns ns ns - 8
8 ns * * ns * * * - 9
9 ns ns ns ns ns ns ns ns - 10
10 ns ns ns ns ns ns ns * ns - 11
11 ns ns ns ns ns ns ns * ns ns - 12
12 ns * ns ns * ns ns ns ns ns ns - 13
13 ns ns ns ns ns ns ns ns ns ns ns ns - 14
14 ns ns ns ns ns ns ns ns ns ns ns ns ns - 15
15 ns ns ns ns ns ns ns ns ns ns ns ns ns ns - Number 1-15 represents cultivars (1= Beerwah Gold, 2= Hawaii, 3 =Lole, 4=Markham, 5= Mariken, 6= Wanmun, 7= NG7570, 8= LO323, 9= L3, 10= L11, 11= L18, 12= L46, 13= L49, 14= L131, 15= L135).
ns= not significant; * = significant different at p< 0.05, Bonferroni test.
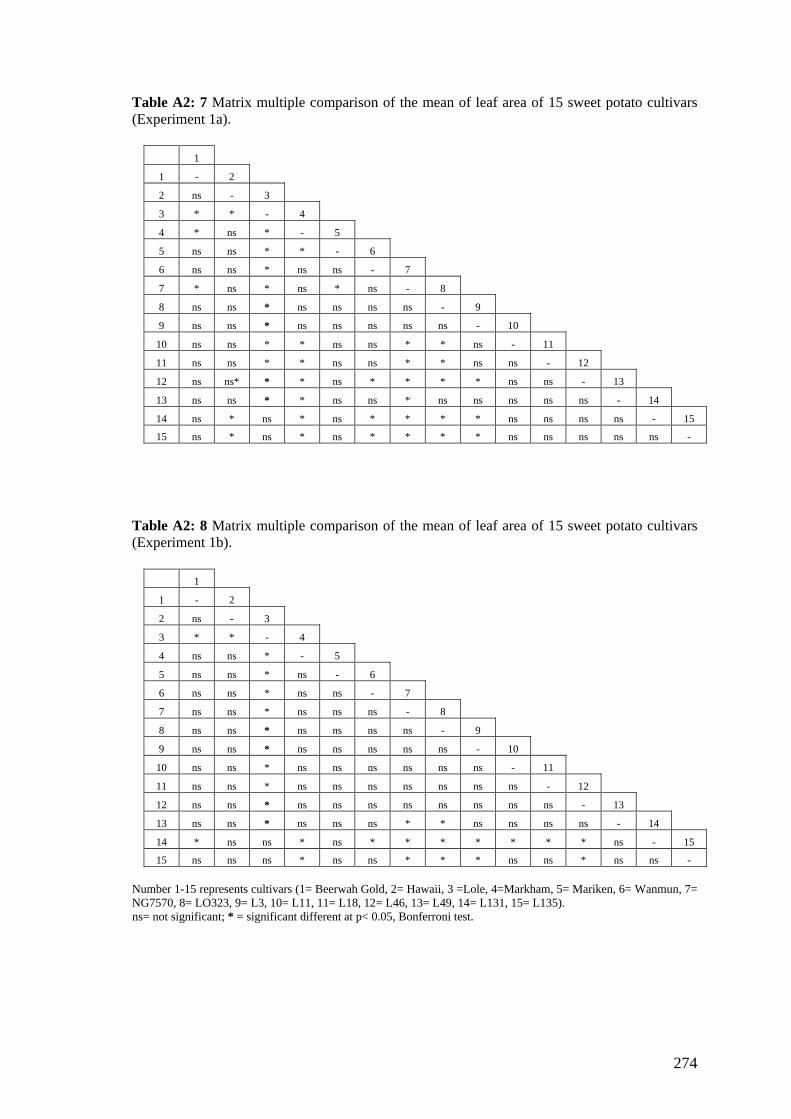
274
Table A2: 7 Matrix multiple comparison of the mean of leaf area of 15 sweet potato cultivars (Experiment 1a).
1
1 - 2
2 ns - 3
3 * * - 4
4 * ns * - 5
5 ns ns * * - 6
6 ns ns * ns ns - 7
7 * ns * ns * ns - 8
8 ns ns * ns ns ns ns - 9
9 ns ns * ns ns ns ns ns - 10
10 ns ns * * ns ns * * ns - 11
11 ns ns * * ns ns * * ns ns - 12
12 ns ns* * * ns * * * * ns ns - 13
13 ns ns * * ns ns * ns ns ns ns ns - 14
14 ns * ns * ns * * * * ns ns ns ns - 15
15 ns * ns * ns * * * * ns ns ns ns ns -
Table A2: 8 Matrix multiple comparison of the mean of leaf area of 15 sweet potato cultivars (Experiment 1b).
1
1 - 2
2 ns - 3
3 * * - 4
4 ns ns * - 5
5 ns ns * ns - 6
6 ns ns * ns ns - 7
7 ns ns * ns ns ns - 8
8 ns ns * ns ns ns ns - 9
9 ns ns * ns ns ns ns ns - 10
10 ns ns * ns ns ns ns ns ns - 11
11 ns ns * ns ns ns ns ns ns ns - 12
12 ns ns * ns ns ns ns ns ns ns ns - 13
13 ns ns * ns ns ns * * ns ns ns ns - 14
14 * ns ns * ns * * * * * * * ns - 15
15 ns ns ns * ns ns * * * ns ns * ns ns -
Number 1-15 represents cultivars (1= Beerwah Gold, 2= Hawaii, 3 =Lole, 4=Markham, 5= Mariken, 6= Wanmun, 7= NG7570, 8= LO323, 9= L3, 10= L11, 11= L18, 12= L46, 13= L49, 14= L131, 15= L135).
ns= not significant; * = significant different at p< 0.05, Bonferroni test.

275
Table A2: 9 Matrix multiple comparison of the mean of internode length of 15 sweet potato cultivars (Experiment 1b).
1
1 - 2
2 * - 3
3 ns * - 4
4 * * * - 5
5 * * * ns - 6
6 * ns * * * - 7
7 * ns * ns * ns - 8
8 * ns * ns * ns ns - 9
9 * ns * ns * ns ns ns - 10
10 * ns * ns * * ns ns ns - 11
11 ns * ns * * * * * * * - 12
12 * ns * * * ns ns * * * * - 13
13 ns ns * * * ns ns * * * * ns - 14
14 * ns * * * ns ns ns ns ns * ns ns - 15
15 ns ns * * * ns ns * * * * ns ns ns -
Table A2: 10 Matrix multiple comparison of internodes diameter of 15 sweet potato cultivars (Experiment 1b).
1
1 - 2
2 * - 3
3 * ns - 4
4 ns * * - 5
5 * ns ns * - 6
6 ns * * ns * - 7
7 * ns * * ns * - 8
8 * ns ns * ns * ns - 9
9 ns * * ns * ns * * - 10
10 ns * * ns * ns * * ns - 11
11 ns * * ns * ns * * ns ns - 12
12 ns * * ns * ns * * ns ns ns - 13
13 * * * * * * * * * * * * - 14
14 * ns ns * ns * ns ns * * * * * - 15
15 * ns ns * ns * ns ns * * * * * ns -
Number 1-15 represents cultivars (1= Beerwah Gold, 2= Hawaii, 3 =Lole, 4=Markham, 5= Mariken, 6= Wanmun, 7= NG7570, 8= LO323, 9= L3, 10= L11, 11= L18, 12= L46, 13= L49, 14= L131, 15= L135).
ns= not significant; * = significant different at p< 0.05, Bonferroni test.

276
Table A2: 11 Matrix multiple comparison of root masses of 15 sweet potato cultivars under well watered supplied (Experiment 1b).
1
1 - 2
2 ns - 3
3 * ns - 4
4 ns ns * - 5
5 ns * * ns - 6
6 ns ns ns ns * - 7
7 ns ns ns ns * - 8
8 ns * * ns ns * * - 9
9 ns ns * ns ns ns ns ns - 10
10 * ns ns ns * ns ns * * - 11
11 ns ns ns * * ns ns * * ns - 12
12 ns ns ns ns * ns ns * ns ns ns - 13
13 ns ns * ns ns ns ns ns ns ns * ns - 14
14 * ns ns * * ns ns * * ns ns ns ns - 15
15 ns ns ns ns * ns ns * ns ns ns ns ns ns -
Table A2: 12 Matrix multiple comparison of root masses of 15 sweet potato cultivars under well watered supplied (Experiment 1b).
1
1 - 2
2 ns - 3
3 ns ns - 4
4 ns ns ns - 5
5 ns ns ns ns - 6
6 ns ns ns ns ns - 7
7 ns ns ns ns ns ns - 8
8 ns ns ns ns ns ns ns - 9
9 ns ns ns ns ns ns ns ns - 10
10 ns ns ns ns ns ns ns ns ns - 11
11 ns ns ns ns ns ns ns ns ns ns - 12
12 ns ns ns ns ns ns ns ns ns ns ns - 13
13 ns ns ns ns ns ns ns ns ns ns ns ns - 14
14 ns ns ns ns ns ns ns ns ns ns ns ns ns - 15
15 * ns ns * ns ns ns ns * ns ns * * ns -
Number 1-15 represents cultivars (1= Beerwah Gold, 2= Hawaii, 3 =Lole, 4=Markham, 5= Mariken, 6= Wanmun, 7= NG7570, 8= LO323, 9= L3, 10= L11, 11= L18, 12= L46, 13= L49, 14= L131, 15= L135).
ns= not significant; * = significant different at p< 0.05, Bonferroni test.

277
Table A2: 13 Matrix multiple comparison of leaf dry matter content of 15 sweet potato cultivars (Experiment 1b).
1
1 - 2
2 * - 3
3 * ns - 4
4 ns ns ns - 5
5 * ns ns ns - 6
6 * ns ns ns ns - 7
7 * ns * * ns ns - 8
8 ns * * ns * * * - 9
9 * ns ns ns ns ns ns * - 10
10 * ns ns ns ns ns ns * ns - 11
11 * ns ns * ns ns ns * ns ns - 12
12 ns ns ns ns ns ns * ns ns ns * - 13
13 * ns ns ns ns ns ns * ns ns ns ns - 14
14 * ns ns ns ns ns ns * ns ns ns ns ns - 15
15 ns ns ns ns ns ns * ns ns ns ns ns ns ns -
Table A2: 14 Matrix multiple comparison of specific leaf area of 15 sweet potato cultivars (Experiment 1b).
1
1 - 2
2 ns - 3
3 ns ns - 4
4 ns ns ns - 5
5 * ns * ns - 6
6 ns ns ns ns ns - 7
7 * ns * ns ns ns - 8
8 ns ns ns ns ns ns * - 9
9 * ns * ns ns ns ns ns - 10
10 ns ns * ns ns ns ns ns ns - 11
11 ns ns * ns ns ns ns ns ns ns - 12
12 ns ns ns ns ns ns * ns ns ns ns - 13
13 ns ns ns ns * ns * ns ns ns ns ns - 14
14 ns ns ns ns ns ns ns ns ns ns ns ns ns - 15
15 ns ns ns ns * ns * ns ns ns ns ns ns ns - Number 1-15 represents cultivars (1= Beerwah Gold, 2= Hawaii, 3 =Lole, 4=Markham, 5= Mariken, 6= Wanmun, 7= NG7570, 8= LO323, 9= L3, 10= L11, 11= L18, 12= L46, 13= L49, 14= L131, 15= L135).
ns= not significant; * = significant different at p< 0.05, Bonferroni test.

278
Table A2: 15 Matrix multiple comparison of the number of days to reach permanent wilting point in 15 sweet potato cultivars. Data was presented from the experiment 1b.
1
1 - 2
2 * - 3
3 * ns - 4
4 * ns * - 5
5 ns * * * - 6
6 ns * * ns ns - 7
7 ns * * ns ns ns - 8
8 ns * * ns ns ns ns - 9
9 ns * * ns ns ns ns ns - 10
10 * ns * ns ns ns ns ns ns - 11
11 * ns * ns ns ns ns ns ns ns - 12
12 * ns * ns ns ns ns ns ns ns ns - 13
13 * ns * ns ns ns ns ns ns ns ns ns - 14
14 * ns * ns ns ns ns ns ns ns ns ns ns - 15
15 * ns * ns ns ns ns ns ns ns ns ns ns ns - Table A2: 16 Matrix multiple comparison of the shoot fresh mass of 15 sweet potato cultivars (Field experiment).
1
1 - 2
2 ns - 3
3 ns ns - 4
4 ns ns ns - 5
5 * * * ns - 6
6 ns ns ns ns ns - 7
7 ns ns ns ns * ns - 8
8 ns ns ns ns ns ns ns - 9
9 ns ns ns ns ns ns ns ns - 10
10 * ns ns ns ns ns ns ns ns - 11
11 ns ns ns ns * ns ns ns ns ns - 12
12 ns ns ns ns ns ns ns ns ns ns ns - 13
13 ns ns ns ns ns ns ns ns ns ns ns ns - 14
14 * ns ns ns ns ns * ns ns ns ns ns ns - 15
15 * ns ns ns ns ns ns ns ns ns nsn ns ns ns - Number 1-15 represents cultivars (1= Beerwah Gold, 2= Hawaii, 3 =Lole, 4=Markham, 5= Mariken, 6= Wanmun, 7= NG7570, 8= LO323, 9= L3, 10= L11, 11= L18, 12= L46, 13= L49, 14= L131, 15= L135).
ns= not significant; * = significant different at p< 0.05, Bonferroni test.

279
Table A2: 17 Matrix multiple comparison of marketable tuber number of 15 sweet potato cultivars (Field experiment).
1
1 - 2
2 * - 3
3 * ns - 4
4 * ns ns - 5
5 ns * * * - 6
6 * ns ns ns ns - 7
7 ns * * ns ns ns - 8
8 ns * * * ns * ns - 9
9 * ns ns ns * ns ns * - 10
10 * ns ns ns * ns * * ns - 11
11 * ns ns ns * ns * * ns ns - 12
12 * ns ns ns * ns ns * ns ns ns - 13
13 * ns ns ns * ns ns * ns ns ns ns - 14
14 * ns ns ns * ns * * ns ns ns ns ns - 15
15 * ns ns ns * ns * * ns ns ns ns ns ns - Table A2: 18 Matrix multiple comparison of tuber yields of 15 sweet potato cultivars (Field experiment).
1
1 * 2
2 * - 3
3 * * - 4
4 ns ns ns - 5
5 ns * * * - 6
6 ns * * * ns - 7
7 ns * * * ns ns - 8
8 ns * * * ns ns ns - 9
9 * ns * ns ns ns * ns - 10
10 * ns ns ns * * * * * - 11
11 * ns ns ns * * * * ns ns - 12
12 * * * * ns ns ns * ns * * - 13
13 * ns ns ns ns ns * ns ns * ns ns - 14
14 ns * * * ns ns ns * ns * * ns ns - 15
15 * ns * ns ns ns * ns ns * ns ns ns ns - Number 1-15 represents cultivars (1= Beerwah Gold, 2= Hawaii, 3 =Lole, 4=Markham, 5= Mariken, 6= Wanmun, 7= NG7570, 8= LO323, 9= L3, 10= L11, 11= L18, 12= L46, 13= L49, 14= L131, 15= L135).
ns= not significant; * = significant different at p< 0.05, Bonferroni test.

280
Table A2: 19 Analysis of variance on the main stem length of fifteen sweet potato cultivars as affected by soil water stress in experiment 1a.
Source Type III Sum of Squares df Mean Square F P(HO)
Corrected Model 17.515 29 .604 17.191 .000
Intercept 2111.743 1 2111.743 60104.534 .000
Water 7.507 1 7.507 213.672 .000
Cultivars 9.545 14 .682 19.405 .000
Water * Cultivars .463 14 3.309E-02 .942 .521
Error 2.108 60 3.513E-02
Total 2131.367 90
Corrected Total 19.624 89 a R Squared = .893 (Adjusted R Squared = .841). Table A2: 20 Analysis of variance on the main stem length of fifteen sweet potato cultivars as affected by soil water stress in experiment 1b.
Source Type III Sum of Squares df Mean Square F P(HO)
Corrected Model 17.196 29 .593 30.250 .000
Intercept 2900.241 1 2900.241 147955.370 .000
Water 3.754 1 3.754 191.531 .000
Cultivars 12.939 14 .924 47.148 .000
Water * Cultivars .503 14 3.590E-02 1.831 .046
Error 1.764 90 1.960E-02
Total 2919.201 120
Corrected Total 18.960 119 a R Squared = .907 (Adjusted R Squared = .877). Table A2: 21 Analysis of variance on total dry weight of plant biomass of fifteen sweet potato cultivars as affected by soil water conditions, after being transformed to natural logarithmic in Experiment 1a.
Source Type III Sum of Squares df Mean Square F P(HO)
Corrected Model 42.601 29 1.469 246.929 .000
Intercept 706.923 1 706.923 118827.887 .000
Water 41.544 1 41.544 6983.272 .000
Cultivars .648 14 4.629E-02 7.781 .000
Water * Cultivars .409 14 2.920E-02 4.909 .000
Error .357 60 5.949E-03
Total 749.881 90
Corrected Total 42.958 89 a R Squared = .992 (Adjusted R Squared = .988).

281
Table A2: 22 Analysis of variance on the dry weight of plant biomass from fifteen sweet potato cultivars as affected by soil water conditions in Experiment 1b.
Source Type III Sum of Squares df Mean Square F P(HO)
Corrected Model 19878.077 29 685.451 231.889 .000 Intercept 54420.442 1 54420.442 18410.522 .000 Water 18128.318 1 18128.318 6132.839 .000 Cultivars 990.915 14 70.780 23.945 .000 Water * Cultivars 758.844 14 54.203 18.337 .000 Error 266.035 90 2.956 Total 74564.553 120 Corrected Total 20144.112 119
a R Squared = .987 (Adjusted R Squared = .983). Table A2: 23 Analysis of variance on the leaf dry mass of fifteen sweet potato cultivars as affected by soil water conditions in Experiment 1a.
Source Type III Sum of Squares
df Mean Square F P(HO)
Corrected Model 3499.259 29 120.664 124.813 .000
Intercept 3933.411 1 3933.411 4068.661 .000
Water 3426.363 1 3426.363 3544.178 .000
Cultivars 36.897 14 2.635 2.726 .004
Water * Cultivars 35.999 14 2.571 2.660 .004
Error 58.005 60 .967
Total 7490.675 90
Corrected Total 3557.264 89 a R Squared = .984 (Adjusted R Squared = .976). Table A2: 24 Analysis of variance on leaf dry mass of fifteen sweet potato cultivars as affected by soil water conditions in Experiment 1b.
Source Type III Sum of Squares df Mean Square F P(HO)
Corrected Model 2127.235 29 73.353 146.060 .000 Intercept 6484.136 1 6484.136 12911.143 .000 Water 2028.395 1 2028.395 4038.919 .000 Cultivars 57.548 14 4.111 8.185 .000 Water * Cultivars 47.190 14 3.371 6.712 .000 Error 44.697 89 .502 Total 8592.968 119 Corrected Total 2171.932 118
a R Squared = .979 (Adjusted R Squared = .973).

282
Table A2: 25 Analysis of variance on leaf area of fifteen sweet potato cultivars as affected by soil water conditions after being transformed to natural logarithmic in Experiment 1a.
Source Type III Sum of Squares
df Mean Square F P(HO)
Corrected Model 41.751 29 1.440 312.899 .000
Intercept 4941.461 1 4941.461 1073956.497 .000
Water 39.485 1 39.485 8581.545 .000
Cultivars .965 14 6.893E-02 14.982 .000
Water * Cultivars 1.301 14 9.294E-02 20.199 .000
Error .276 60 4.601E-03
Total 4983.488 90
Corrected Total 42.027 89 a R Squared = .993 (Adjusted R Squared = .990). Table A2: 26 Analysis of variance on leaf area of fifteen sweet potato cultivars as affected by soil water conditions after being transformed to natural logarithmic in Experiment 1b.
Source Type III Sum of Squares
df Mean Square F P(HO)
Corrected Model 62.089 29 2.141 230.260 .000
Intercept 6585.001 1 6585.001 708206.275 .000
Water 59.713 1 59.713 6422.014 .000
Cultivars 1.398 14 9.986E-02 10.740 .000
Water * Cultivars .978 14 6.985E-02 7.512 .000
Error .837 90 9.298E-03
Total 6647.927 120
Corrected Total 62.926 119 a R Squared = .987 (Adjusted R Squared = .982). Table A2: 27 Analysis of variance on the length of internodes of fifteen sweet potato cultivars as affected by soil water conditions in Experiment 1b.
Source Type III Sum of Squares
df Mean Square F P(HO)
Corrected Model 370.771 29 12.785 17.503 .000
Intercept 3786.757 1 3786.757 5183.985 .000
Water .420 1 .420 .575 .450
Cultivars 369.897 14 26.421 36.170 .000
Water * Cultivars .454 14 3.240E-02 .044 1.000
Error 65.742 90 .730
Total 4223.270 120
Corrected Total 436.513 119 a R Squared = .849 (Adjusted R Squared = .801).

283
Table A2: 28 Analysis of variance on the diameter of internodes of fifteen sweet potato cultivars as affected by soil water conditions in Experiment 1b.
Source Type III Sum of Squares
df Mean Square F P(HO)
Corrected Model 57.632 29 1.987 28.178 .000
Intercept 1068.630 1 1068.630 15151.904 .000
Water 15.480 1 15.480 219.489 .000
Cultivars 38.246 14 2.732 38.735 .000
Water * Cultivars 3.906 14 .279 3.956 .000
Error 6.347 90 7.053E-02
Total 1132.610 120
Corrected Total 63.980 119 a R Squared = .901 (Adjusted R Squared = .869).
Table A2: 29 Analysis of variance on the root fresh mass of fifteen sweet potato cultivars as affected by soil water conditions in Experiment 1b.
Source Type III Sum of Squares
df Mean Square F P(HO)
Corrected Model 262.240 29 9.043 353.776 .000 Intercept 1026.560 1 1026.560 40161.602 .000 Water 259.951 1 259.951 10169.937 .000 Cultivars 1.275 14 9.110E-02 3.564 .000 Water * Cultivars 1.014 14 7.242E-02 2.833 .001 Error 2.300 90 2.556E-02 Total 1291.100 120 Corrected Total 264.541 119
a R Squared = .991 (Adjusted R Squared = .989). Table A2: 30 Analysis variance of root dry mass of fifteen sweet potato cultivars as affected by soil water stress in Experiment 1b.
Source Type III Sum of Squares
df Mean Square F P(HO)
Corrected Model 113.846 29 3.926 65.555 .000 Intercept 139.917 1 139.917 2336.453 .000 Water 107.627 1 107.627 1797.252 .000 Cultivars 3.629 14 .259 4.328 .000 Water * Cultivars 2.590 14 .185 3.090 .001 Error 5.390 90 5.988E-02 Total 259.153 120 Corrected Total 119.236 119
a R Squared = .955 (Adjusted R Squared = .940).

284
Table A2: 31 Analysis variance of leaf dry matter content of fifteen sweet potato cultivars as affected by stress watered plant in Experiment 1b.
Source Type III Sum of Squares
df Mean Square F P(HO)
Corrected Model .372 29 1.281E-02 25.027 .000
Intercept 5.024 1 5.024 9815.451 .000
Water .213 1 .213 416.835 .000
Cultivars 6.886E-02 14 4.919E-03 9.610 .000
Water * Cultivars 8.932E-02 14 6.380E-03 12.464 .000
Error 4.607E-02 90 5.119E-04 Total 5.491 120 Corrected Total .418 119
a R Squared = .890 (Adjusted R Squared = .854). Table A2: 32 Analysis variance of specific leaf area of fifteen sweet potato cultivars as affected by stress water treatment in Experiment 1b.
Source Type III Sum of Squares
df Mean Square F P(HO)
Corrected Model 3.719 29 .128 6.927 .000
Intercept 3779.581 1 3779.581 204174.101 .000
Water .518 1 .518 27.979 .000
Cultivars 1.457 14 .104 5.624 .000
Water * Cultivars 1.743 14 .125 6.726 .000
Error 1.666 90 1.851E-02 Total 3784.966 120 Corrected Total 5.385 119
a R Squared = .691 (Adjusted R Squared = .591).

285
Table A2: 33 Analysis variance of leaf transpiration of fifteen sweet potato cultivars as affected by stress water conditions recorded between 7 and 27 days after planting (DAP). Data is presented from the experiment 1a.
Sum of Squares df Mean
Square F P(HO)
7 DAP Between Groups .023 14 .002 1.365 .230 (transformation) Within Groups .036 30 .001 Total .059 44
9 DAP Between Groups .095 14 .007 1.422 .203 (transformation) Within Groups .143 30 .005 Total .238 44
11 DAP Between Groups .269 14 .019 2.266 .029* (transformation) Within Groups .255 30 .008 Total .524 44
13 DAP Between Groups 1.184 14 .085 1.953 .061 (transformation) Within Groups 1.299 30 .043 Total 2.483 44
15 DAP Between Groups 1340856.53 14 95775.467 3.313 .003* Within Groups 867298.66 30 28909.956 Total 2208155.20 44
17 DAP Between Groups 3.116 14 .223 3.011 .006* (transformation) Within Groups 2.218 30 .074 Total 5.334 44 19 DAP Between Groups 3.399 14 .243 4.668 .000* transformation) Within Groups 1.560 30 .052 Total 4.959 44 21 DAP Between Groups 1.381 14 .099 2.996 .006* (transformation) Within Groups .988 30 .033 Total 2.369 44 23 DAP Between Groups .519 14 .037 1.874 .073 (transformation) Within Groups .593 30 .020 Total 1.112 44 25 DAP Between Groups 22094.578 14 1578.184 1.281 .275 Within Groups 36965.333 30 1232.178 Total 59059.911 44 27 DAP Between Groups .227 14 .016 1.192 .330 (transformation) Within Groups .400 30 .013 Total .623 44 * Significant at 0.05>P>0.01.

286
Table A2: 34. Analysis variance of leaf transpiration of fifteen sweet potato cultivars as affected by stress water conditions recorded between 7 and 27 days after planting (DAP). Data is presented from the experiment 1b.
Sum of Squares df Mean
Square F P(HO)
7 DAP Between Groups .318 14 .023 4.092 .000 (transformation) Within Groups .249 45 .006 Total .567 59
9 DAP Between Groups .154 14 .011 2.176 .025 (transformation) Within Groups .227 45 .005 Total .381 59
11 DAP Between Groups .057 14 .004 1.316 .236 (transformation) Within Groups .138 45 .003 Total .195 59
13 DAP Between Groups .017 14 .001 1.337 .224 (transformation) Within Groups .040 45 .001 Total .057 59
15 DAP Between Groups .012 14 .001 1.267 .265 Within Groups .032 45 .001 Total .044 59
17 DAP Between Groups .016 14 .001 2.115 .029 (transformation) Within Groups .025 45 .001 Total .041 59 19 DAP Between Groups .011 14 .001 1.537 .137 (transformation) Within Groups .023 45 .001 Total .033 59 21 DAP Between Groups .014 14 .00 2.457 .011 (transformation) Within Groups .018 45 .001 Total .031 59 * Significant at 0.05>P>0.01. Table A2: 35 Analysis variance of the number of days to reach permanent wilting point of fifteen sweet potato cultivars as affected by water stress conditions in Experiment 1b.
Sum of Squares df Mean Square F P(HO)
Between Groups 216.500 14 15.464 12.317 .000 Within Groups 56.500 45 1.256 Total 273.000 59

287
Table A2: 36 Analysis variance of leaf water potential of fifteen sweet potato cultivars as affected by water stress conditions in Experiment 1b.
Source Type III Sum of Squares df Mean Square F P(HO)
Corrected Model 2879.925 29 99.308 102.110 .000 Intercept 6264.509 1 6264.509 6441.310 .000 Water 2845.541 1 2845.541 2925.850 .000 Cultivars 21.005 14 1.500 1.543 .112 Water * Cultivars 13.379 14 .956 .983 .477 Error 87.530 90 .973 Total 9231.963 120 Corrected Total 2967.455 119
a R Squared = .971 (Adjusted R Squared = .961). Table A2: 37 Analysis variance of the fresh plant mass of fifteen sweet potato cultivars grown under normal watering conditions in the field. Data was transformed into natural logarithmic.
Sum of Squares df Mean Square F P(HO)
Between Groups 6.672 14 .477 5.282 .000 Within Groups 6.677 74 .090 Total 13.349 88 Table A2: 38 Analysis variance of the tuber number of fifteen sweet potato cultivars grown under normal watering conditions in the field.
Sum of Squares df Mean Square F P(HO)
Between Groups 17.082 13 1.314 14.973 .000 Within Groups 6.055 69 .088 Total 23.137 82 Table A2: 39 Analysis variance of mass of tubers of fifteen sweet potato cultivars grown under normal watering conditions in the field.
Sum of Squares df Mean Square F P(HO)
Between Groups 40.875 13 2.920 35.269 .000 Within Groups 6.209 69 .083 Total 47.083 82

288
APPENDIX A3
PLANT MEASUREMENTS AND RESULTS OF STATISTICAL ANALYSES OF CHAPTER 3
Table A3: 1 Analysis variance of the main stem length as affected by soil water levels and sweet potato cultivars (Lole and Wanmun) at 1 month after planting (data was transformed into ln transformation).
Source Type III Sum of Squares df Mean Square F P(H0)
Corrected Model 15.732 5 3.146 659.044 .000
Intercept 342.807 1 342.807 71802.017 .000
Water levels .717 2 .358 75.041 .000
Cultivars 14.842 1 14.842 3108.686 .000
Water * Cultivar .174 2 8.702E-02 18.227 .000
Error 8.594E-02 18 4.774E-03
Total 358.625 24
Corrected Total 15.818 23 a R Squared = .995 (Adjusted R Squared = .993). Table A3: 2 Analysis variance of main stem length as affected by soil water levels and sweet potato cultivars (Lole and Wanmun) at 2 months after planting.
Source Type III Sum of Squares df Mean Square F P(H0)
Corrected Model 65126.05 5 13025.21 188.97 .000
Intercept 151765.51 1 151765.51 2201.82 .000
Water levels 12818.14 2 6409.07 92.98 .000
Cultivars 48195.84 1 48195.84 699.22 .000
Water * Cultivar 4112.06 2 2056.03 29.82 .000
Error 1240.68 18 68.92
Total 218132.25 24
Corrected Total 66366.74 23 a R Squared = .981 (Adjusted R Squared = .976).

289
Table A3: 3 Analysis variance of main stem length as affected by soil water levels and sweet potato cultivars (Lole and Wanmun) at 3 months after planting (data was transformed into ln transformation).
Source Type III Sum of Squares df Mean Square F P(H0)
Corrected Model 9.34 5 1.869 1460.564 .000
Intercept 439.25 1 439.25 343249.2 .000
Water 1.74 2 .87 679.83 .000
Cultivar 7.56 1 7.56 5907.871 .000
Water * Cultivar 4.516E-0 2 2.258E-0 17.64 .000
Error 2.303E-02 18 1.280E-03
Total 448.624 24
Corrected Total 9.368 23 a R Squared = .998 (Adjusted R Squared = .997). Table A3: 4 Analysis variance of main stem length as affected by soil water levels and sweet potato cultivars (Lole and Wanmun) at 4 months after planting.
Source Type III Sum of Squares df Mean Square F P(H0)
Corrected Model 61183.875 5 12236.775 1091.757 .000
Intercept 175959.375 1 175959.375 15698.978 .000
Water levels 11489.250 2 5744.625 512.532 .000
Cultivars 46552.042 1 46552.042 4153.342 .000
Water * Cultivar 3142.583 2 1571.292 140.190 .000
Error 201.750 18 11.208
Total 237345.000 24
Corrected Total 61385.625 23 a R Squared = .997 (Adjusted R Squared = .996). Table A3: 5 Analysis variance of main stem length as affected by soil water levels and sweet potato cultivars (Lole and Wanmun) at 5 months after planting (data was transformed into ln transformation).
Source Type III Sum of Squares df Mean Square F P(H0)
Corrected Model 9.165 5 1.833 281.564 .000
Intercept 418.150 1 418.150 64230.128 .000
Water levels 2.248 2 1.124 172.648 .000
Cultivars 6.755 1 6.755 1037.563 .000
Water * Cultivar .162 2 8.124E-02 12.479 .000
Error .117 18 6.510E-03
Total 427.432 24
Corrected Total 9.282 23 a R Squared = .987 (Adjusted R Squared = .984).

290
Table A3: 6 Analysis variance of branch number as affected by soil water levels and sweet potato cultivars (Lole and Wanmun) at 1 month after planting (data was transformed into ln transformation).
Source Type III Sum of Squares df Mean Square F P(H0)
Corrected Model 21.389 5 4.278 365.393 .000
Intercept 32.599 1 32.599 2784.482 .000
Water levels 1.358 2 .679 58.009 .000
Cultivars 19.466 1 19.466 1662.772 .000
Water * Cultivar .564 2 .282 24.089 .000
Error .211 18 1.171E-02
Total 54.198 24
Corrected Total 21.599 23 a R Squared = .990 (Adjusted R Squared = .998). Table A3: 7 Analysis variance of branch number as affected by soil water levels and sweet potato cultivars (Lole and Wanmun) at 2 months after planting.
Source Type III Sum of Squares df Mean Square F P(H0)
Corrected Model 396.000 5 79.200 142.560 .000
Intercept 1176.000 1 1176.000 2116.800 .000
Water levels 60.250 2 30.125 54.225 .000
Cultivars 308.167 1 308.167 554.700 .000
Water * Cultivar 27.583 2 13.792 24.825 .000
Error 10.000 18 .556
Total 1582.000 24
Corrected Total 406.000 23 a R Squared = .975 (Adjusted R Squared = .969). Table A3: 8 Analysis variance of branch number as affected by soil water levels and sweet potato cultivars (Lole and Wanmun) at 3 months after planting.
Source Type III Sum of Squares df Mean Square F P(H0)
Corrected Model 1801.833 5 360.367 682.800 .000
Intercept 2816.667 1 2816.667 5336.842 .000
Water levels 371.083 2 185.542 351.553 .000
Cultivars 1204.167 1 1204.167 2281.579 .000
Water * Cultivar 226.583 2 113.292 214.658 .000
Error 9.500 18 .528
Total 4628.000 24
Corrected Total 1811.333 23 a R Squared = .995 (Adjusted R Squared = .993).

291
Table A3: 9 Analysis variance of branch number as affected by soil water levels and sweet potato cultivars (Lole and Wanmun) at 4 months after planting.
Source Type III Sum of Squares df Mean Square F P(H0)
Corrected Model 1748.875 5 349.775 645.738 .000
Intercept 2838.375 1 2838.375 5240.077 .000
Water levels 392.250 2 196.125 362.077 .000
Cultivars 1134.375 1 1134.375 2094.231 .000
Water * Cultivar 222.250 2 111.125 205.154 .000
Error 9.750 18 .542
Total 4597.000 24
Corrected Total 1758.625 23 a R Squared = .994 (Adjusted R Squared = .993). Table A3: 10 Analysis variance of branch number as affected by soil water levels and sweet potato cultivars (Lole and Wanmun) at 5 months after planting (data was transformed into ln transformation).
Source Type III Sum of Squares df Mean Square F P(H0)
Corrected Model 1548.833 5 309.767 796.543 .000
Intercept 2604.167 1 2604.167 6696.429 .000
Water levels 416.083 2 208.042 534.964 .000
Cultivars 912.667 1 912.667 2346.857 .000
Water * Cultivar 220.083 2 110.042 282.964 .000
Error 7.000 18 .389
Total 4160.000 24
Corrected Total 1555.833 23 a R Squared = .996 (Adjusted R Squared = .994). Table A3: 11 Analysis of variance on the biomass fresh weight of Lole and Wanmun sweet potato cultivars at one month after planting as affected by different soil water levels in experiment 2b.
Source Type III Sum of Squares df Mean Square F P(H0)
Corrected Model 7.487 5 1.497 625.28 .000
Intercept 439.296 1 439.296 183431.18 .000
Water levels 2.706 2 1.353 564.91 .000
Cultivars 4.211 1 4.211 1758.51 .000
Water *Cultivar .570 2 .285 119.03 .000
Error 4.311E-02 18 2.395E-03
Total 446.827 24
Corrected Total 7.53 23 R Squared = .994 (Adjusted R Squared = .993).

292
Table A3: 12 Analysis of variance on the biomass fresh weight of Lole and Wanmun sweet potato cultivars at two months after planting as affected by different soil water levels in experiment 2b.
Source Type III Sum of Squares df Mean Square F P(H0)
Corrected Model 319015.542 5 63803.108 236.324 .000
Intercept 1299350.270 1 1299350.270 4812.748 .000
Water levels 282678.516 2 141339.258 523.516 .000
Cultivars 34088.344 1 34088.344 126.262 .000
Water * Cultivar 2248.682 2 1124.341 4.165 .033
Error 4859.657 18 269.981
Total 1623225.470 24
Corrected Total 323875.200 23 a R Squared = .985 (Adjusted R Squared = .981). Table A3: 13 Analysis of variance on the biomass fresh weight of Lole and Wanmun sweet potato cultivars at three months after planting as affected by different soil water levels in experiment 2b.
Source Type III Sum of Squares df Mean Square F P(H0)
Corrected Model 240436.732 5 48087.346 245.901 .000
Intercept 1179843.070 1 1179843.070 6033.276 .000
Water levels 188344.981 2 94172.490 481.563 .000
Cultivars 45823.820 1 45823.820 234.326 .000
Water * Cultivar 6267.931 2 3133.965 16.026 .000
Error 3520.007 18 195.556
Total 1423799.810 24
Corrected Total 243956.740 23 a R Squared = .986 (Adjusted R Squared = .982). Table A3: 14 Analysis of variance on the biomass fresh weight of Lole and Wanmun sweet potato cultivars at four months after planting as affected by different soil water levels in experiment 2b.
Source Type III Sum of Squares df Mean Square F P(H0)
Corrected Model 141787.753 5 28357.551 1048.855 .000
Intercept 789452.827 1 789452.827 29199.340 .000
Water levels 130474.301 2 65237.150 2412.914 .000
Cultivars 9809.127 1 9809.127 362.808 .000
Water * Cultivar 1504.326 2 752.163 27.820 .000
Error 486.660 18 27.037
Total 931727.240 24
Corrected Total 142274.413 23 a R Squared = .997 (Adjusted R Squared = .996).

293
Table A3: 15 Analysis of variance on the biomass fresh weight of Lole and Wanmun sweet potato cultivars at five months after planting as affected by different soil water levels in experiment 2b.
Source Type III Sum of Squares df Mean Square F P(H0)
Corrected Model 98415.325 5 19683.06 367.48 .000
Intercept 537123.840 1 537123.84 10028.08 .000
Water levels 92681.417 2 46340.70 865.18 .000
Cultivars 4224.107 1 4224.10 78.86 .000
Water * Cultivar 1509.801 2 754.90 14.09 .000
Error 964.115 18 53.56
Total 636503.280 24
Corrected Total 99379.440 23 a R Squared = .990 (Adjusted R Squared = .988). Table A3: 16 Analysis of variance on the biomass dry weight of Lole and Wanmun sweet potato cultivars at one month after planting as affected by different soil water levels in experiment 2b (data was transformed using ln transformation).
Source Type III Sum of Squares df Mean Square F P(H0)
Corrected Model 5.600 5 1.120 174.747 .000
Intercept 99.522 1 99.522 15526.910 .000
Water levels 1.731 2 .866 135.069 .000
Cultivars 3.663 1 3.663 571.426 .000
Water * Cultivar .206 2 .103 16.086 .000
Error .115 18 6.410E-03
Total 105.238 24
Corrected Total 5.716 23 a R Squared = .980 (Adjusted R Squared = .974). Table A3: 17 Analysis of variance on the biomass dry weight of Lole and Wanmun sweet potato cultivars at two months after planting as affected by different soil water levels in experiment 2b (data was transformed using ln transformation).
Source Type III Sum of Squares df Mean Square F P(H0)
Corrected Model 8.811 5 1.762 187.612 .000
Intercept 233.753 1 233.753 24887.069 .000
Water levels 7.641 2 3.820 406.738 .000
Cultivars .690 1 .690 73.503 .000
Water * Cultivar .480 2 .240 25.542 .000
Error .169 18 9.393E-03
Total 242.733 24
Corrected Total 8.980 23 a R Squared = .981 (Adjusted R Squared = .976).

294
Table A3: 18 Analysis of variance on the biomass dry weight of Lole and Wanmun sweet potato cultivars at three months after planting as affected by different soil water levels in experiment 2b (data was transform using ln transformation).
Source Type III Sum of Squares df Mean Square F P(H0)
Corrected Model 4.878 5 .976 290.846 .000
Intercept 229.133 1 229.133 68309.314 .000
Water levels 4.652 2 2.326 693.484 .000
Cultivars .141 1 .141 42.033 .000
Water * Cultivar 8.463E-02 2 4.231E-02 12.615 .000
Error 6.038E-02 18 3.354E-03
Total 234.071 24
Corrected Total 4.938 23 a R Squared = .988(Adjusted R Squared = .984). Table A3: 19 Analysis of variance on the biomass dry weight of Lole and Wanmun sweet potato cultivars at four months after planting as affected by different soil water levels.
Source Type III Sum of Squares df Mean Square F P(H0)
Corrected Model 4306.193 5 861.239 165.120 .000
Intercept 16716.482 1 16716.482 3204.949 .000
Water levels 4164.516 2 2082.258 399.219 .000
Cultivars 6.615 1 6.615 1.268 .275
Water * Cultivar 135.063 2 67.531 12.947 .000
Error 93.885 18 5.216
Total 21116.560 24
Corrected Total 4400.078 23 a R Squared = .979 (Adjusted R Squared = .973). Table A3: 20 Analysis of variance on the biomass dry weight of Lole and Wanmun sweet potato cultivars at five months after planting as affected by different soil water levels in experiment 2b.
Source Type III Sum of Squares df Mean Square F P(H0)
Corrected Model 3008.129 5 601.626 162.242 .000
Intercept 10647.094 1 10647.094 2871.234 .000
Water levels 2699.377 2 1349.689 363.975 .000
Cultivars 1.084 1 1.084 .292 .595
Water * Cultivar 307.668 2 153.834 41.485 .000
Error 66.747 18 3.708
Total 13721.970 24
Corrected Total 3074.876 23 a R Squared = .978 (Adjusted R Squared = .972).
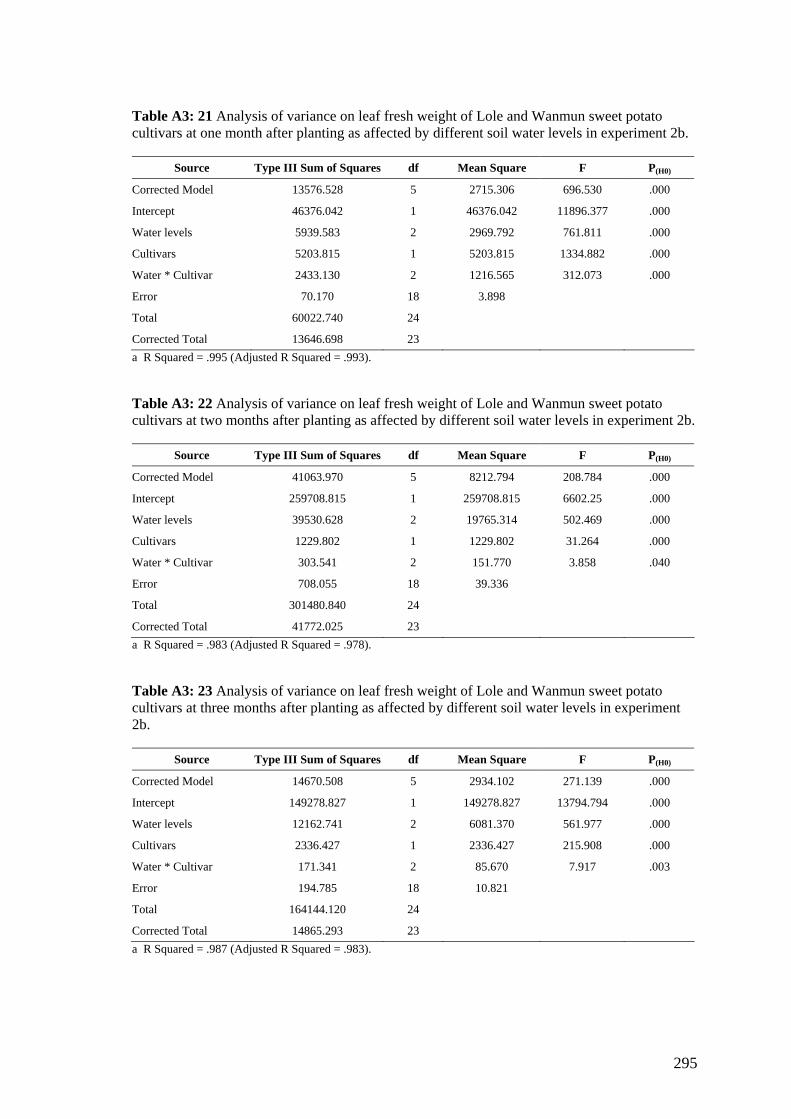
295
Table A3: 21 Analysis of variance on leaf fresh weight of Lole and Wanmun sweet potato cultivars at one month after planting as affected by different soil water levels in experiment 2b.
Source Type III Sum of Squares df Mean Square F P(H0)
Corrected Model 13576.528 5 2715.306 696.530 .000
Intercept 46376.042 1 46376.042 11896.377 .000
Water levels 5939.583 2 2969.792 761.811 .000
Cultivars 5203.815 1 5203.815 1334.882 .000
Water * Cultivar 2433.130 2 1216.565 312.073 .000
Error 70.170 18 3.898
Total 60022.740 24
Corrected Total 13646.698 23 a R Squared = .995 (Adjusted R Squared = .993). Table A3: 22 Analysis of variance on leaf fresh weight of Lole and Wanmun sweet potato cultivars at two months after planting as affected by different soil water levels in experiment 2b.
Source Type III Sum of Squares df Mean Square F P(H0)
Corrected Model 41063.970 5 8212.794 208.784 .000
Intercept 259708.815 1 259708.815 6602.25 .000
Water levels 39530.628 2 19765.314 502.469 .000
Cultivars 1229.802 1 1229.802 31.264 .000
Water * Cultivar 303.541 2 151.770 3.858 .040
Error 708.055 18 39.336
Total 301480.840 24
Corrected Total 41772.025 23 a R Squared = .983 (Adjusted R Squared = .978). Table A3: 23 Analysis of variance on leaf fresh weight of Lole and Wanmun sweet potato cultivars at three months after planting as affected by different soil water levels in experiment 2b.
Source Type III Sum of Squares df Mean Square F P(H0)
Corrected Model 14670.508 5 2934.102 271.139 .000
Intercept 149278.827 1 149278.827 13794.794 .000
Water levels 12162.741 2 6081.370 561.977 .000
Cultivars 2336.427 1 2336.427 215.908 .000
Water * Cultivar 171.341 2 85.670 7.917 .003
Error 194.785 18 10.821
Total 164144.120 24
Corrected Total 14865.293 23 a R Squared = .987 (Adjusted R Squared = .983).
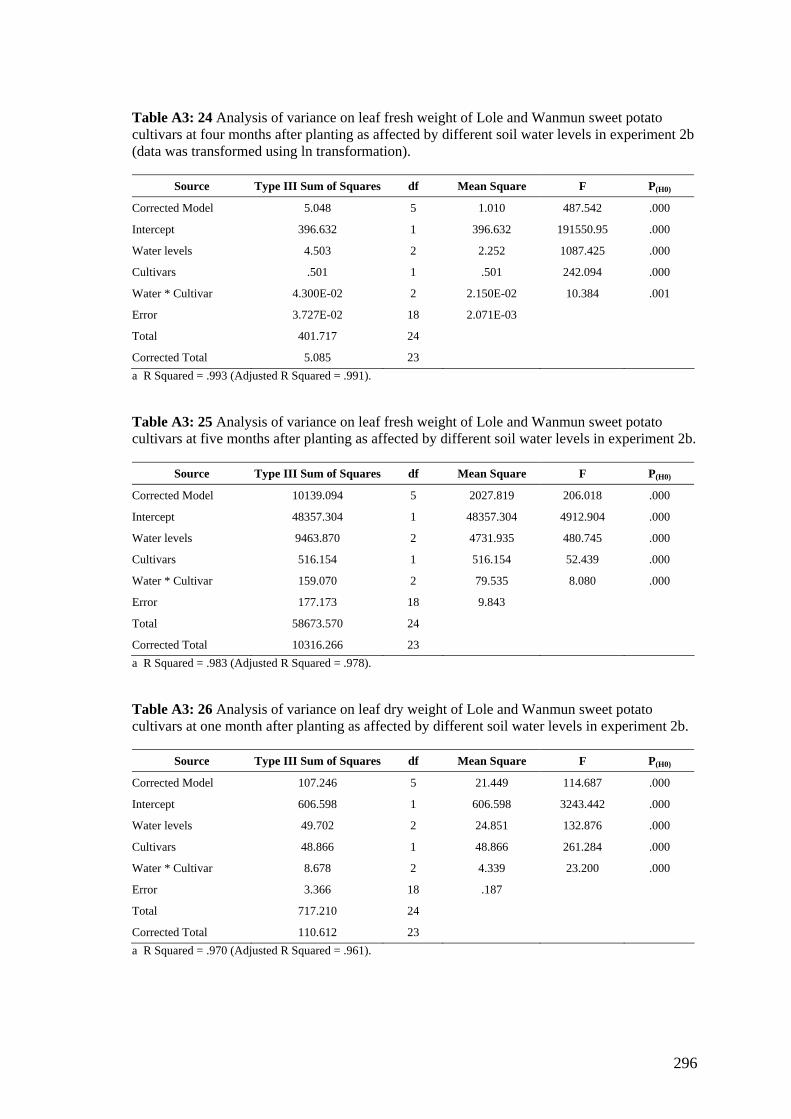
296
Table A3: 24 Analysis of variance on leaf fresh weight of Lole and Wanmun sweet potato cultivars at four months after planting as affected by different soil water levels in experiment 2b (data was transformed using ln transformation).
Source Type III Sum of Squares df Mean Square F P(H0)
Corrected Model 5.048 5 1.010 487.542 .000
Intercept 396.632 1 396.632 191550.95 .000
Water levels 4.503 2 2.252 1087.425 .000
Cultivars .501 1 .501 242.094 .000
Water * Cultivar 4.300E-02 2 2.150E-02 10.384 .001
Error 3.727E-02 18 2.071E-03
Total 401.717 24
Corrected Total 5.085 23 a R Squared = .993 (Adjusted R Squared = .991). Table A3: 25 Analysis of variance on leaf fresh weight of Lole and Wanmun sweet potato cultivars at five months after planting as affected by different soil water levels in experiment 2b.
Source Type III Sum of Squares df Mean Square F P(H0)
Corrected Model 10139.094 5 2027.819 206.018 .000
Intercept 48357.304 1 48357.304 4912.904 .000
Water levels 9463.870 2 4731.935 480.745 .000
Cultivars 516.154 1 516.154 52.439 .000
Water * Cultivar 159.070 2 79.535 8.080 .000
Error 177.173 18 9.843
Total 58673.570 24
Corrected Total 10316.266 23 a R Squared = .983 (Adjusted R Squared = .978). Table A3: 26 Analysis of variance on leaf dry weight of Lole and Wanmun sweet potato cultivars at one month after planting as affected by different soil water levels in experiment 2b.
Source Type III Sum of Squares df Mean Square F P(H0)
Corrected Model 107.246 5 21.449 114.687 .000
Intercept 606.598 1 606.598 3243.442 .000
Water levels 49.702 2 24.851 132.876 .000
Cultivars 48.866 1 48.866 261.284 .000
Water * Cultivar 8.678 2 4.339 23.200 .000
Error 3.366 18 .187
Total 717.210 24
Corrected Total 110.612 23 a R Squared = .970 (Adjusted R Squared = .961).

297
Table A3: 27 Analysis of variance on leaf dry weight of Lole and Wanmun sweet potato cultivars at two months after planting as affected by different soil water levels in experiment 2b. .
Source Type III Sum of Squares df Mean Square F P(H0)
Corrected Model 409.263 5 81.853 212.219 .000
Intercept 3142.248 1 3142.248 8146.914 .000
Water levels 371.560 2 185.780 481.672 .000
Cultivars 32.308 1 32.308 83.766 .000
Water * Cultivar 5.394 2 2.697 6.993 .000
Error 6.943 18 .386
Total 3558.453 24
Corrected Total 416.205 23 a R Squared = .983 (Adjusted R Squared = .979). Table A3: 28 Analysis of variance on leaf dry weight of Lole and Wanmun sweet potato cultivars at three months after planting as affected by different soil water levels in experiment 2b.
Source Type III Sum of Squares df Mean Square F P(H0)
Corrected Model 421.928 5 84.386 82.238 .000
Intercept 3290.042 1 3290.042 3206.321 .000
Water levels 421.023 2 210.512 205.155 .000
Cultivars .482 1 .482 .469 .502
Water * Cultivar .423 2 .212 .206 .816
Error 18.470 18 1.026
Total 3730.440 24
Corrected Total 440.398 23 a R Squared = .958 (Adjusted R Squared = .946). Table A3: 29 Analysis of variance on leaf dry weight of Lole and Wanmun sweet potato cultivars at four months after planting as affected by different soil water levels in experiment 2b (data was transformed using ln transformation).
Source Type III Sum of Squares df Mean Square F P(H0)
Corrected Model 8.942 5 1.788 167.006 .000
Intercept 87.267 1 87.267 8148.983 .000
Water levels 8.665 2 4.333 404.585 .000
Cultivars .214 1 .214 20.006 .000
Water * Cultivar 6.269E-02 2 3.134E-02 2.927 .079
Error .193 18 1.071E-02
Total 96.402 24
Corrected Total 9.135 23 a R Squared = .979 (Adjusted R Squared = .973).
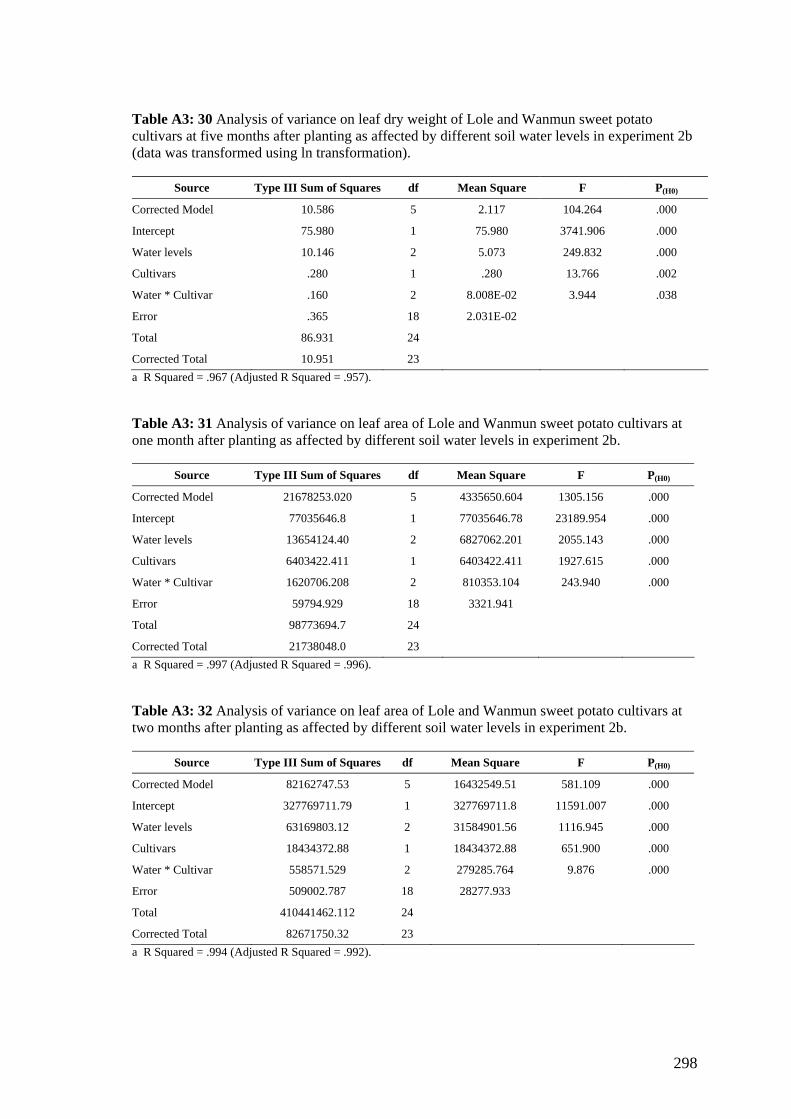
298
Table A3: 30 Analysis of variance on leaf dry weight of Lole and Wanmun sweet potato cultivars at five months after planting as affected by different soil water levels in experiment 2b (data was transformed using ln transformation).
Source Type III Sum of Squares df Mean Square F P(H0)
Corrected Model 10.586 5 2.117 104.264 .000
Intercept 75.980 1 75.980 3741.906 .000
Water levels 10.146 2 5.073 249.832 .000
Cultivars .280 1 .280 13.766 .002
Water * Cultivar .160 2 8.008E-02 3.944 .038
Error .365 18 2.031E-02
Total 86.931 24
Corrected Total 10.951 23 a R Squared = .967 (Adjusted R Squared = .957). Table A3: 31 Analysis of variance on leaf area of Lole and Wanmun sweet potato cultivars at one month after planting as affected by different soil water levels in experiment 2b.
Source Type III Sum of Squares df Mean Square F P(H0)
Corrected Model 21678253.020 5 4335650.604 1305.156 .000
Intercept 77035646.8 1 77035646.78 23189.954 .000
Water levels 13654124.40 2 6827062.201 2055.143 .000
Cultivars 6403422.411 1 6403422.411 1927.615 .000
Water * Cultivar 1620706.208 2 810353.104 243.940 .000
Error 59794.929 18 3321.941
Total 98773694.7 24
Corrected Total 21738048.0 23 a R Squared = .997 (Adjusted R Squared = .996). Table A3: 32 Analysis of variance on leaf area of Lole and Wanmun sweet potato cultivars at two months after planting as affected by different soil water levels in experiment 2b.
Source Type III Sum of Squares df Mean Square F P(H0)
Corrected Model 82162747.53 5 16432549.51 581.109 .000
Intercept 327769711.79 1 327769711.8 11591.007 .000
Water levels 63169803.12 2 31584901.56 1116.945 .000
Cultivars 18434372.88 1 18434372.88 651.900 .000
Water * Cultivar 558571.529 2 279285.764 9.876 .000
Error 509002.787 18 28277.933
Total 410441462.112 24
Corrected Total 82671750.32 23 a R Squared = .994 (Adjusted R Squared = .992).

299
Table A3: 33 Analysis of variance on leaf area of Lole and Wanmun sweet potato cultivars at two months after planting as affected by different soil water levels in experiment 2b.
Source Type III Sum of Squares df Mean Square F P(H0)
Corrected Model 82162747.53 5 16432549.51 581.109 .000
Intercept 327769711.79 1 327769711.8 11591.007 .000
Water levels 63169803.12 2 31584901.56 1116.945 .000
Cultivars 18434372.88 1 18434372.88 651.900 .000
Water * Cultivar 558571.529 2 279285.764 9.876 .000
Error 509002.787 18 28277.933
Total 410441462.112 24
Corrected Total 82671750.32 23 a R Squared = .994 (Adjusted R Squared = .992). Table A3: 34 Analysis of variance on leaf area of Lole and Wanmun sweet potato cultivars at three months after planting as affected by different soil water levels in experiment 2b.
Source Type III Sum of Squares df Mean Square F P(H0)
Corrected Model 77095072.00 5 15419014.40 750.412 .000
Intercept 258854207.04 1 258854207.04 12597.908 .000
Water levels 56615814.69 2 28307907.35 1377.688 .000
Cultivars 19189889.68 1 19189889.68 933.933 .000
Water * Cultivar 1289367.636 2 644683.818 31.375 .000
Error 369853.123 18 20547.396
Total 336319132.17 24
Corrected Total 77464925.13 23 a R Squared = .995 (Adjusted R Squared = .994). Table A3: 35 Analysis of variance on the leaf area of Lole and Wanmun sweet potato cultivars at four months after planting as affected by different soil water levels in experiment 2b.
Source Type III Sum of Squares df Mean Square F P(H0)
Corrected Model 18354107.73 5 3670821.546 663.978 .000
Intercept 99652699.65 1 99652699.65 18025.175 .000
Water levels 15420913.72 2 7710456.864 1394.667 .000
Cultivars 2594199.138 1 2594199.138 469.239 .000
Water * Cultivar 338994.865 2 169497.432 30.659 .000
Error 99513.518 18 5528.529
Total 118106320.891 24
Corrected Total 18453621.24 23 a R Squared = .995(Adjusted R Squared = .993).

300
Table A3: 36 Analysis of variance on the leaf area of Lole and Wanmun sweet potato cultivars at five months after planting as affected by different soil water levels in experiment 2b.
Source Type III Sum of Squares df Mean Square F P(H0)
Corrected Model 4883599.501 5 976719.900 248.134 .000
Intercept 50529740.08 1 50529740.08 12837.013 .000
Water levels 4313127.082 2 2156563.541 547.872 .000
Cultivars 93238.200 1 93238.200 23.687 .000
Water * Cultivar 477234.219 2 238617.110 60.620 .000
Error 70852.564 18 3936.254
Total 55484192.14 24
Corrected Total 4954452.065 23 a R Squared = .986 (Adjusted R Squared = .982). Table A3: 37 Analysis of variance of the leaf senescence of Lole and Wanmun sweet potato cultivars affected by different soil water levels after being transformed to ln in experiment 2b.
Source Type III Sum of Squares df Mean Square F P(H0)
Corrected Model 15.248 5 3.050 94.424 .000
Intercept 157.723 1 157.723 4883.665 .000
Water levels 8.402 2 4.201 130.083 .000
Cultivars 6.430 1 6.430 199.091 .000
Water * Cultivar .415 2 .208 6.431 .003
Error 1.744 54 3.230E-02
Total 174.715 60
Corrected Total 16.992 59 a R Squared = .897 (Adjusted R Squared = .888). Table A3: 38 Analysis of variance of root fresh weight of Lole and Wanmun sweet potato cultivars at one month after planting as affected by different soil water levels in experiment 2b (data was transformed using ln transformation).
Source Type III Sum of Squares df Mean Square F P(H0)
Corrected Model 10.247 5 2.049 368.753 .000
Intercept 163.284 1 163.284 29379.886 .000
Water levels .645 2 .322 57.989 .000
Cultivars 9.308 1 9.308 1674.767 .000
Water * Cultivar .295 2 .147 26.510 .000
Error .100 18 5.558E-03
Total 173.632 24
Corrected Total 10.347 23 a R Squared = .990(Adjusted R Squared = .988).

301
Table A3: 39 Analysis of variance of root fresh weight of Lole and Wanmun sweet potato cultivars at two months after planting as affected by different soil water levels in experiment 2b (data was transformed using ln transformation).
Source Type III Sum of Squares df Mean Square F P(H0)
Corrected Model 6.120 5 1.224 432.637 .000
Intercept 301.329 1 301.329 106500.78 .000
Water levels 3.282 2 1.641 580.018 .000
Cultivars .101 1 .101 35.558 .000
Water * Cultivar 2.738 2 1.369 483.795 .001
Error 5.093E-02 18 2.829E-03
Total 307.500 24
Corrected Total 6.171 23 a R Squared = .992 (Adjusted R Squared = .989). Table A3: 40 Analysis of variance on the root fresh weight of Lole and Wanmun sweet potato cultivars at three months after planting as affected by different soil water levels in experiment 2b.
Source Type III Sum of Squares df Mean Square F P(H0)
Corrected Model 12340.055 5 2468.011 213.347 .000
Intercept 72765.204 1 72765.204 6290.186 .000
Water levels 1795.124 2 897.562 77.590 .000
Cultivars 6464.917 1 6464.917 558.860 .000
Water * Cultivar 4080.015 2 2040.008 176.348 .000
Error 208.225 18 11.568
Total 85313.484 24
Corrected Total 12548.280 23 a R Squared = .983 (Adjusted R Squared = .979). Table A3: 41 Analysis of variance on the root fresh weight of Lole and Wanmun sweet potato cultivars at four months after planting as affected by different soil water levels after being transformed to ln in experiment 2b (data was transformed using ln transformation).
Source Type III Sum of Squares df Mean Square F P(H0)
Corrected Model 15.504 5 3.101 381.502 0.000
Intercept 364.981 1 364.981 44906.099 0.000
Water levels 4.064 2 2.032 250.031 0.000
Cultivars 8.842 1 8.842 1087.917 0.000
Water * Cultivar 2.597 2 1.299 159.765 0.000
Error .146 18 8.128E-03
Total 380.631 24
Corrected Total 15.650 23 a R Squared = .991 (Adjusted R Squared = .988).

302
Table A3: 42 Analysis of variance on the root fresh weight of Lole and Wanmun sweet potato cultivars at five months after planting as affected by different soil water levels in experiment 2b (data was transformed using ln transformation).
Source Type III Sum of Squares df Mean Square F P(H0)
Corrected Model 12.714 5 2.543 116.041 .000
Intercept 327.113 1 327.113 14927.867 .000
Water 2.959 2 1.480 67.525 .000
Cultivar 7.360 1 7.360 335.853 .000
Water * Cultivar 2.395 2 1.198 54.652 .000
Error .394 18 2.191E-02
Total 340.221 24
Corrected Total 13.108 23 a R Squared = .970 (Adjusted R Squared = .962). Table A3: 43 Analysis of variance on the root dry weight of Lole and Wanmun sweet potato cultivars at one month after planting as affected by different soil water levels in experiment 2b (data was transformed using ln transformation).
Source Type III Sum of Squares df Mean Square F P(H0)
Corrected Model 3.877 5 .775 84.021 .000
Intercept 38.947 1 38.947 4220.447 .000
Water levels .363 2 .182 19.679 .000
Cultivars 3.238 1 3.238 350.831 .000
Water * Cultivar .276 2 .138 14.95 .000
Error .166 18 9.228E-03
Total 42.990 24
Corrected Total 4.043 23 a R Squared = .959 (Adjusted R Squared = .948). Table A3: 44 Analysis of variance on the root dry weight of Lole and Wanmun sweet potato cultivars at two months after planting as affected by different soil water levels in experiment 2b.
Source Type III Sum of Squares df Mean Square F P(H0)
Corrected Model 317.662 5 63.532 49.246 .000
Intercept 1942.560 1 1942.560 1505.728 .000
Water levels 266.126 2 133.063 103.141 .000
Cultivars 41.870 1 41.870 32.455 .000
Water * Cultivar 9.666 2 4.833 3.746 .044
Error 23.222 18 1.290
Total 2283.445 24
Corrected Total 340.884 23 a R Squared = .932 (Adjusted R Squared = .913).

303
Table A3: 45 Analysis of variance on the root dry weight of Lole and Wanmun sweet potato cultivars at three months after planting as affected by different soil water levels in experiment 2b (data was transformed using ln transformations).
Source Type III Sum of Squares df Mean Square F P(H0)
Corrected Model 4.545 5 .909 37.780 .000
Intercept 111.697 1 111.697 4642.695 .000
Water levels 2.581 2 1.290 53.633 .000
Cultivars .962 1 .962 40.004 .000
Water * Cultivar 1.002 2 .501 20.814 .000
Error .433 18 2.406E-02
Total 116.674 24
Corrected Total 4.978 23 a R Squared = .913 (Adjusted R Squared = .889). Table A3: 46 Analysis of variance on the root dry weight of Lole and Wanmun sweet potato cultivars at four months after planting as affected by different soil water levels in experiment 2b (data was transformed using ln transformations).
Source Type III Sum of Squares df Mean Square F P(H0)
Corrected Model 8.223 5 1.645 110.112 .000
Intercept 103.660 1 103.660 6940.313 .000
Water levels 2.703 2 1.352 90.499 .000
Cultivars 2.899 1 2.899 194.120 .000
Water * Cultivar 2.620 2 1.310 87.720 .000
Error .269 18 1.494E-02
Total 112.152 24
Corrected Total 8.492 23 a R Squared = .968 (Adjusted R Squared = .960). Table A3: 47 Analysis of variance on the root dry weight of Lole and Wanmun sweet potato cultivars at five months after planting as affected by different soil water levels in experiment 2b.
Source Type III Sum of Squares df Mean Square F P(H0)
Corrected Model 558.707 5 111.741 147.270 .000
Intercept 1299.776 1 1299.776 1713.049 .000
Water levels 252.553 2 126.276 166.427 .000
Cultivars 109.312 1 109.312 144.069 .000
Water * Cultivar 196.843 2 98.421 129.715 .000
Error 13.658 18 .759
Total 1872.141 24
Corrected Total 572.365 23 a R Squared = .976 (Adjusted R Squared = .970).

304
Table A3: 48 Analysis of variance of leaf transpiration as affected by water stress levels and sweet potato cultivars (Lole and Wanmun), at 1 month after planting.
Source Type III Sum of Squares df Mean Square F P(H0)
Corrected Model 174089.810 5 34817.962 217.063 .000
Intercept 1661972.280 1 1661972.280 10361.126 .000
Water levels 124409.685 2 62204.843 387.800 .000
Cultivars 40833.333 1 40833.333 254.565 .000
Water * Cultivar 8846.792 2 4423.396 27.576 .000
Error 6736.993 42 160.405
Total 1842799.083 48
Corrected Total 180826.803 47 a R Squared = .963 (Adjusted R Squared = .958). Table A3: 49 Analysis of variance of leaf transpiration as affected by water stress levels and sweet potato cultivars (Lole and Wanmun), at 2 months after planting.
Source Type III Sum of Squares df Mean Square F P(H0)
Corrected Model 2355367.373 5 471073.475 1648.707 .000
Intercept 9416686.740 1 9416686.740 32957.406 .000
Water levels 2123791.556 2 1061895.778 3716.523 .000
Cultivars 214563.674 1 214563.674 750.950 .000
Water * Cultivar 17012.143 2 8506.072 29.770 .000
Error 12000.363 42 285.723
Total 11784054.47 48
Corrected Total 2367367.736 47 a R Squared = .995 (Adjusted R Squared = .994). Table A3: 50 Analysis of variance of leaf transpiration as affected by water stress levels and sweet potato cultivars (Lole and Wanmun), at 3 months after planting.
Source Type III Sum of Squares df Mean Square F P(H0)
Corrected Model 3665504.800 5 733100.960 7385.673 .000
Intercept 16828361.69 1 16828361.69 169538.41 .000
Water levels 3535936.657 2 1767968.329 17811.511 .000
Cultivars 120377.439 1 120377.439 1212.750 .000
Water * Cultivar 9190.704 2 4595.352 46.296 .000
Error 4168.915 42 99.260
Total 20498035.41 48
Corrected Total 3669673.715 47 a R Squared = .999 (Adjusted R Squared = .999).

305
Table A3: 51 Analysis of variance of leaf transpiration as affected by water stress levels and sweet potato cultivars (Lole and Wanmun), 4 months after planting.
Source Type III Sum of Squares df Mean Square F P(H0)
Corrected Model 3469685.635 5 693937.127 3486.249 .000
Intercept 18080105.283 1 18080105.28 90832.085 .000
Water levels 3428088.225 2 1714044.113 8611.134 .000
Cultivars 31803.829 1 31803.829 159.778 .000
Water * Cultivar 9793.581 2 4896.791 24.601 .000
Error 8360.090 42 199.050
Total 21558151.01 48
Corrected Total 3478045.725 47 a R Squared = .998 (Adjusted R Squared = .997). Table A3: 52 Analysis of variance of leaf transpiration as affected by water stress levels and sweet potato cultivars (Lole and Wanmun), at 5 months after planting.
Source Type III Sum of Squares df Mean Square F P(H0)
Corrected Model 1230576.181 5 246115.236 422.791 .000
Intercept 6535475.455 1 6535475.455 11227.015 .000
Water levels 1140705.151 2 570352.576 135.710 .000
Cultivars 78999.638 1 78999.638 979.784 .000
Water * Cultivar 10871.392 2 5435.696 9.338 .002
Error 10478.169 42 582.120
Total 7776529.806 48
Corrected Total 1241054.350 47 a R Squared = .992 (Adjusted R Squared = .989). Table A3: 53 Analysis of variance of leaf water potential as affected by water stress levels and sweet potato cultivars (Lole and Wanmun), two months after planting at early morning (6.00 am).
Source Type III Sum of Squares df Mean Square F P(H0)
Corrected Model 7.396E-03 5 1.479E-03 2.436 .096
Intercept 3.502 1 3.502 5765.961 .000
Water levels 2.406E-03 2 1.203E-03 1.981 .181
Cultivars 1.701E-03 1 1.701E-03 2.802 .120
Water * Cultivar 3.288E-03 2 1.644E-03 2.708 .107
Error 7.287E-03 12 6.073E-04
Total 3.516 18
Corrected Total 1.468E-02 17 a R Squared = .504 (Adjusted R Squared = .297).

306
Table A3: 54 Analysis of variance of leaf water potential as affected by water stress levels and sweet potato cultivars (Lole and Wanmun), two months after planting at midday (12.00-1.00 pm).
Source Type III Sum of Squares df Mean Square F P(H0)
Corrected Model .318 5 6.363E-02 22.641 .000
Intercept 18.954 1 18.954 6744.111 .000
Water levels .124 2 6.188E-02 22.019 .000
Cultivars .162 1 .162 57.734 .000
Water * Cultivar 3.214E-02 2 1.607E-02 5.718 .018
Error 3.373E-02 12 2.810E-03
Total 19.306 18
Corrected Total .352 17 a R Squared = .904 (Adjusted R Squared = .864). Table A3: 55 Analysis of variance of leaf water potential as affected by water stress levels and sweet potato cultivars (Lole and Wanmun), two months after planting at late afternoon (6.00 pm).
Source Type III Sum of Squares df Mean Square F P(H0)
Corrected Model 1.100 5 .220 205.550 .000
Intercept 7.898 1 7.898 7377.929 .000
Water levels 9.733E-02 2 4.867E-02 45.465 .000
Cultivars .972 1 .972 908.111 .000
Water * Cultivar 3.073E-02 2 1.537E-02 14.355 .001
Error 1.285E-02 12 1.070E-03
Total 9.011 18
Corrected Total 1.113 17 a R Squared = .988 (Adjusted R Squared = .984). Table A3: 56 Analysis of variance of leaf water potential as affected by water stress levels and sweet potato cultivars (Lole and Wanmun), three months after planting at early morning (06.00 am).
Source Type III Sum of Squares df Mean Square F P(H0)
Corrected Model 1.866E-02 5 3.733E-03 5.746 .006
Intercept 8.506 1 8.506 13093.542 .000
Water levels 1.139E-02 2 5.693E-03 8.764 .005
Cultivars 6.422E-03 1 6.422E-03 9.885 .008
Water * Cultivar 8.554E-04 2 4.277E-04 .658 .535
Error 7.796E-03 12 6.497E-04
Total 8.533 18
Corrected Total 2.646E-02 17 a R Squared = .705 (Adjusted R Squared = .583).

307
Table A3: 57 Analysis of variance of leaf water potential as affected by water stress levels and sweet potato cultivars (Lole and Wanmun), three months after planting at midday (12.00-01.00 pm).
Source Type III Sum of Squares df Mean Square F P(H0)
Corrected Model 7.828E-02 5 1.566E-02 20.692 .000
Intercept 26.028 1 26.028 34400.912 .000
Water levels 7.197E-02 2 3.598E-02 47.558 .000
Cultivars 3.444E-03 1 3.444E-03 4.553 .054
Water * Cultivar 2.866E-03 2 1.433E-03 1.894 .193
Error 9.079E-03 12 7.566E-04
Total 26.115 18
Corrected Total 8.736E-02 17 a R Squared = .896 (Adjusted R Squared = .853). Table A3: 58 Analysis of variance of leaf water potential as affected by water stress levels and sweet potato cultivars (Lole and Wanmun), three months after planting at late afternoon (6.00-1.00 pm).
Source Type III Sum of Squares df Mean Square F P(H0)
Corrected Model .279 5 5.572E-02 55.649 .000
Intercept 12.003 1 12.003 11988.049 .000
Water levels .101 2 5.048E-02 50.412 .000
Cultivars .163 1 .163 162.812 .000
Water * Cultivar 1.463E-02 2 7.314E-03 7.305 .008
Error 1.202E-02 12 1.001E-03
Total 12.294 18
Corrected Total .291 17 a R Squared = .959 (Adjusted R Squared = .941). Table A3: 59. Analysis of variance of leaf relative water content as affected by water stress levels and sweet potato cultivars (Lole and Wanmun), two months after planting at early morning (6.00 pm).
Source Type III Sum of Squares df Mean Square F P(H0)
Corrected Model 67.876 5 13.575 2.125 .090
Intercept 248153.423 1 248153.423 38848.499 .000
Water levels 67.020 2 33.510 5.246 .011
Cultivars .614 1 .614 .096 .759
Water * Cultivar .242 2 .121 .019 .981
Error 191.632 12 6.388
Total 248412.930 18
Corrected Total 259.508 17 a R Squared = .262 (Adjusted R Squared = .138).

308
Table A3: 60 Analysis of variance of leaf relative water content as affected by water stress levels and sweet potato cultivars (Lole and Wanmun), two months after planting at midday (12.00-01.00 pm).
Source Type III Sum of Squares df Mean Square F P(H0)
Corrected Model 1021.212 5 204.242 26.821 .000
Intercept 190066.934 1 190066.934 24959.181 .000
Water levels 972.827 2 486.414 63.875 .000
Cultivars 1.778E-02 1 1.778E-02 .002 .962
Water * Cultivar 48.367 2 24.184 3.176 .056
Error 228.453 12 7.615
Total 191316.600 18
Corrected Total 1249.666 17 a R Squared = .817 (Adjusted R Squared = .787). Table A3: 61 Analysis of variance of leaf relative water content as affected by water stress levels and sweet potato cultivars (Lole and Wanmun), two months after planting at late afternoon (6.00 pm).
Source Type III Sum of Squares df Mean Square F P(H0)
Corrected Model 51.148 5 10.230 12.242 .000
Intercept 233466.134 1 233466.134 279395.677 .000
Water levels 44.291 2 22.145 26.502 .000
Cultivars 3.423 1 3.423 4.096 .052
Water * Cultivar 3.435 2 1.718 2.055 .146
Error 25.068 12 .836
Total 233542.350 18
Corrected Total 76.216 17 a R Squared = .671 (Adjusted R Squared = .616). Table A3: 62 Analysis of variance of leaf relative water content as affected by water stress levels and sweet potato cultivars (Lole and Wanmun), three months after planting at early morning (6.00 pm).
Source Type III Sum of Squares df Mean Square F P(H0)
Corrected Model 240.548 5 48.110 6.980 .000
Intercept 230768.147 1 230768.147 33481.051 .000
Water levels 170.344 2 85.172 12.357 .000
Cultivars 62.147 1 62.147 9.017 .005
Water * Cultivar 8.057 2 4.029 .584 .564
Error 206.775 12 6.892
Total 231215.470 18
Corrected Total 447.323 17 a R Squared = .538 (Adjusted R Squared = .461).
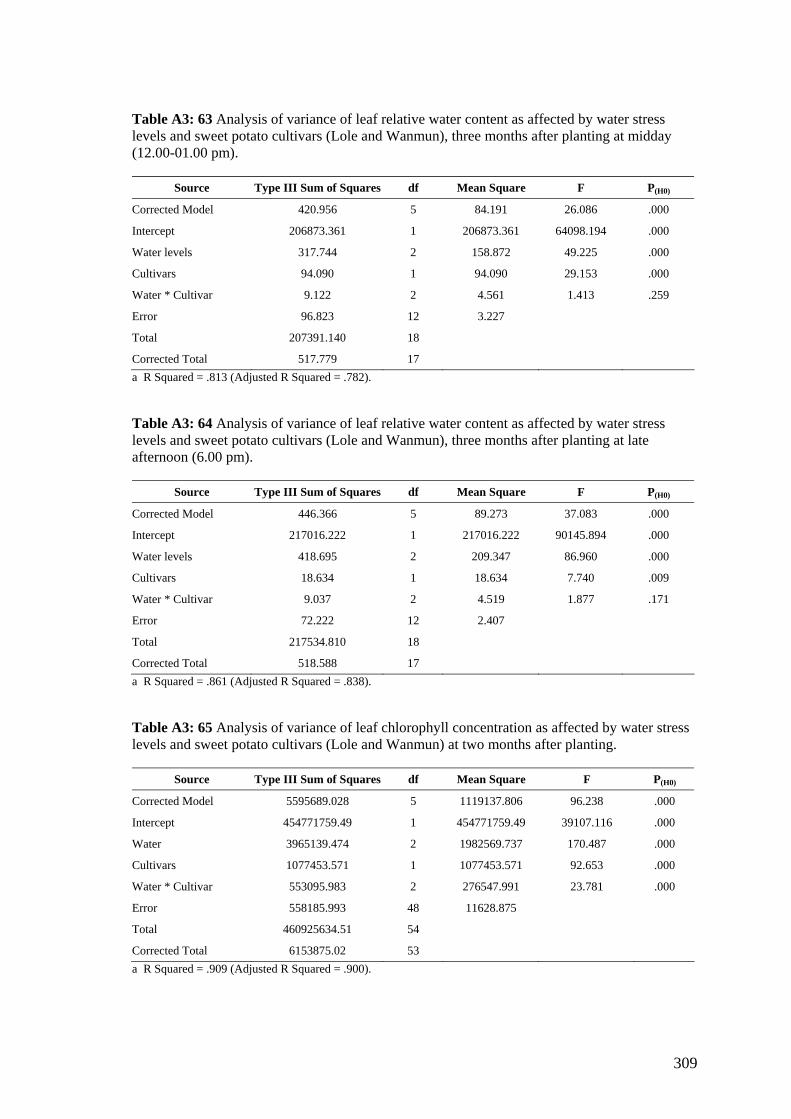
309
Table A3: 63 Analysis of variance of leaf relative water content as affected by water stress levels and sweet potato cultivars (Lole and Wanmun), three months after planting at midday (12.00-01.00 pm).
Source Type III Sum of Squares df Mean Square F P(H0)
Corrected Model 420.956 5 84.191 26.086 .000
Intercept 206873.361 1 206873.361 64098.194 .000
Water levels 317.744 2 158.872 49.225 .000
Cultivars 94.090 1 94.090 29.153 .000
Water * Cultivar 9.122 2 4.561 1.413 .259
Error 96.823 12 3.227
Total 207391.140 18
Corrected Total 517.779 17 a R Squared = .813 (Adjusted R Squared = .782). Table A3: 64 Analysis of variance of leaf relative water content as affected by water stress levels and sweet potato cultivars (Lole and Wanmun), three months after planting at late afternoon (6.00 pm).
Source Type III Sum of Squares df Mean Square F P(H0)
Corrected Model 446.366 5 89.273 37.083 .000
Intercept 217016.222 1 217016.222 90145.894 .000
Water levels 418.695 2 209.347 86.960 .000
Cultivars 18.634 1 18.634 7.740 .009
Water * Cultivar 9.037 2 4.519 1.877 .171
Error 72.222 12 2.407
Total 217534.810 18
Corrected Total 518.588 17 a R Squared = .861 (Adjusted R Squared = .838). Table A3: 65 Analysis of variance of leaf chlorophyll concentration as affected by water stress levels and sweet potato cultivars (Lole and Wanmun) at two months after planting.
Source Type III Sum of Squares df Mean Square F P(H0)
Corrected Model 5595689.028 5 1119137.806 96.238 .000
Intercept 454771759.49 1 454771759.49 39107.116 .000
Water 3965139.474 2 1982569.737 170.487 .000
Cultivars 1077453.571 1 1077453.571 92.653 .000
Water * Cultivar 553095.983 2 276547.991 23.781 .000
Error 558185.993 48 11628.875
Total 460925634.51 54
Corrected Total 6153875.02 53 a R Squared = .909 (Adjusted R Squared = .900).
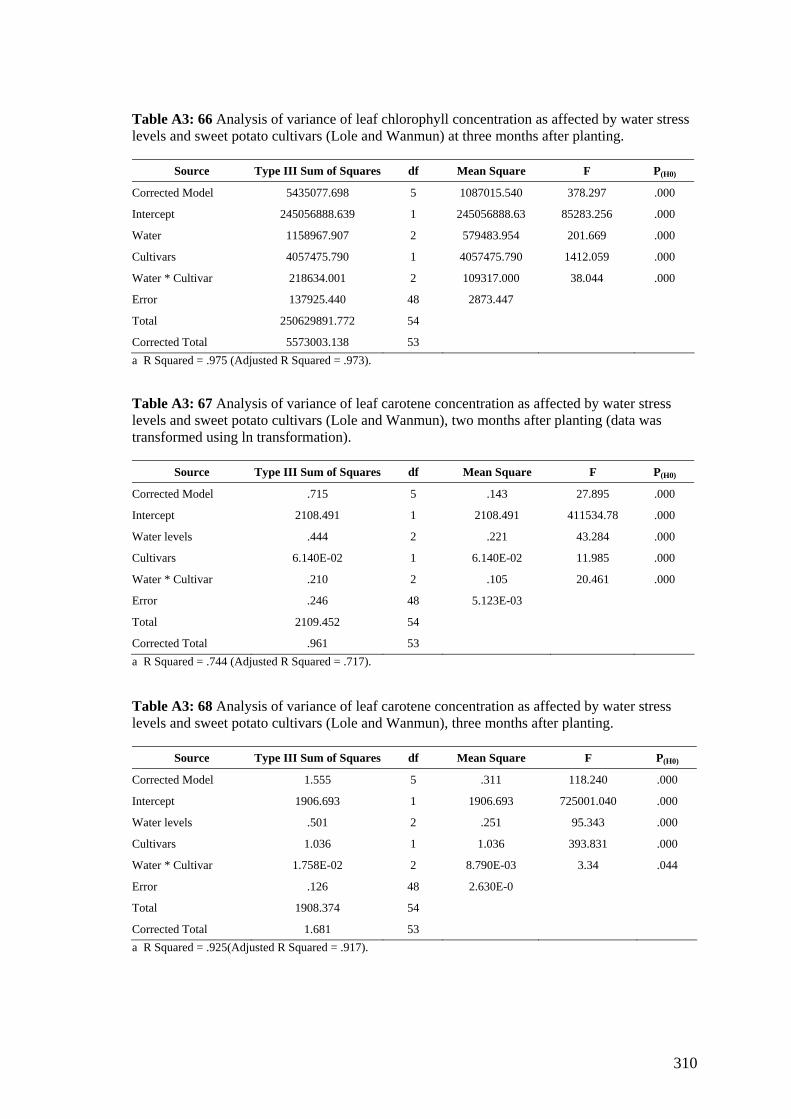
310
Table A3: 66 Analysis of variance of leaf chlorophyll concentration as affected by water stress levels and sweet potato cultivars (Lole and Wanmun) at three months after planting.
Source Type III Sum of Squares df Mean Square F P(H0)
Corrected Model 5435077.698 5 1087015.540 378.297 .000
Intercept 245056888.639 1 245056888.63 85283.256 .000
Water 1158967.907 2 579483.954 201.669 .000
Cultivars 4057475.790 1 4057475.790 1412.059 .000
Water * Cultivar 218634.001 2 109317.000 38.044 .000
Error 137925.440 48 2873.447
Total 250629891.772 54
Corrected Total 5573003.138 53 a R Squared = .975 (Adjusted R Squared = .973). Table A3: 67 Analysis of variance of leaf carotene concentration as affected by water stress levels and sweet potato cultivars (Lole and Wanmun), two months after planting (data was transformed using ln transformation).
Source Type III Sum of Squares df Mean Square F P(H0)
Corrected Model .715 5 .143 27.895 .000
Intercept 2108.491 1 2108.491 411534.78 .000
Water levels .444 2 .221 43.284 .000
Cultivars 6.140E-02 1 6.140E-02 11.985 .000
Water * Cultivar .210 2 .105 20.461 .000
Error .246 48 5.123E-03
Total 2109.452 54
Corrected Total .961 53 a R Squared = .744 (Adjusted R Squared = .717). Table A3: 68 Analysis of variance of leaf carotene concentration as affected by water stress levels and sweet potato cultivars (Lole and Wanmun), three months after planting.
Source Type III Sum of Squares df Mean Square F P(H0)
Corrected Model 1.555 5 .311 118.240 .000
Intercept 1906.693 1 1906.693 725001.040 .000
Water levels .501 2 .251 95.343 .000
Cultivars 1.036 1 1.036 393.831 .000
Water * Cultivar 1.758E-02 2 8.790E-03 3.34 .044
Error .126 48 2.630E-0
Total 1908.374 54
Corrected Total 1.681 53 a R Squared = .925(Adjusted R Squared = .917).
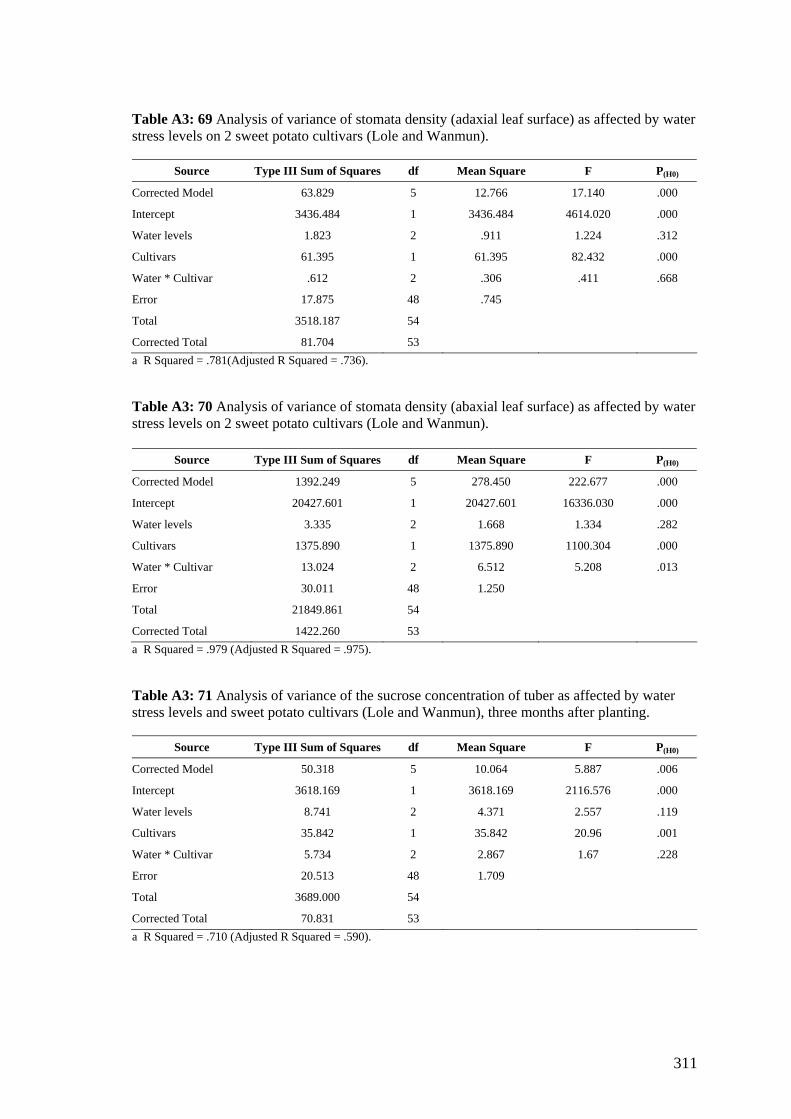
311
Table A3: 69 Analysis of variance of stomata density (adaxial leaf surface) as affected by water stress levels on 2 sweet potato cultivars (Lole and Wanmun).
Source Type III Sum of Squares df Mean Square F P(H0)
Corrected Model 63.829 5 12.766 17.140 .000
Intercept 3436.484 1 3436.484 4614.020 .000
Water levels 1.823 2 .911 1.224 .312
Cultivars 61.395 1 61.395 82.432 .000
Water * Cultivar .612 2 .306 .411 .668
Error 17.875 48 .745
Total 3518.187 54
Corrected Total 81.704 53 a R Squared = .781(Adjusted R Squared = .736). Table A3: 70 Analysis of variance of stomata density (abaxial leaf surface) as affected by water stress levels on 2 sweet potato cultivars (Lole and Wanmun).
Source Type III Sum of Squares df Mean Square F P(H0)
Corrected Model 1392.249 5 278.450 222.677 .000
Intercept 20427.601 1 20427.601 16336.030 .000
Water levels 3.335 2 1.668 1.334 .282
Cultivars 1375.890 1 1375.890 1100.304 .000
Water * Cultivar 13.024 2 6.512 5.208 .013
Error 30.011 48 1.250
Total 21849.861 54
Corrected Total 1422.260 53 a R Squared = .979 (Adjusted R Squared = .975). Table A3: 71 Analysis of variance of the sucrose concentration of tuber as affected by water stress levels and sweet potato cultivars (Lole and Wanmun), three months after planting.
Source Type III Sum of Squares df Mean Square F P(H0)
Corrected Model 50.318 5 10.064 5.887 .006
Intercept 3618.169 1 3618.169 2116.576 .000
Water levels 8.741 2 4.371 2.557 .119
Cultivars 35.842 1 35.842 20.96 .001
Water * Cultivar 5.734 2 2.867 1.67 .228
Error 20.513 48 1.709
Total 3689.000 54
Corrected Total 70.831 53 a R Squared = .710 (Adjusted R Squared = .590).

312
Table A3: 72 Analysis of variance of the sucrose concentration of tuber as affected by water stress levels and sweet potato cultivars (Lole and Wanmun), three 6 months after planting.
Source Type III Sum of Squares df Mean Square F P(H0)
Corrected Model 973.745 5 194.749 15.534 .000
Intercept 5010.005 1 5010.005 399.628 .000
Water levels 567.250 2 283.625 22.624 .000
Cultivars 374.467 1 374.467 29.870 .000
Water * Cultivar 32.028 2 16.014 1.277 .314
Error 150.440 48 12.537
Total 6134.190 54
Corrected Total 1124.185 53 a R Squared = .866 (Adjusted R Squared = .810). Table A3: 73 Analysis of variance of the starch concentration of tuber as affected by water stress levels and sweet potato cultivars (Lole and Wanmun), three 3 months after planting.
Source Type III Sum of Squares df Mean Square F P(H0)
Corrected Model 53.207 5 10.641 3.388 .039
Intercept 20563.92 1 20563.920 6546.703 .000
Water levels 13.903 2 6.952 2.213 .152
Cultivars 27.380 1 27.380 8.717 .012
Water * Cultivar 11.923 2 5.962 1.898 .192
Error 37.693 48 3.141
Total 20654.820 54
Corrected Total 90.900 53 a R Squared = .585 (Adjusted R Squared = .413). Table A3: 74 Analysis of variance of the starch concentration of tuber as affected by water stress levels and sweet potato cultivars (Lole and Wanmun), three 6 months after planting.
Source Type III Sum of Squares df Mean Square F P(H0)
Corrected Model 843.069 5 168.614 7.569 .002
Intercept 23754.734 1 23754.734 1066.404 .000
Water levels 231.848 2 115.924 5.204 .024
Cultivars 604.361 1 604.361 27.131 .000
Water * Cultivar 6.861 2 3.431 .154 .859
Error 267.307 48 22.276
Total 24865.110 54
Corrected Total 1110.376 53 a R Squared = .759 (Adjusted R Squared = .659).
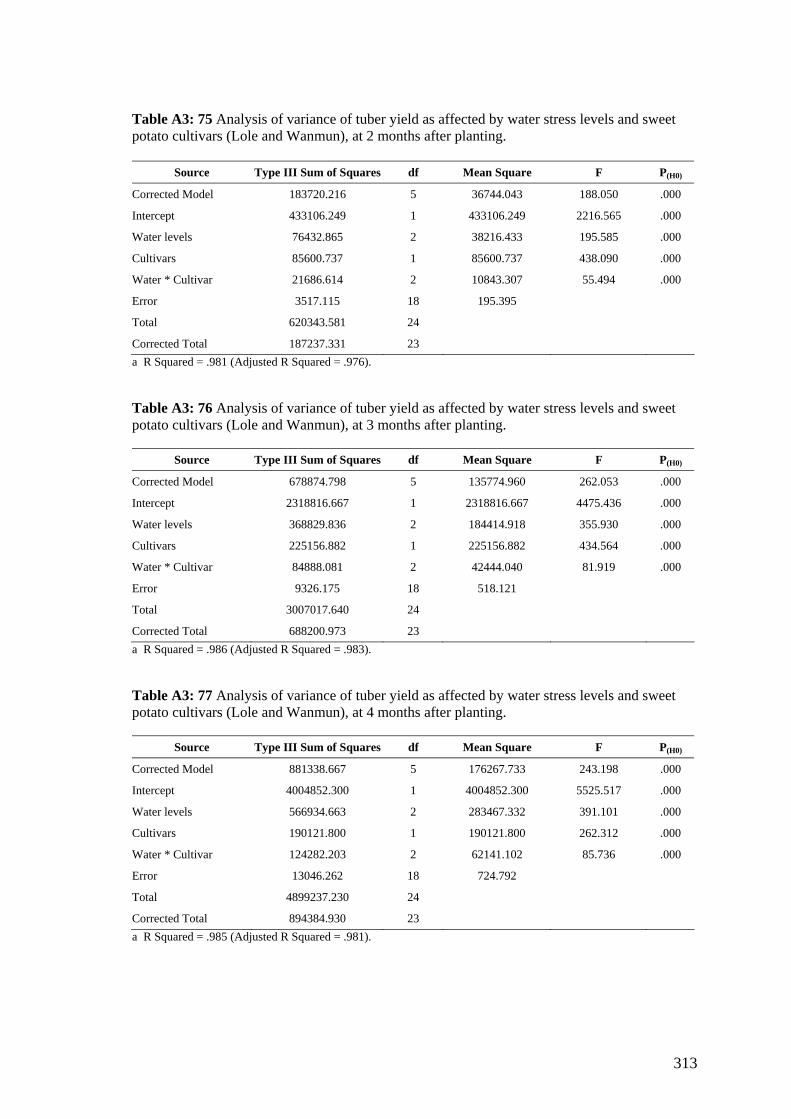
313
Table A3: 75 Analysis of variance of tuber yield as affected by water stress levels and sweet potato cultivars (Lole and Wanmun), at 2 months after planting.
Source Type III Sum of Squares df Mean Square F P(H0)
Corrected Model 183720.216 5 36744.043 188.050 .000
Intercept 433106.249 1 433106.249 2216.565 .000
Water levels 76432.865 2 38216.433 195.585 .000
Cultivars 85600.737 1 85600.737 438.090 .000
Water * Cultivar 21686.614 2 10843.307 55.494 .000
Error 3517.115 18 195.395
Total 620343.581 24
Corrected Total 187237.331 23 a R Squared = .981 (Adjusted R Squared = .976). Table A3: 76 Analysis of variance of tuber yield as affected by water stress levels and sweet potato cultivars (Lole and Wanmun), at 3 months after planting.
Source Type III Sum of Squares df Mean Square F P(H0)
Corrected Model 678874.798 5 135774.960 262.053 .000
Intercept 2318816.667 1 2318816.667 4475.436 .000
Water levels 368829.836 2 184414.918 355.930 .000
Cultivars 225156.882 1 225156.882 434.564 .000
Water * Cultivar 84888.081 2 42444.040 81.919 .000
Error 9326.175 18 518.121
Total 3007017.640 24
Corrected Total 688200.973 23 a R Squared = .986 (Adjusted R Squared = .983). Table A3: 77 Analysis of variance of tuber yield as affected by water stress levels and sweet potato cultivars (Lole and Wanmun), at 4 months after planting.
Source Type III Sum of Squares df Mean Square F P(H0)
Corrected Model 881338.667 5 176267.733 243.198 .000
Intercept 4004852.300 1 4004852.300 5525.517 .000
Water levels 566934.663 2 283467.332 391.101 .000
Cultivars 190121.800 1 190121.800 262.312 .000
Water * Cultivar 124282.203 2 62141.102 85.736 .000
Error 13046.262 18 724.792
Total 4899237.230 24
Corrected Total 894384.930 23 a R Squared = .985 (Adjusted R Squared = .981).

314
Table A3: 78 Analysis of variance of tuber yield as affected by water stress levels and sweet potato cultivars (Lole and Wanmun), at 5 months after planting.
Source Type III Sum of Squares df Mean Square F P(H0)
Corrected Model 1385346.982 5 277069.396 306.624 .000
Intercept 6186933.760 1 6186933.760 6846.896 .000
Water levels 907275.816 2 453637.908 502.028 .000
Cultivars 314897.95 1 314897.950 348.488 .000
Water * Cultivar 163173.216 2 81586.608 90.289 .000
Error 16265.008 18 903.612
Total 7588545.750 24
Corrected Total 1401611.990 23 a R Squared = .988 (Adjusted R Squared = .985). Table A3: 79 Analysis of variance of tuber yield as affected by water stress levels and sweet potato cultivars (Lole and Wanmun), at 6 months after planting (data was transformed into ln transformation).
Source Type III Sum of Squares df Mean Square F P(H0)
Corrected Model 4.551 5 .910 215.499 .000
Intercept 984.273 1 984.273 233036.32 .000
Water levels 3.729 2 1.864 441.432 .000
Cultivars .467 1 .467 110.627 .000
Water * Cultivar .355 2 .177 42.002 .000
Error 7.603E-02 18 4.224E-03
Total 988.900 24
Corrected Total 4.627 23 a R Squared = .984 (Adjusted R Squared = .979). Table A3: 80 Analysis of variance of tuber number as affected by water stress levels and sweet potato cultivars, Lole and Wanmun (data was transferred using artan transformation).
Source Type III Sum of Squares df Mean Square F P(H0)
Corrected Model .188 5 3.751E-02 14.013 .000
Intercept 42.103 1 42.103 15728.835 .000
Water levels .109 2 5.464E-02 20.411 .000
Cultivars 1.888E-02 1 1.888E-02 7.055 .016
Water * Cultivar 5.939E-02 2 2.970E-02 11.094 .001
Error 4.818E-02 18 2.677E-03
Total 42.339 24
Corrected Total .236 23 a R Squared = .796 (Adjusted R Squared = .739).

315
Table A3: 81 Means of leaf water potential of Lole and Wanmun sweet potato cultivars as affected by three soil water levels at 2 and 3 months after planting.
Leaf water potential (MPa)
2 months 3 months Cultivars Soil FC (%)
6:00 am 12:00-1.00 pm 6:00 pm 6:00 am 12:00-1.00
pm 6:00 pm
Lole 20 -0.43a -0.99c -0.50c -0.68a -1.26c -0.77c
40 -0.43a -0.92b -0.41b -0.68a -1.16b -0.72b
80 -0.43a -0.88a -0.38a -0.70b -1.14a -0.66a
Wanmun 20 -0.48a -1.26f -0.97f -0.68b -1.31c -1.03f
40 -0.46a -1.14e -0.97e -0.71b -1.21b -0.93e
80 -0.42a -0.96d -0.74d -0.72a -1.13a -0.77d Values within a column followed by the same letter symbol are not significantly different (p<0.05). All the interactions are significant (p<0.05). Table A3: 82 Means of leaf relative water content of Lole and Wanmun sweet potato cultivars as affected by three soil water levels at 2 and 3 months after planting.
Relative water content (%)
2 months 3 months Cultivars Soil FC (%)
6:00 am 12:00-1.00 pm 6:00 pm 6:00 am 12:00-1.00
pm 6:00 pm
Lole 20 81.31b 65.23c 79.61b 79.03b 74.26c 74.31c
40 83.50a 72.48b 80.11b 82.00b 77.66b 79.71b
80 84.65a 80.20a 82.78a 83.10a 80.33a 81.05a
Wanmun 20 81.03b 68.55c 79.25b 75.26e 69.96f 71.51f
40 83.45a 70.71b 80.10b 79.33d 74.15e 78.61e
80 84.20a 78.78a 81.31a 81.65c 78.45d 80.63d Values within a column followed by the same letter symbol are not significantly different (p<0.05). All the interactions are significant (p<0.05).
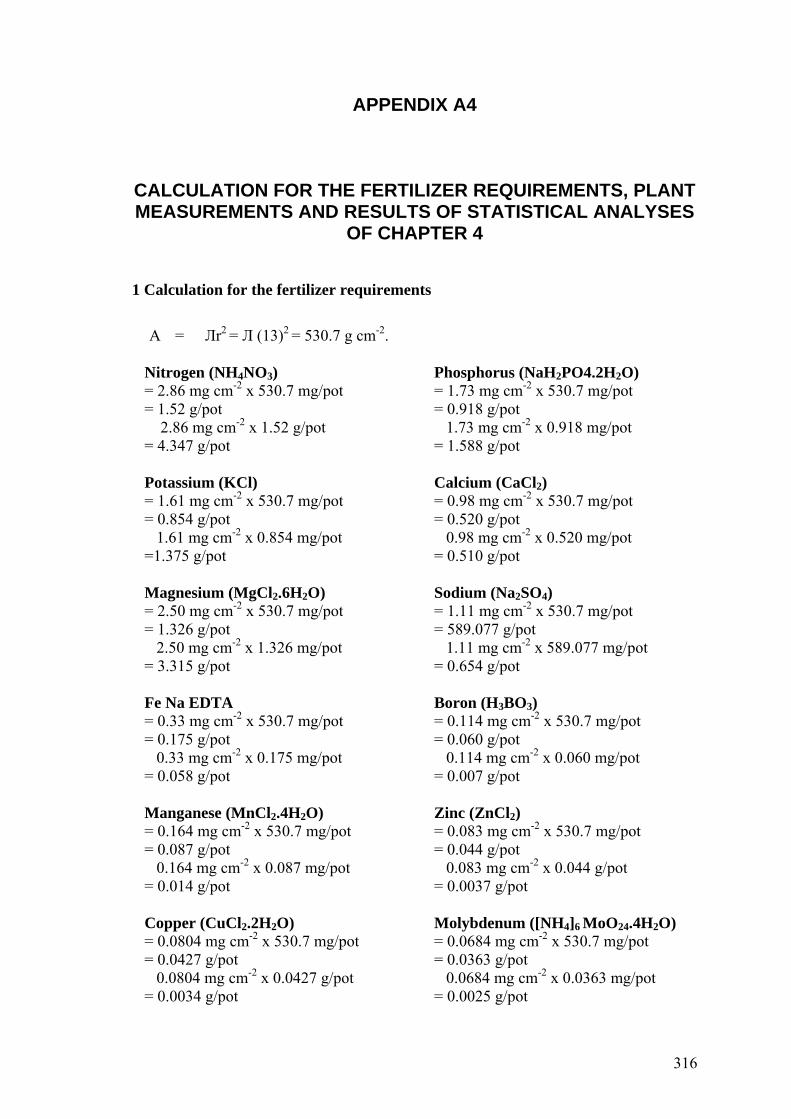
316
APPENDIX A4
CALCULATION FOR THE FERTILIZER REQUIREMENTS, PLANT MEASUREMENTS AND RESULTS OF STATISTICAL ANALYSES
OF CHAPTER 4 1 Calculation for the fertilizer requirements
A = Лr2 = Л (13)2 = 530.7 g cm-2.
Nitrogen (NH4NO3) = 2.86 mg cm-2 x 530.7 mg/pot = 1.52 g/pot 2.86 mg cm-2 x 1.52 g/pot = 4.347 g/pot
Phosphorus (NaH2PO4.2H2O) = 1.73 mg cm-2 x 530.7 mg/pot = 0.918 g/pot 1.73 mg cm-2 x 0.918 mg/pot = 1.588 g/pot
Potassium (KCl) = 1.61 mg cm-2 x 530.7 mg/pot = 0.854 g/pot 1.61 mg cm-2 x 0.854 mg/pot =1.375 g/pot
Calcium (CaCl2) = 0.98 mg cm-2 x 530.7 mg/pot = 0.520 g/pot 0.98 mg cm-2 x 0.520 mg/pot = 0.510 g/pot
Magnesium (MgCl2.6H2O) = 2.50 mg cm-2 x 530.7 mg/pot = 1.326 g/pot 2.50 mg cm-2 x 1.326 mg/pot = 3.315 g/pot
Sodium (Na2SO4) = 1.11 mg cm-2 x 530.7 mg/pot = 589.077 g/pot 1.11 mg cm-2 x 589.077 mg/pot = 0.654 g/pot
Fe Na EDTA = 0.33 mg cm-2 x 530.7 mg/pot = 0.175 g/pot 0.33 mg cm-2 x 0.175 mg/pot = 0.058 g/pot
Boron (H3BO3) = 0.114 mg cm-2 x 530.7 mg/pot = 0.060 g/pot 0.114 mg cm-2 x 0.060 mg/pot = 0.007 g/pot
Manganese (MnCl2.4H2O) = 0.164 mg cm-2 x 530.7 mg/pot = 0.087 g/pot 0.164 mg cm-2 x 0.087 mg/pot = 0.014 g/pot
Zinc (ZnCl2) = 0.083 mg cm-2 x 530.7 mg/pot = 0.044 g/pot 0.083 mg cm-2 x 0.044 g/pot = 0.0037 g/pot
Copper (CuCl2.2H2O) = 0.0804 mg cm-2 x 530.7 mg/pot = 0.0427 g/pot 0.0804 mg cm-2 x 0.0427 g/pot = 0.0034 g/pot
Molybdenum ([NH4]6 MoO24.4H2O) = 0.0684 mg cm-2 x 530.7 mg/pot = 0.0363 g/pot 0.0684 mg cm-2 x 0.0363 mg/pot = 0.0025 g/pot

317
Figure A4.1 Effects of nitrogen (20, 100, and 200 kg of N / ha) and potassium (16, 80, and 160 kg of K / ha) applications on the average daily transpiration of Lole and Wanmun cultivars grown under 30% and 80% of the soil field capacity, between 1and 5 months after planting.
Lole cultivar 1 month after planting
0
100
200
300
400
500
20 100 200Nitrogen (kg/ha)
Tran
spira
tion
(ml/p
lant
/day
)
30%
80%
Wanmun cultivar 1 month after planting
0
100
200
300
400
500
20 100 200Nitrogen (kg/ha)
Tran
spira
tion
(ml/p
lant
/day
)
30%
80%
Lole cultivar1 month after planting
0
100
200
300
400
500
16 80 160Potassium (kg/ha)
Tran
spira
tion
(ml/p
lant
/day
)
30%
80%
Wanmun cultivar 1 month after planting
0
100
200
300
400
500
16 80 160Potassium (kg/ha)
Tran
spira
tion
(ml/p
lant
/day
)
30%
80%

318
Figure A4.1 (continued)
Lole cultivar 2 months after planting
0
100
200
300
400
500
20 100 200Nitrogen (kg/ha)
Tran
spira
tion
(ml/p
lant
/day
)
30%
80%
Wanmun 2 months after planting
0
100
200
300
400
500
20 100 200Nitrogen (kg/ha)
Tran
spira
tion
(ml/p
lant
/day
)
30%
80%
Lole cultivar 2 months after planting
0
100
200
300
400
500
16 80 160Potassium (kg/ha)
Tran
spira
tion
(ml/p
lant
/day
)
30%
80%
Wanmun cultivar 2 months after planting
0
100
200
300
400
500
16 80 160Potassium (kg/ha)
Tran
spira
tion
(ml/p
lant
/day
)
30%
80%
Lole cultivar 3 months after planting
0
100
200
300
400
500
600
700
20 100 200Nitrogen (kg/ha)
Tran
spira
tion
(ml/p
lant
/day
)
30%
80%
Wanmun cultivar 3 months after planting
0
100
200
300
400
500
600
700
20 100 200Nitrogen (kg/ha)
Tran
spira
tion
(ml/p
lant
/day
)
30%
80%
Lole cultivar 3 months after planting
0
100
200
300
400
500
600
700
16 80 160Potassium (kg/ha)
Tran
spira
tion
(ml/p
lant
/day
)
30%
80%
Wanmun cultivar 3 months after planting
0
100
200
300
400
500
600
700
16 80 160Potassium (kg/ha)
Tran
spira
tion
(ml/p
lant
/day
)
30%
80%

319
Figure A4.1 (continued) Lole cultivar 4 months after planting
0
100
200
300
400
500
600
700
20 100 200Nitrogen (kg/ha)
Tran
pira
tion
(ml/p
lant
/day
)
30%
80%
Wanmun cultivar 4 months after planting
0
100
200
300
400
500
600
700
20 100 200Nitrogen (kg/ha)
Tran
spira
tion
(ml/p
lant
/day
)
30%
80%
Lole cultivar 4 months after planting
0
100
200
300
400
500
600
700
16 80 160Potassium (kg/ha)
Tran
spira
tion
(ml/p
lant
/day
)
30%
80%
Wanmun cultivar 4 months after planting
0
100
200
300
400
500
600
700
16 80Potassium (kg/ha)
Tran
spira
tion
(ml/p
lant
/day
)
30%
80%
Lole cultivar 5 months after planting
0
100
200
300
400
500
600
700
16 80 160Potassium (kg/ha)
Tran
spira
tion
(ml/p
lant
/day
)
30%
80%
Wanmun cultivar 5 months after planting
0
100
200
300
400
500
600
700
16 80 160Potassium (kg/ha)
Tran
spira
tion
(ml/p
lant
/day
)
30%
80%
Lole cultivar 5 months after planting
0
100
200
300
400
500
600
700
20 100 200
Nitrogen (kg/ha)
Tran
spira
tion
(ml/p
lant
/day
)
30%
80%
Wunmun cultivar 5 months after planting
0
100
200
300
400
500
600
700
20 100 200
Nitrogen (kg/ha)
Tran
spira
tion
(ml/p
lant
/day
)
30%
80%
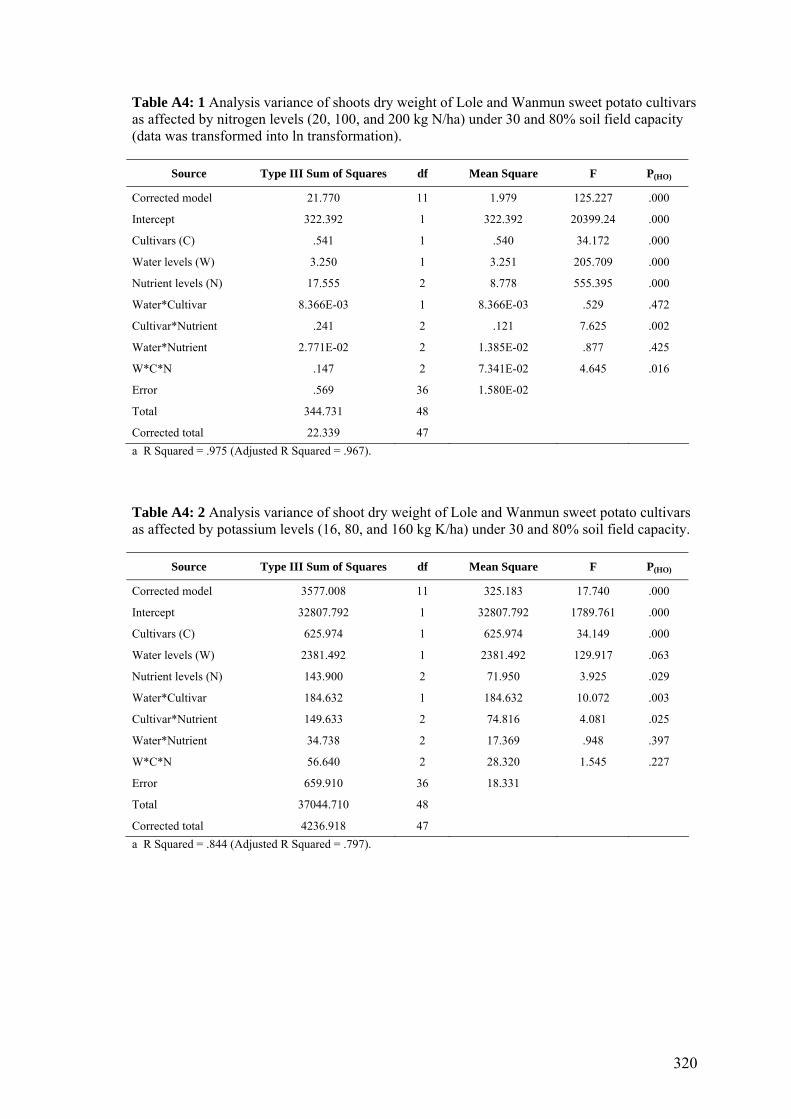
320
Table A4: 1 Analysis variance of shoots dry weight of Lole and Wanmun sweet potato cultivars as affected by nitrogen levels (20, 100, and 200 kg N/ha) under 30 and 80% soil field capacity (data was transformed into ln transformation).
Source Type III Sum of Squares df Mean Square F P(HO)
Corrected model 21.770 11 1.979 125.227 .000
Intercept 322.392 1 322.392 20399.24 .000
Cultivars (C) .541 1 .540 34.172 .000
Water levels (W) 3.250 1 3.251 205.709 .000
Nutrient levels (N) 17.555 2 8.778 555.395 .000
Water*Cultivar 8.366E-03 1 8.366E-03 .529 .472
Cultivar*Nutrient .241 2 .121 7.625 .002
Water*Nutrient 2.771E-02 2 1.385E-02 .877 .425
W*C*N .147 2 7.341E-02 4.645 .016
Error .569 36 1.580E-02
Total 344.731 48
Corrected total 22.339 47 a R Squared = .975 (Adjusted R Squared = .967). Table A4: 2 Analysis variance of shoot dry weight of Lole and Wanmun sweet potato cultivars as affected by potassium levels (16, 80, and 160 kg K/ha) under 30 and 80% soil field capacity.
Source Type III Sum of Squares df Mean Square F P(HO)
Corrected model 3577.008 11 325.183 17.740 .000
Intercept 32807.792 1 32807.792 1789.761 .000
Cultivars (C) 625.974 1 625.974 34.149 .000
Water levels (W) 2381.492 1 2381.492 129.917 .063
Nutrient levels (N) 143.900 2 71.950 3.925 .029
Water*Cultivar 184.632 1 184.632 10.072 .003
Cultivar*Nutrient 149.633 2 74.816 4.081 .025
Water*Nutrient 34.738 2 17.369 .948 .397
W*C*N 56.640 2 28.320 1.545 .227
Error 659.910 36 18.331
Total 37044.710 48
Corrected total 4236.918 47 a R Squared = .844 (Adjusted R Squared = .797).

321
Table A4: 3 Analysis variance of leaf dry mass of Lole and Wanmun sweet potato cultivars as affected by nitrogen levels (20, 100, and 200 kg N/ha) under 30 and 80% soil field capacity.
Source Type III Sum of Squares df Mean Square F P(HO)
Corrected model 920.668 11 83.697 65.668 .000
Intercept 2108.340 1 2108.340 1654.191 .000
Cultivars (C) 9.684 1 9.684 7.598 .009
Water levels (W) 156.313 1 156.313 122.642 .000
Nutrient levels (N) 658.626 2 329.313 258.377 .000
Water*Cultivar 1.880 1 1.880 1.475 .232
Cultivar*Nutrient 29.456 2 14.728 11.555 .000
Water*Nutrient 47.954 2 23.977 18.812 .000
W*C*N 16.756 2 8.378 6.573 .004
Error 45.884 36 1.275
Total 3074.892 48
Corrected total 966.552 47 a R Squared = .953 (Adjusted R Squared = .938). Table A4: 4 Analysis variance of leaf dry mass of Lole and Wanmun sweet potato cultivars as affected by potassium levels (16, 80, and 160 kg K/ha) under 30 and 80% soil field capacity.
Source Type III Sum of Squares df Mean Square F P(HO)
Corrected model 366.164 11 33.288 20.185 .000
Intercept 4968.046 1 4968.046 3012.566 .000
Cultivars (C) 40.719 1 40.719 24.692 .000
Water levels (W) 286.310 1 286.310 173.615 .000
Nutrient levels (N) 9.462 2 4.731 2.869 .070
Water*Cultivar 8.259 1 8.259 5.008 .032
Cultivar*Nutrient 13.300 2 6.650 4.033 .026
Water*Nutrient 7.298 2 3.649 2.213 .124
W*C*N .816 2 .408 .247 .782
Error 59.368 36 1.649
Total 5393.577 48
Corrected total 425.532 47 a R Squared = .860 (Adjusted R Squared = .818).

322
Table A4: 5 Analysis variance of leaf area of Lole and Wanmun sweet potato cultivars as affected by nitrogen levels (20, 100, and 200 kg N/ha) under 30 and 80% soil field capacity.
Source Type III Sum of Squares df Mean Square F P(HO)
Corrected model 26539268.89 11 2412660.809 303.764 .000
Intercept 59023331.58 1 59023331.59 7431.278 .000
Cultivars (C) 1048085.324 1 1048085.324 131.958 .000
Water levels (W) 3074122.272 1 3074122.272 387.045 .000
Nutrient levels (N) 20526076.69 2 10263038.35 1292.158 .000
Water*Cultivar 8935.292 1 8935.292 1.125 .296
Cultivar*Nutrient 552858.035 2 276429.017 34.804 .002
Water*Nutrient 992533.883 2 496266.942 62.482 .425
W*C*N 336657.394 2 168328.697 21.193 .016
Error 285931.950 36 7942.554
Total 85848532.43 48
Corrected total 26825200.85 47 a R Squared = .989 (Adjusted R Squared = .986). Table A4: 6 Analysis variance of leaf area of Lole and Wanmun sweet potato cultivars as affected by potassium levels (16, 80, and 160 kg K/ha) under 30 and 80% soil field capacity.
Source Type III Sum of Squares df Mean Square F P(HO)
Corrected model 13088653.52 11 1189877.593 35.027 .000
Intercept 191774266.38 1 191774266.38 5645.334 .000
Cultivars (C) 5539820.836 1 5539820.836 163.078 .000
Water levels (W) 6242627.914 1 6242627.914 183.767 .063
Nutrient levels (N) 598790.386 2 299395.193 8.813 .001
Water*Cultivar 146953.160 1 146953.160 4.326 .045
Cultivar*Nutrient 143093.657 2 71546.828 2.106 .136
Water*Nutrient 73516.236 2 36758.118 1.082 .350
W*C*N 343851.331 2 171925.666 5.061 .012
Error 1222934.501 36 33970.403
Total 206085854.40 48
Corrected total 14311588.02 47 a R Squared = .915 (Adjusted R Squared = .888).

323
Table A4: 7 Analysis variance of specific leaf weight (mass) of Lole and Wanmun sweet potato cultivars as affected by nitrogen levels (20, 100, and 200 kg N/ha) under 30 and 80% soil FC (data was transformed into ln transformation).
Source Type III Sum of Squares df Mean Square F P(HO)
Corrected model .684 11 6.216E-02 1.671 .121
Intercept 155.535 1 155.535 4180.157 .000
Cultivars (C) .365 1 .365 9.815 .003
Water levels (W) 6.389E-02 1 6.389E-02 1.717 .198
Nutrient levels (N) .103 2 5.133E-02 1.380 .265
Water*Cultivar 2.991E-04 1 2.991E-04 .008 .929
Cultivar*Nutrient .139 2 6.932E-02 1.863 .170
Water*Nutrient 1.221E-02 2 6.104E-03 .164 .849
W*C*N 8.565E-04 2 4.283E-04 .012 .989
Error 1.339 36 3.721E-02
Total 157.558 48
Corrected total 2.023 47 a R Squared = .338 (Adjusted R Squared = .136). Table A4: 8 Analysis variance of specific leaf weight (mass) of Lole and Wanmun sweet potato cultivars as affected by potassium levels (16, 80, and 160 kg K/ha) under 30 and 80% soil field capacity (data was transformed into ln transformation).
Source Type III Sum of Squares df Mean Square F P(HO)
Corrected model 1.150 11 .105 4.266 .000
Intercept 126.407 1 126.407 5160.173 .000
Cultivars (C) .354 1 .354 14.466 .001
Water levels (W) .157 1 .157 6.424 .016
Nutrient levels (N) .387 2 .194 7.899 .001
Water*Cultivar 2.560E-02 1 2.560E-02 1.045 .313
Cultivar*Nutrient .146 2 7.284E-02 2.974 .064
Water*Nutrient 2.213E-03 2 1.106E-03 .045 .956
W*C*N 7.740E-02 2 3.870E-02 1.580 .220
Error .882 36 2.450E-02
Total 128.439 48
Corrected total 2.039 47 a R Squared = .566 (Adjusted R Squared = .433).

324
Table A4: 9 Analysis variance of root dry mass of Lole and Wanmun sweet potato cultivars as affected by nitrogen levels (20, 100, and 200 kg N/ha) under 30 and 80% soil field capacity (data was transformed into ln transformation).
Source Type III Sum of Squares df Mean Square F P(HO)
Corrected model 14.359 11 1.305 18.498 .002
Intercept 86.365 1 86.365 1223.855 .000
Cultivars (C) 5.858 1 5.858 83.019 .001
Water levels (W) 2.545 1 2.545 36.070 .029
Nutrient levels (N) 5.050 2 2.525 35.783 .001
Water*Cultivar .207 1 .207 2.936 .095
Cultivar*Nutrient .163 2 8.132E-02 1.156 .327
Water*Nutrient .218 2 .109 1.544 .227
W*C*N .317 2 .158 2.246 .120
Error 2.540 36 7.057E-02
Total 103.264 48
Corrected total 16.899 47 a R Squared = .850 (Adjusted R Squared = .804). Table A4: 10 Analysis variance of root dry mass of Lole and Wanmun sweet potato cultivars as affected by potassium levels (16, 80, and 160 kg K/ha) under 30 and 80% soil field capacity.
Source Type III Sum of Squares df Mean Square F P(HO)
Corrected model 670.346 11 60.941 9.982 .000
Intercept 2069.840 1 2069.840 339.027 .000
Cultivars (C) 428.443 1 428.443 70.176 .000
Water levels (W) 150.982 1 150.982 24.730 .000
Nutrient levels (N) 1.369 2 .685 .112 .894
Water*Cultivar 49.829 1 49.829 8.162 .007
Cultivar*Nutrient 3.531 2 1.766 .289 .751
Water*Nutrient 19.167 2 9.583 1.570 .222
W*C*N 17.025 2 8.513 1.394 .261
Error 219.789 36 6.105
Total 2959.975 48
Corrected total 890.135 47 a R Squared = .753 (Adjusted R Squared = .678).

325
Table A4: 11 Analysis variance of tuber yields of Lole and Wanmun sweet potato cultivars as affected by nitrogen levels (20, 100, and 200 kg N/ha) under 30 and 80% soil field capacity (data was transformed into ln transformation).
Source Type III Sum of Squares df Mean Square F P(HO)
Corrected model 3054032.229 11 277639.294 700.827 .000
Intercept 8635185.021 1 8635185.021 21797.231 .000
Cultivars (C) 38476.688 1 38476.688 97.124 .000
Water levels (W) 678538.521 1 678538.521 1712.790 .000
Nutrient levels (N) 2046415.792 2 1023207.896 2582.817 .000
Water*Cultivar 59572.521 1 59572.521 150.375 .000
Cultivar*Nutrient 15767.375 2 7883.687 19.900 .000
Water*Nutrient 190215.042 2 95107.521 240.074 .000
W*C*N 25046.292 2 12523.146 31.611 .000
Error 14261.750 36 396.160
Total 11703479.00 48
Corrected total 3068293.979 47 a R Squared = .995 (Adjusted R Squared = .994). Table A4: 12 Analysis variance of tuber yields of Lole and Wanmun sweet potato cultivars as affected by potassium levels (16, 80, and 160 kg K/ha) under 30 and 80% soil field capacity.
Source Type III Sum of Squares df Mean Square F P(HO)
Corrected model 1088852.729 11 98986.612 133.742 .000
Intercept 11031377.52 1 11031377.52 14904.609 .000
Cultivars (C) 4700.521 1 4700.521 6.351 .016
Water levels (W) 735817.688 1 735817.688 994.171 .000
Nutrient levels (N) 229836.542 2 114918.271 155.267 .000
Water*Cultivar 2310.187 1 2310.187 3.121 .086
Cultivar*Nutrient 33701.542 2 16850.771 22.767 .000
Water*Nutrient 51476.375 2 25738.187 34.775 .000
W*C*N 31009.875 2 15504.938 20.949 .000
Error 26644.750 36 740.132
Total 12146875.00 48
Corrected total 1115497.479 47 a R Squared = .976 (Adjusted R Squared = .969).

326
Table A4: 13 Analysis variance of total chlorophyll of Lole and Wanmun sweet potato cultivars as affected by nitrogen levels (20, 100, and 200 kg N/ha) under 30 and 80% soil field capacity.
Source Type III Sum of Squares df Mean Square F P(HO)
Corrected model 25585915.04 11 2325992.277 598.221 .000
Intercept 115312892.88 1 115312892.88 29657.292 .000
Cultivars (C) 334262.340 1 334262.340 85.969 .000
Water levels (W) 2475242.324 1 2475242.324 636.607 .000
Nutrient levels (N) 22398465.364 2 11199232.68 2880.328 .000
Water*Cultivar 16588.971 1 16588.971 4.267 .000
Cultivar*Nutrient 3572.287 2 1786.143 .459 .000
Water*Nutrient 338704.579 2 169352.289 43.556 .000
W*C*N 19079.187 2 9539.594 2.453 .000
Error 139974.483 36 3888.180
Total 141038782.412 48
Corrected total 25725889.53 47 a R Squared = .995 (Adjusted R Squared = .993). Table A4: 14 Analysis variance of total chlorophyll of Lole and Wanmun sweet potato cultivars as affected by potassium levels (16, 80, and 160 kg K/ha) under 30 and 80% soil field capacity.
Source Type III Sum of Squares df Mean Square F P(HO)
Corrected model 7311260.568 11 664660.052 454.968 .000
Intercept 242531092.472 1 242531092.47 166015.6 .000
Cultivars (C) 142603.268 1 142603.268 97.614 .009
Water levels (W) 5638943.690 1 5638943.690 3859.928 .000
Nutrient levels (N) 1473601.046 2 736800.523 504.349 .000
Water*Cultivar 3251.033 1 3251.033 2.225 .086
Cultivar*Nutrient 21127.506 2 10563.753 7.231 .006
Water*Nutrient 15913.035 2 7956.518 5.446 .000
W*C*N 15820.989 2 7910.495 5.415 .000
Error 52592.171 36 1460.894
Total 249894945.21 48
Corrected total 7363852.739 47 a R Squared = .993 (Adjusted R Squared = .991).

327
Table A4: 15 Analysis variance of carotene concentration of Lole and Wanmun sweet potato cultivars as affected by nitrogen levels (20, 100, and 200 kg N/ha) under 30 and 80% soil field capacity.
Source Type III Sum of Squares df Mean Square F P(HO)
Corrected model 1053838.634 11 95803.512 714.159 .000
Intercept 5556060.100 1 5556060.100 41417.16 .000
Cultivars (C) 10281.055 1 10281.055 76.639 .000
Water levels (W) 94955.550 1 94955.550 707.838 .000
Nutrient levels (N) 929223.635 2 464611.817 3463.408 .000
Water*Cultivar 1730.120 1 1730.120 12.897 .001
Cultivar*Nutrient 1358.492 2 679.246 5.063 .012
Water*Nutrient 15662.345 2 7831.172 58.377 .000
W*C*N 627.437 2 313.719 2.339 .111
Error 4829.355 36 134.149
Total 6614728.088 48
Corrected total 1058667.98 47 a R Squared = .995 (Adjusted R Squared = .994). Table A4: 16 Analysis variance of carotene concentration of Lole and Wanmun sweet potato cultivars as affected by potassium levels (16, 80, and 160 kg K/ha) under 30 and 80% soil field capacity.
Source Type III Sum of Squares df Mean Square F P(HO)
Corrected model 291452.324 11 26495.666 300.004 .000
Intercept 11005703.76 1 11005703.76 124614.9 .000
Cultivars (C) 6012.087 1 6012.087 68.073 .009
Water levels (W) 211650.331 1 211650.331 2396.465 .000
Nutrient levels (N) 70132.808 2 35066.404 397.048 .000
Water*Cultivar 28.979 1 28.979 .328 .570
Cultivar*Nutrient 1340.860 2 670.430 7.591 .002
Water*Nutrient 1290.826 2 645.413 7.308 .002
W*C*N 996.434 2 498.217 5.641 .007
Error 3179.437 36 88.318
Total 11300335.52 48
Corrected total 294631.762 47 a R Squared = .998 (Adjusted R Squared = .986)

328
Table A4: 17 Analysis variance of chlorophyll a/b ratio of Lole and Wanmun sweet potato cultivars as affected by nitrogen levels (20, 100, and 200 kg N/ha) under 30 and 80% soil field capacity.
Source Type III Sum of Squares df Mean Square F P(HO)
Corrected model .206 11 1.869E-02 1.204 .319
Intercept 1029.940 1 1029.940 66338.38 .000
Cultivars (C) 5.145E-04 1 5.145E-04 .033 .857
Water levels (W) 4.852E-02 1 4.852E-02 3.125 .086
Nutrient levels (N) 3.540E-02 2 1.770E-02 1.140 .331
Water*Cultivar 5.593E-03 1 5.593E-03 .360 .552
Cultivar*Nutrient 1.043E-03 2 5.215E-04 .034 .967
Water*Nutrient .112 2 5.578E-02 3.593 .038
W*C*N 3.007E-02 2 1.504E-03 .097 .908
Error .559 36 1.553E-02
Total 1030.704 48
Corrected total .765 47 a R Squared = .269 (Adjusted R Squared = .046). Table A4: 18 Analysis variance of chlorophyll a/b ratio of Lole and Wanmun sweet potato cultivars as affected by potassium levels (16, 80, and 160 kg K/ha) under 30 and 80% soil field capacity.
Source Type III Sum of Squares df Mean Square F P(HO)
Corrected model .133 11 1.207E-02 4.754 .000
Intercept 1014.854 1 1014.854 399846.4 .000
Cultivars (C) 8.417E-04 1 8.417E-04 .332 .568
Water levels (W) .122 1 .122 47.952 .000
Nutrient levels (N) 3.185E-04 2 1.593E-04 .063 .939
Water*Cultivar 2.624E-03 1 2.624E-03 1.034 .316
Cultivar*Nutrient 3.002E-04 2 1.501E-04 .059 .943
Water*Nutrient 4.779E-03 2 2.390E-03 .941 .399
W*C*N 2.152E-03 2 1.076E-03 .421 .658
Error 9.137E-02 36 2.538E-03
Total 1015.078 48
Corrected total .224 47 a R Squared = .592 (Adjusted R Squared = .648).
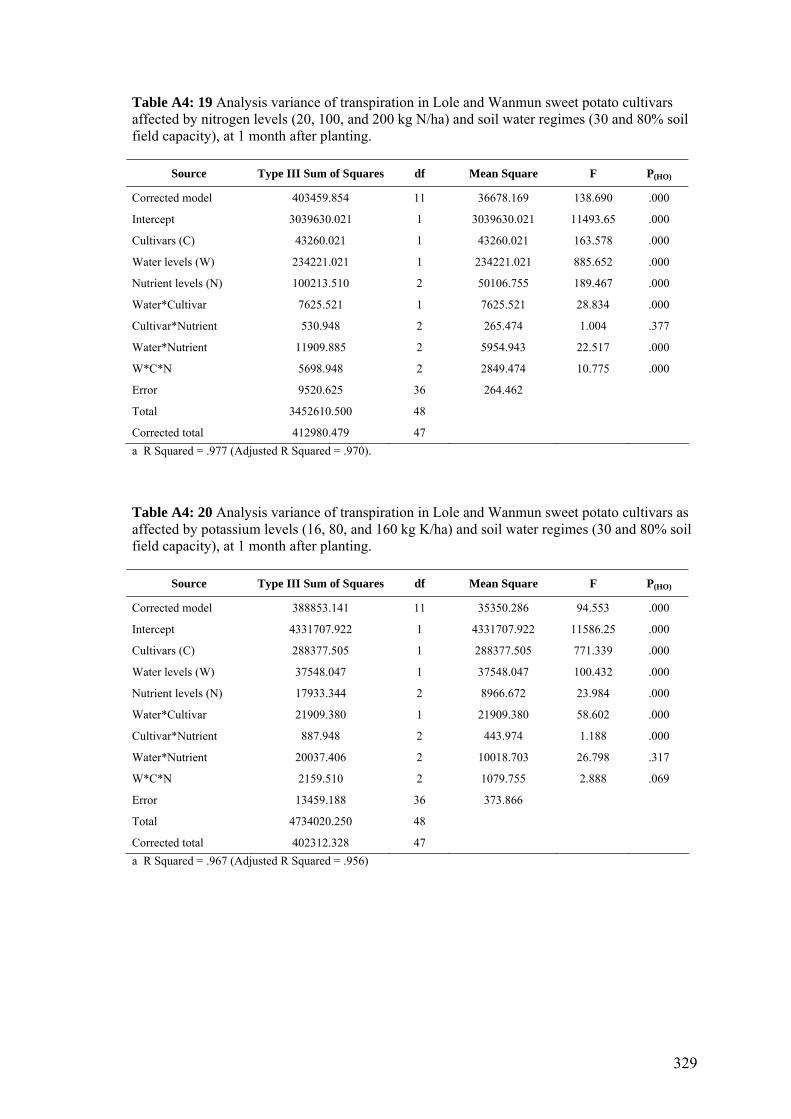
329
Table A4: 19 Analysis variance of transpiration in Lole and Wanmun sweet potato cultivars affected by nitrogen levels (20, 100, and 200 kg N/ha) and soil water regimes (30 and 80% soil field capacity), at 1 month after planting.
Source Type III Sum of Squares df Mean Square F P(HO)
Corrected model 403459.854 11 36678.169 138.690 .000
Intercept 3039630.021 1 3039630.021 11493.65 .000
Cultivars (C) 43260.021 1 43260.021 163.578 .000
Water levels (W) 234221.021 1 234221.021 885.652 .000
Nutrient levels (N) 100213.510 2 50106.755 189.467 .000
Water*Cultivar 7625.521 1 7625.521 28.834 .000
Cultivar*Nutrient 530.948 2 265.474 1.004 .377
Water*Nutrient 11909.885 2 5954.943 22.517 .000
W*C*N 5698.948 2 2849.474 10.775 .000
Error 9520.625 36 264.462
Total 3452610.500 48
Corrected total 412980.479 47 a R Squared = .977 (Adjusted R Squared = .970). Table A4: 20 Analysis variance of transpiration in Lole and Wanmun sweet potato cultivars as affected by potassium levels (16, 80, and 160 kg K/ha) and soil water regimes (30 and 80% soil field capacity), at 1 month after planting.
Source Type III Sum of Squares df Mean Square F P(HO)
Corrected model 388853.141 11 35350.286 94.553 .000
Intercept 4331707.922 1 4331707.922 11586.25 .000
Cultivars (C) 288377.505 1 288377.505 771.339 .000
Water levels (W) 37548.047 1 37548.047 100.432 .000
Nutrient levels (N) 17933.344 2 8966.672 23.984 .000
Water*Cultivar 21909.380 1 21909.380 58.602 .000
Cultivar*Nutrient 887.948 2 443.974 1.188 .000
Water*Nutrient 20037.406 2 10018.703 26.798 .317
W*C*N 2159.510 2 1079.755 2.888 .069
Error 13459.188 36 373.866
Total 4734020.250 48
Corrected total 402312.328 47 a R Squared = .967 (Adjusted R Squared = .956)
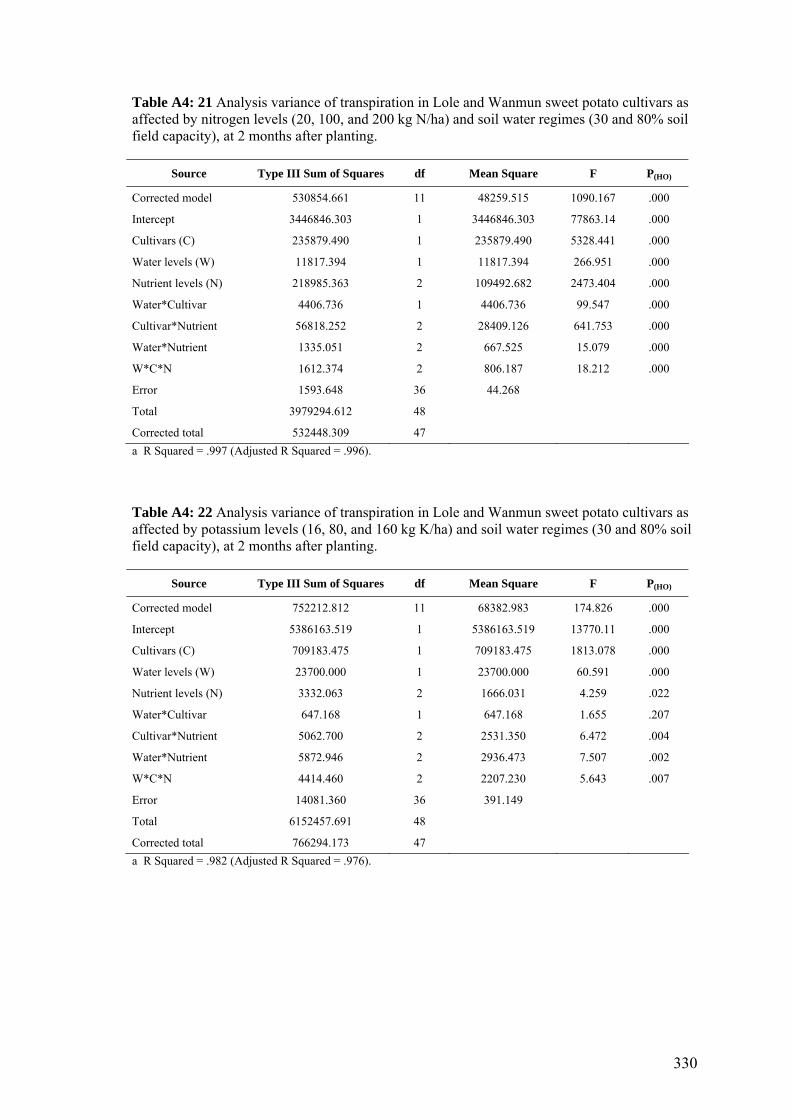
330
Table A4: 21 Analysis variance of transpiration in Lole and Wanmun sweet potato cultivars as affected by nitrogen levels (20, 100, and 200 kg N/ha) and soil water regimes (30 and 80% soil field capacity), at 2 months after planting.
Source Type III Sum of Squares df Mean Square F P(HO)
Corrected model 530854.661 11 48259.515 1090.167 .000
Intercept 3446846.303 1 3446846.303 77863.14 .000
Cultivars (C) 235879.490 1 235879.490 5328.441 .000
Water levels (W) 11817.394 1 11817.394 266.951 .000
Nutrient levels (N) 218985.363 2 109492.682 2473.404 .000
Water*Cultivar 4406.736 1 4406.736 99.547 .000
Cultivar*Nutrient 56818.252 2 28409.126 641.753 .000
Water*Nutrient 1335.051 2 667.525 15.079 .000
W*C*N 1612.374 2 806.187 18.212 .000
Error 1593.648 36 44.268
Total 3979294.612 48
Corrected total 532448.309 47 a R Squared = .997 (Adjusted R Squared = .996). Table A4: 22 Analysis variance of transpiration in Lole and Wanmun sweet potato cultivars as affected by potassium levels (16, 80, and 160 kg K/ha) and soil water regimes (30 and 80% soil field capacity), at 2 months after planting.
Source Type III Sum of Squares df Mean Square F P(HO)
Corrected model 752212.812 11 68382.983 174.826 .000
Intercept 5386163.519 1 5386163.519 13770.11 .000
Cultivars (C) 709183.475 1 709183.475 1813.078 .000
Water levels (W) 23700.000 1 23700.000 60.591 .000
Nutrient levels (N) 3332.063 2 1666.031 4.259 .022
Water*Cultivar 647.168 1 647.168 1.655 .207
Cultivar*Nutrient 5062.700 2 2531.350 6.472 .004
Water*Nutrient 5872.946 2 2936.473 7.507 .002
W*C*N 4414.460 2 2207.230 5.643 .007
Error 14081.360 36 391.149
Total 6152457.691 48
Corrected total 766294.173 47 a R Squared = .982 (Adjusted R Squared = .976).

331
Table A4: 23 Analysis variance of transpiration in Lole and Wanmun sweet potato cultivars as affected by nitrogen levels (20, 100, and 200 kg N/ha) and soil water regimes (30 and 80% soil field capacity), at 3 months after planting.
Source Type III Sum of Squares df Mean Square F P(HO)
Corrected model 861679.788 11 78334.526 297.627 .000
Intercept 5895218.926 1 5895218.926 22398.47 .000
Cultivars (C) 398713.306 1 398713.306 1514.883 .000
Water levels (W) 25195.835 1 25195.835 95.730 .000
Nutrient levels (N) 350096.645 2 175048.323 665.084 .000
Water*Cultivar 10102.548 1 10102.548 38.384 .000
Cultivar*Nutrient 76490.064 2 38245.032 145.309 .000
Water*Nutrient 493.563 2 246.781 .938 .401
W*C*N 587.827 2 293.914 1.11 .338
Error 9475.104 36 263.197
Total 6766373.818 48
Corrected total 871154.892 47 a R Squared = .989 (Adjusted R Squared = .986). Table A4: 24 Analysis variance of transpiration in Lole and Wanmun sweet potato cultivars as affected by potassium levels (16, 80, and 160 kg K/ha) and soil water regimes (30 and 80% soil field capacity), at 3 months after planting.
Source Type III Sum of Squares df Mean Square F P(HO)
Corrected model 812399.918 11 73854.538 366.160 .000
Intercept 8930246.909 1 8930246.909 44274.81 .000
Cultivars (C) 753868.612 1 753868.612 3737.567 .000
Water levels (W) 31365.187 1 31365.187 155.504 .000
Nutrient levels (N) 956.780 2 478.390 2.372 .108
Water*Cultivar 15980.364 1 15980.364 79.228 .000
Cultivar*Nutrient 5069.526 2 2534.763 12.567 .000
Water*Nutrient 2244.851 2 1122.425 5.565 .008
W*C*N 2914.597 2 1457.299 7.225 .002
Error 7261.214 36 201.700
Total 9749908.041 48
Corrected total 819661.132 47 a R Squared = .991 (Adjusted R Squared = .988).

332
Table A4: 25 Analysis variance of transpiration in Lole and Wanmun sweet potato cultivars as affected by nitrogen levels (20, 100, and 200 kg N/ha) and soil water regimes (30 and 80% soil field capacity), at 4 months after planting.
Source Type III Sum of Squares df Mean Square F P(HO)
Corrected model 884879.735 11 80443.612 61.595 .000
Intercept 6156396.650 1 6156396.650 4713.890 .000
Cultivars (C) 464035.005 1 464035.005 355.307 .000
Water levels (W) 6154.005 1 6154.005 4.712 .037
Nutrient levels (N) 358214.390 2 179107.195 137.141 .000
Water*Cultivar 3488.895 1 3488.895 2.671 .111
Cultivar*Nutrient 34809.242 2 17404.621 13.327 .000
Water*Nutrient 2793.726 2 1396.863 1.070 .354
W*C*N 15384.472 2 7692.236 5.890 .006
Error 47016.431 36 1306.012
Total 7088292.816 48
Corrected total 931896.166 47 a R Squared = .950 (Adjusted R Squared = .954). Table A4: 26 Analysis variance of transpiration of Lole and Wanmun sweet potato cultivars as affected by potassium levels (16, 80, and 160 kg K/ha) and soil water regimes (30 and 80% soil field capacity), at 4 months after planting.
Source Type III Sum of Squares df Mean Square F P(HO)
Corrected model 882446.075 11 80222.370 124.511 .000
Intercept 9399544.792 1 9399544.792 14588.74 .000
Cultivars (C) 834924.610 1 834924.610 1295.861 .000
Water levels (W) 16131.667 1 16131.667 25.037 .000
Nutrient levels (N) 2940.702 2 1470.351 2.282 .117
Water*Cultivar 17799.252 1 17799.252 27.626 .000
Cultivar*Nutrient 5158.245 2 2579.122 4.003 .027
Water*Nutrient 581.642 2 290.821 .451 .640
W*C*N 4909.957 2 2454.978 3.810 .032
Error 23194.847 36 644.301
Total 10305185.717 48
Corrected total 905640.921 47 a R Squared = .974 (Adjusted R Squared = .967).

333
Table A4: 27 Analysis variance of transpiration of Lole and Wanmun sweet potato cultivars as affected by nitrogen levels (20, 100, and 200 kg N/ha) and soil water regimes (30 and 80% soil field capacity), at 5 months after planting.
Source Type III Sum of Squares df Mean Square F P(HO)
Corrected model 1061621.556 11 96511.051 635.353 .000
Intercept 4392105.538 1 4392105.538 28914.16 .000
Cultivars (C) 564254.543 1 564254.543 3714.607 .000
Water levels (W) 12815.835 1 12815.835 84.369 .000
Nutrient levels (N) 363779.806 2 181889.903 1197.420 .000
Water*Cultivar 10109.615 1 10109.615 66.554 .000
Cultivar*Nutrient 101575.836 2 50787.918 334.348 .000
Water*Nutrient 3372.217 2 1686.108 11.100 .000
W*C*N 5713.704 2 2856.852 18.807 .000
Error 5468.456 36 151.902
Total 5459195.550 48
Corrected total 1067090.012 47 a R Squared = .995 (Adjusted R Squared = .993). Table A4: 28 Analysis variance of transpiration of Lole and Wanmun sweet potato cultivars as affected by potassium levels (16, 80, and 160 kg K/ha) and soil water regimes (30 and 80% soil field capacity), at 5 months after planting.
Source Type III Sum of Squares df Mean Square F P(HO)
Corrected model 1151802.409 11 104709.310 1828.744 .000
Intercept 7769861.333 1 7769861.333 135700.3 .000
Cultivars (C) 1118043.537 1 1118043.537 19526.58 .000
Water levels (W) 12891.812 1 12891.812 225.155 .000
Nutrient levels (N) 1704.403 2 852.202 14.884 .000
Water*Cultivar 13574.894 1 13574.894 237.085 .000
Cultivar*Nutrient 778.378 2 389.189 6.797 .003
Water*Nutrient 2271.812 2 1135.906 19.839 .000
W*C*N 2537.572 2 1268.786 22.159 .000
Error 2061.270 36 57.258
Total 8923725.013 48
Corrected total 1153863.679 47 a R Squared = .998 (Adjusted R Squared = .998).
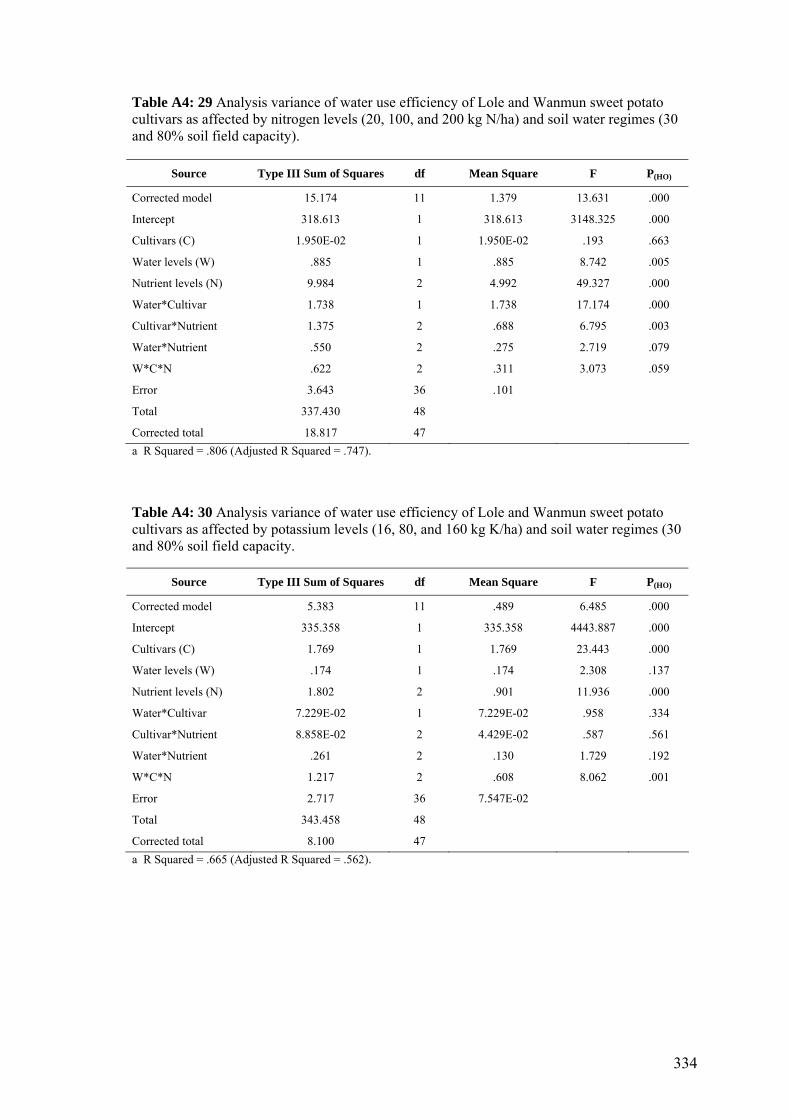
334
Table A4: 29 Analysis variance of water use efficiency of Lole and Wanmun sweet potato cultivars as affected by nitrogen levels (20, 100, and 200 kg N/ha) and soil water regimes (30 and 80% soil field capacity).
Source Type III Sum of Squares df Mean Square F P(HO)
Corrected model 15.174 11 1.379 13.631 .000
Intercept 318.613 1 318.613 3148.325 .000
Cultivars (C) 1.950E-02 1 1.950E-02 .193 .663
Water levels (W) .885 1 .885 8.742 .005
Nutrient levels (N) 9.984 2 4.992 49.327 .000
Water*Cultivar 1.738 1 1.738 17.174 .000
Cultivar*Nutrient 1.375 2 .688 6.795 .003
Water*Nutrient .550 2 .275 2.719 .079
W*C*N .622 2 .311 3.073 .059
Error 3.643 36 .101
Total 337.430 48
Corrected total 18.817 47 a R Squared = .806 (Adjusted R Squared = .747). Table A4: 30 Analysis variance of water use efficiency of Lole and Wanmun sweet potato cultivars as affected by potassium levels (16, 80, and 160 kg K/ha) and soil water regimes (30 and 80% soil field capacity.
Source Type III Sum of Squares df Mean Square F P(HO)
Corrected model 5.383 11 .489 6.485 .000
Intercept 335.358 1 335.358 4443.887 .000
Cultivars (C) 1.769 1 1.769 23.443 .000
Water levels (W) .174 1 .174 2.308 .137
Nutrient levels (N) 1.802 2 .901 11.936 .000
Water*Cultivar 7.229E-02 1 7.229E-02 .958 .334
Cultivar*Nutrient 8.858E-02 2 4.429E-02 .587 .561
Water*Nutrient .261 2 .130 1.729 .192
W*C*N 1.217 2 .608 8.062 .001
Error 2.717 36 7.547E-02
Total 343.458 48
Corrected total 8.100 47 a R Squared = .665 (Adjusted R Squared = .562).

335
Table A4: 31 Means of shoot dry mass, leaf dry mass, leaf area, and specific leaf weight as affected by soil water regimes (30 and 80% soil field capacity) and nitrogen levels (N20, N100, and N200).
Shoot dry mass (g/plant)
Leaf dry mass (g/plant)
Leaf area (cm2/plant)
Specific leaf weight
(mg/cm2) Water levels 30% 12.27b 4.82b 855.83b 5.94a
80% 21.12a 8.43a 1361.97a 6.42a
Cultivars
Lole 14.22d 6.18d 961.13d 6.71c
Wanmun 19.17c 7.08c 1256.66c 5.66d
Nutrient levels
N20 6.40g 1.80g 276.69g 6.54e
N100 15.19f 7.28f 1175.71f 6.26e
N200 28.51e 10.80e 1874.30e 5.74e
Cultivar*Water
Lole*30% 10.79 4.18 694.42 6.42
Lole*80% 17.65 8.18 1227.84 6.98
Wanmun*30% 13.75 5.47 1017.24 5.45
Wanmun*80% 24.59 8.68 1496.09 5.85
Cultivar*Nutrient
Lole*N20 6.21 1.73 236.03 7.26
Lole*N100 13.84 7.54 1067.51 7.05
Lole*N200 22.61 9.26 1579.85 5.82
Wanmun*N20 6.59 1.86 317.34 5.82
Wanmun*N100 16.53 7.03 1283.90 5.49
Wanmun*N200 34.40 12.34 2168.75 5.65
Water*Nutrient
30%*N20 4.69 1.31 211.31 6.29
30%*N100 11.84 5.28 896.59 6.08
30%*N200 20.29 7.89 1459.59 5.44
80%*N20 8.11 2.29 342.07 6.79
80%*N100 18.53 9.29 1454.82 6.44
80%*N200 36.73 13.72 2289.01 6.02
W*C*N
30*L*N20 4.72 1.23 177.24 6.94
30*L*N100 9.89 4.54 663.57 6.84
30*L*N200 17.76 6.76 1242.44 5.49
80*L*N20 7.70 2.24 294.82 7.57
80*L*N100 17.80 10.55 1471.45 7.24
80*L*N200 27.46 11.76 1917.27 6.14
30*W*N20 4.66 1.39 245.37 5.63
30*W*N100 13.79 6.02 1129.61 5.32
30*W*N200 22.81 9.01 1676.74 5.39
80*W*N20 8.52 2.34 389.32 6.00
80*W*N100 19.26 8.04 1438.20 5.65
80*W*N200 46.00 15.67 2660.76 5.90 Values within a column followed by the same letter symbol are not significantly different (p<0.05). All the interactions are significant (p<0.05).

336
Table A4: 32 Means of shoot and leaf dry mass, leaf area and specific leaf weight as affected by soil water regimes (30 and 80% soil field capacity) and potassium levels (K16, K80, and K160).
Shoot dry mass (g/plant)
Leaf dry mass (g/plant)
Leaf area (cm2/plant)
Specific leaf weight
(mg/cm2) Water levels 30% 19.10b 7.73b 1638.19b 4.90b
80% 33.19a 12.62a 2359.46a 5.44a
Cultivars
Lole 22.53d 9.25d 1659.10d 5.58c
Wanmun 29.76c 11.10c 2338.55c 4.76d
Nutrient levels
K16 24.41f 9.82f 2145.24e 4.65f
K80 25.52ef 9.90ef 1976.93f 5.11f
K160 28.51e 10.80e 1874.30f 5.74e
Cultivar*Water
Lole*30% 17.45 7.23 1353.80 5.41
Lole*80% 27.62 11.28 1964.40 5.74
Wanmun*30% 20.75 8.24 1922.59 4.38
Wanmun*80% 38.76 13.95 2754.51 5.13
Cultivar*Nutrient
Lole*K16 22.81 8.86 1728.71 5.12
Lole*K80 22.18 9.64 1668.73 5.79
Lole*K160 22.61 9.26 1579.85 5.81
Wanmun*K16 26.00 10.79 2561.78 4.19
Wanmun*K80 28.86 10.15 2285.12 4.43
Wanmun*K160 34.40 12.34 2168.75 5.65
Water*Nutrient
30%*K16 18.16 7.86 1821.85 4.41
30%*K80 18.85 7.45 1633.15 4.84
30%*K160 20.29 7.89 1459.59 5.44
80%*K16 30.65 11.78 2468.64 4.90
80%*K80 32.19 12.35 2320.71 5.38
80%*K160 36.73 13.72 2289.01 6.02
W*C*N
30*L*K16 17.30 7.47 1551.56 4.86
30*L*K80 17.30 7.45 1267.40 5.88
30*L*K160 17.76 6.76 1242.44 5.49
80*L*K16 28.32 10.24 1905.87 5.37
80*L*K80 27.07 11.84 2070.07 5.71
80*L*K160 27.46 11.76 1917.27 6.14
30*W*K16 19.03 8.26 2092.13 3.96
30*W*K80 20.41 7.45 1998.89 3.80
30*W*K160 22.81 9.01 1676.74 5.39
80*W*K16 32.98 13.33 3031.42 4.43
80*W*K80 37.31 12.86 2571.36 5.06
80*W*K160 46.00 15.67 2660.76 5.90 Values within a column followed by the same letter symbol are not significantly different (p<0.05). All the interactions are significant (p<0.05).

337
Table A4: 33 Means of root dry mass and tuber yields as affected by soil water regimes (30 and 80% soil field capacity) and nitrogen levels (20, 100 and 200 kg/ha).
Root dry mass (g/plant)
Tuber weight (g/plant)
Water levels 30% 3.57b 305.25b
80% 5.65a 543.04a
Cultivars
Lole 6.31c 395.83d
Wanmun 2.90d 452.46c
Nutrient levels
N20 2.68g 132.31g
N100 4.81f 578.75e
N200 6.33e 561.37f
Cultivar*Water
Lole*30% 4.70 312.17
Lole*80% 7.93 479.50
Wanmun*30% 2.43 298.33
Wanmun*80% 3.37 606.58
Cultivar*Nutrient
Lole*N20 3.45 125.38
Lole*N100 6.52 527.50
Lole*N200 8.97 534.63
Wanmun*N20 1.92 139.25
Wanmun*N100 3.11 630.00
Wanmun*N200 3.69 588.13
Water*Nutrient
30%*N20 2.18 100.63
30%*N100 3.07 400.75
30%*N200 5.45 414.38
80%*N20 3.19 164.00
80%*N100 6.56 756.75
80%*N200 7.21 708.38
W*C*N
30*L*N20 2.71 99.50
30*L*N100 3.46 411.00
30*L*N200 7.91 426.00
80*L*N20 4.18 151.25
80*L*N100 9.58 644.00
80*L*N200 10.03 643.25
30*W*N20 1.64 101.75
30*W*N100 2.67 390.50
30*W*N200 2.99 402.75
80*W*N20 2.19 176.75
80*W*N100 3.54 869.50
80*W*N200 4.39 773.50 Values within a column followed by the same letter symbol are not significantly different (p<0.05). All the interactions are significant (p<0.05).

338
Table A4: 34 Means of root dry mass and tuber yields as affected by soil water regimes (30 and 80% soil field capacity) and potassium levels (K16, K80, and K160).
Root dry mass (g/plant)
Tuber weight (g/plant)
Water levels 30% 4.79b 355.58b
80% 8.34a 603.21a
Cultivars
Lole 9.55c 489.29c
Wanmun 3.58d 469.50d
Nutrient levels
K16 6.70e 392.12g
K80 6.67e 484.68f
K160 6.33e 561.37e
Cultivar*Water
Lole*30% 6.76 372.42
Lole*80% 12.35 606.17
Wanmun*30% 2.82 338.75
Wanmun*80% 4.33 600.25
Cultivar*Nutrient
Lole*K16 10.00 427.13
Lole*K80 9.70 506.13
Lole*K160 8.97 534.63
Wanmun*K16 3.40 357.13
Wanmun*K80 3.65 463.25
Wanmun*K160 3.69 588.13
Water*Nutrient
30%*K16 4.47 314.63
30%*K80 4.46 337.75
30%*K160 5.45 414.38
80%*K16 8.93 469.63
80%*K80 8.89 631.63
80%*K160 7.21 708.38
W*C*N
30*L*K16 6.31 325.75
30*L*K80 6.07 365.50
30*L*K160 7.91 426.00
80*L*K16 13.70 528.50
80*L*K80 13.32 646.75
80*L*K160 10.03 643.25
30*W*K16 2.64 303.50
30*W*K80 2.85 310.00
30*W*K160 2.99 402.75
80*W*K16 4.16 410.75
80*W*K80 4.45 616.50
80*W*K160 4.39 773.50 Values within a column followed by the same letter symbol are not significantly different (p<0.05). All the interactions are significant (p<0.05).

339
Table A4: 35 Means of total chlorophyll, carotene and the chlorophyll a/b ratio of Lole and Wanmun as affected by soil water regimes (30 and 80% soil field capacity) and nitrogen levels (N20, N100, and N200).
Total chlorophyll (mg/g)
Carotene (mg/g)
Chlorophyll a/b ratio (mg/g)
Water levels 30% 1.32b 0.30b 4.66a
80% 1.78a 0.38a 4.60a
Cultivars
Lole 1.63c 0.35c 4.63c
Wanmun 1.45d 0.33d 4.64c
Nutrient levels
N20 0.82g 0.19g 4.64e
N100 1.37f 0.31f 4.66e
N200 2.46e 0.52e 4.60e
Cultivar*Water
Lole*30% 1.39 0.30 4.65
Lole*80% 1.88 0.41 4.61
Wanmun*30% 1.26 0.29 4.68
Wanmun*80% 1.68 0.36 4.59
Cultivar*Nutrient
Lole*N20 0.90 0.20 4.64
Lole*N100 1.46 0.33 4.65
Lole*N200 2.54 0.53 4.60
Wanmun*N20 0.74 0.17 4.65
Wanmun*N100 1.27 0.29 4.67
Wanmun*N200 2.39 0.52 4.59
Water*Nutrient
30%*N20 0.66 0.15 4.61
30%*N100 1.19 0.28 4.73
30%*N200 2.12 0.46 4.66
80%*N20 0.98 0.23 4.68
80%*N100 1.54 0.33 4.59
80%*N200 2.81 0.59 4.53
W*C*N
30*L*N20 0.73 0.16 4.60
30*L*N100 1.24 0.29 4.70
30*L*N200 2.19 0.46 4.65
80*L*N20 1.07 0.25 4.67
80*L*N100 1.68 0.36 4.60
80*L*N200 2.89 0.61 4.55
30*W*N20 0.59 0.13 4.61
30*W*N100 1.14 0.27 4.75
30*W*N200 2.05 0.45 4.67
80*W*N20 0.90 0.21 4.69
80*W*N100 1.40 0.30 4.58
80*W*N200 2.73 0.58 4.51 Values within a column followed by the same letter symbol are not significantly different (p<0.05). All the interactions are significant (p<0.05).

340
Table A4: 36 Means of total chlorophyll, carotene and the chlorophyll a/b ratio of Lole and Wanmun as affected by soil water regimes (30 and 80% soil field capacity) and potassium levels (K16, K80, and K160).
Total chlorophyll (mg/g)
Carotene (mg/g)
Chlorophyll a/b ratio (mg/g)
Water levels 30% 1.91b 0.41b 4.65a
80% 2.59a 0.55a 4.55b
Cultivars
Lole 2.30c 0.49c 4.60c
Wanmun 2.19d 0.47d 4.59d
Nutrient levels
K16 2.03g 0.43g 4.60e
K80 2.25f 0.48f 4.60e
K160 2.46e 0.52e 4.60e
Cultivar*Water
Lole*30% 1.97 0.42 4.65
Lole*80% 2.64 0.56 4.56
Wanmun*30% 1.84 0.40 4.65
Wanmun*80% 2.54 0.53 4.54
Cultivar*Nutrient
Lole*K16 2.10 0.45 4.60
Lole*K80 2.27 0.49 4.60
Lole*K160 2.54 0.53 4.60
Wanmun*K16 1.97 0.41 4.60
Wanmun*K80 2.22 0.47 4.59
Wanmun*K160 2.39 0.52 4.59
Water*Nutrient
30%*K16 1.67 0.36 4.65
30%*K80 1.93 0.42 4.64
30%*K160 2.12 0.46 4.66
80%*K16 2.40 0.50 4.55
80%*K80 2.57 0.54 4.56
80%*K160 2.81 0.59 4.53
W*C*N
30*L*K16 1.73 0.38 4.65
30*L*K80 1.99 0.43 4.64
30*L*K160 2.19 0.46 4.65
80*L*K16 2.47 0.52 4.56
80*L*K80 2.56 0.54 4.57
80*L*K160 2.89 0.61 4.55
30*W*K16 1.61 0.34 4.65
30*W*K80 1.87 0.41 4.64
30*W*K160 2.05 0.45 4.67
80*W*K16 2.33 0.49 4.55
80*W*K80 2.57 0.54 4.55
80*W*K160 2.73 0.58 4.51 Values within a column followed by the same letter symbol are not significantly different (p<0.05). All the interactions are significant (p<0.05).

341
Table A4: 37 Means of the daily transpiration of Lole and Wanmun cultivars as affected by soil water regimes (30 and 80% soil field capacity) and nitrogen levels (N20, N100, and N200).
Daily transpiration (g/day/plant)
WUE (g/kg of H2O)
Water levels 1st
month 2nd
month 3rd
month 4th
month 5th
month 30% 181.79b 197.87b 259.31b 259.82b 194.07b 2.56a
80% 321.50a 338.07a 441.59a 456.46a 410.92a 2.60a
Cultivars
Lole 221.63d 252.28d 327.54d 346.81d 286.15d 2.71c
Wanmun 281.67c 283.66c 373.36c 369.46c 318.83c 2.44d
Nutrient levels
N20 190.41g 174.58g 233.86g 239.38g 185.37g 1.93f
N100 264.41f 297.30f 381.45f 392.66f 328.19f 2.95e
N200 300.13e 332.03e 436.05e 442.36e 393.92e 2.84e
Cultivar*Water
Lole*30% 164.38 191.76 250.91 257.01 192.24 2.50
Lole*80% 278.88 312.80 404.17 436.61 380.06 2.92
Wanmun*30% 199.21 203.98 267.72 262.61 195.90 2.61
Wanmun*80% 364.13 363.35 479.01 476.30 441.77 2.27
Cultivar*Nutrient
Lole*N20 163.63 162.95 191.84 233.31 180.88 2.19
Lole*N100 229.81 285.00 289.85 386.88 305.99 3.10
Lole*N200 271.44 308.90 296.25 420.24 371.59 2.84
Wanmun*N20 217.19 186.20 275.88 245.45 189.86 1.67
Wanmun*N100 299.00 309.61 473.05 398.45 350.40 2.80
Wanmun*N200 328.81 355.17 575.85 464.47 416.25 2.85
Water*Nutrient
30%*N20 142.81 147.47 215.33 177.34 138.68 1.68
30%*N100 182.69 225.44 355.33 286.21 206.68 3.01
30%*N200 219.88 220.70 411.97 315.88 236.85 2.98
80%*N20 238.00 201.69 252.39 301.42 232.06 2.19
80%*N100 346.13 369.17 407.57 499.11 449.71 2.89
80%*N200 380.38 443.37 460.13 568.84 550.98 2.71
W*C*N
30*L*N20 140.50 144.25 182.91 163.16 133.29 1.66
30*L*N100 146.25 216.28 281.24 280.74 206.32 3.13
30*L*N200 206.38 214.76 288.58 327.14 237.13 2.71
80*L*N20 186.75 181.65 247.75 303.46 228.48 2.73
80*L*N100 313.38 353.72 429.42 493.01 405.66 3.07
80*L*N200 336.50 403.03 535.35 513.35 506.05 2.97
30*W*N20 145.13 150.68 200.77 191.52 144.08 1.70
30*W*N100 219.13 234.61 298.46 291.68 207.04 2.89
30*W*N200 233.38 226.65 303.92 304.61 236.58 3.24
80*W*N20 289.25 221.73 304.01 299.38 235.63 1.65
80*W*N100 378.88 384.62 516.68 505.22 493.76 2.71
80*W*N200 424.25 483.70 616.34 624.32 595.91 2.45 Values within a column followed by the same letter symbol are not significantly different (p<0.05). All the interactions are significant (p<0.05).
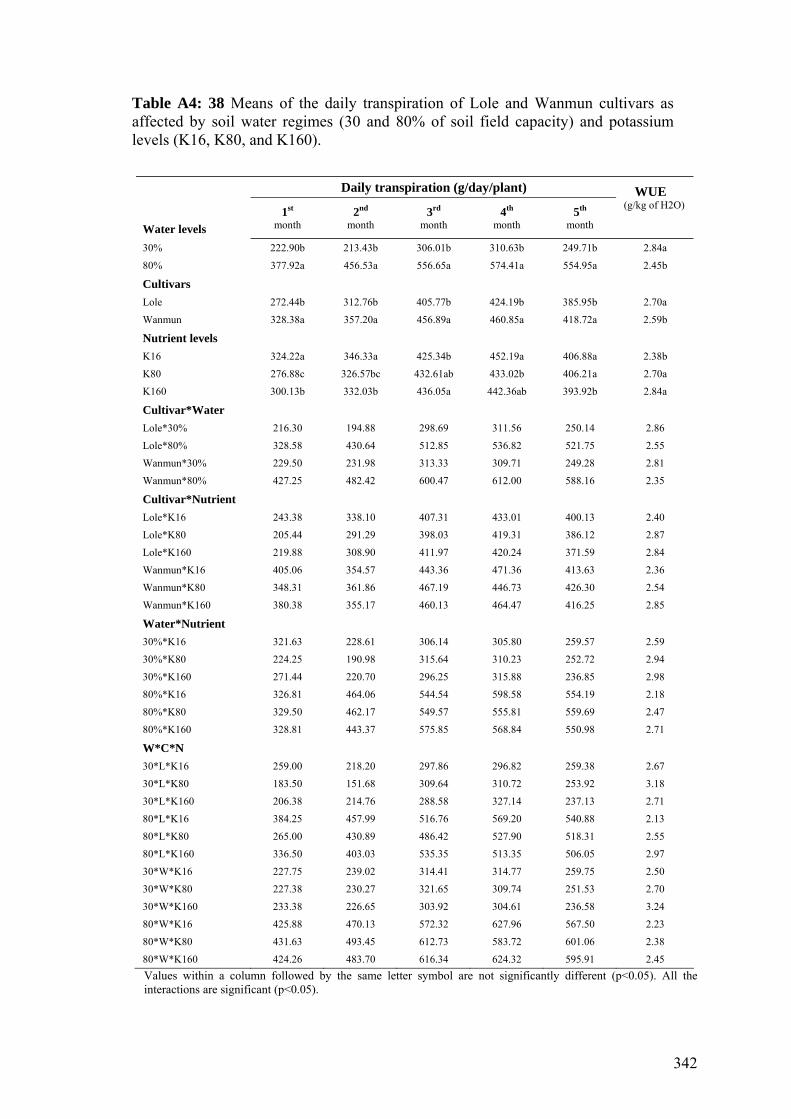
342
Table A4: 38 Means of the daily transpiration of Lole and Wanmun cultivars as affected by soil water regimes (30 and 80% of soil field capacity) and potassium levels (K16, K80, and K160).
Daily transpiration (g/day/plant)
WUE (g/kg of H2O)
Water levels 1st
month 2nd
month 3rd
month 4th
month 5th
month 30% 222.90b 213.43b 306.01b 310.63b 249.71b 2.84a
80% 377.92a 456.53a 556.65a 574.41a 554.95a 2.45b
Cultivars Lole 272.44b 312.76b 405.77b 424.19b 385.95b 2.70a
Wanmun 328.38a 357.20a 456.89a 460.85a 418.72a 2.59b
Nutrient levels K16 324.22a 346.33a 425.34b 452.19a 406.88a 2.38b
K80 276.88c 326.57bc 432.61ab 433.02b 406.21a 2.70a
K160 300.13b 332.03b 436.05a 442.36ab 393.92b 2.84a
Cultivar*Water Lole*30% 216.30 194.88 298.69 311.56 250.14 2.86
Lole*80% 328.58 430.64 512.85 536.82 521.75 2.55
Wanmun*30% 229.50 231.98 313.33 309.71 249.28 2.81
Wanmun*80% 427.25 482.42 600.47 612.00 588.16 2.35
Cultivar*Nutrient Lole*K16 243.38 338.10 407.31 433.01 400.13 2.40
Lole*K80 205.44 291.29 398.03 419.31 386.12 2.87
Lole*K160 219.88 308.90 411.97 420.24 371.59 2.84
Wanmun*K16 405.06 354.57 443.36 471.36 413.63 2.36
Wanmun*K80 348.31 361.86 467.19 446.73 426.30 2.54
Wanmun*K160 380.38 355.17 460.13 464.47 416.25 2.85
Water*Nutrient 30%*K16 321.63 228.61 306.14 305.80 259.57 2.59
30%*K80 224.25 190.98 315.64 310.23 252.72 2.94
30%*K160 271.44 220.70 296.25 315.88 236.85 2.98
80%*K16 326.81 464.06 544.54 598.58 554.19 2.18
80%*K80 329.50 462.17 549.57 555.81 559.69 2.47
80%*K160 328.81 443.37 575.85 568.84 550.98 2.71
W*C*N
30*L*K16 259.00 218.20 297.86 296.82 259.38 2.67
30*L*K80 183.50 151.68 309.64 310.72 253.92 3.18
30*L*K160 206.38 214.76 288.58 327.14 237.13 2.71
80*L*K16 384.25 457.99 516.76 569.20 540.88 2.13
80*L*K80 265.00 430.89 486.42 527.90 518.31 2.55
80*L*K160 336.50 403.03 535.35 513.35 506.05 2.97
30*W*K16 227.75 239.02 314.41 314.77 259.75 2.50
30*W*K80 227.38 230.27 321.65 309.74 251.53 2.70
30*W*K160 233.38 226.65 303.92 304.61 236.58 3.24
80*W*K16 425.88 470.13 572.32 627.96 567.50 2.23
80*W*K80 431.63 493.45 612.73 583.72 601.06 2.38
80*W*K160 424.26 483.70 616.34 624.32 595.91 2.45 Values within a column followed by the same letter symbol are not significantly different (p<0.05). All the interactions are significant (p<0.05).

APPENDIX A5
PLANT MEASUREMENTS AND RESULTS OF STATISTICAL ANALYSES OF CHAPTER 5
Table A5: 1 Analysis variance of fresh shoot biomass of Lole and Wanmun cultivars, Lole grafted onto Wanmun and Wanmun grafted onto Lole grown at 30 and 80% soil field capacity at 1 month after planting.
Source Type III Sum of Squares df Mean Square F P(H0)
Corrected Model 20763.370 7 2966.196 81.587 .000
Intercept 295857.200 1 295857.200 8137.726 .000
Water levels 15677.640 1 431.223 431.223 .000
Cultivars 3780.635 3 34.663 34.663 .000
Water levels * Cultivars 1305.095 3 11.966 11.966 .000
Error 1163.400 32
Total 317783.970 40
Corrected Total 21926.770 39
a R Squared = .947 (Adjusted R Squared = .935). Table A5: 2 Analysis variance of fresh shoot biomass of Lole and Wanmun cultivars, Lole grafted onto Wanmun and Wanmun grafted onto Lole grown on 30 and 80% soil field capacity at 2 months after planting.
Source Type III Sum of Squares df Mean Square F P(H0)
Corrected Model 167310.375 7 23901.482 80.069 .000
Intercept 2037168.225 1 2037168.225 6824.398 .000
Water levels 113955.625 1 113955.625 381.745 .000
Cultivars 45871.475 3 15290.492 51.222 .000
Water levels * Cultivars 7483.275 3 2494.425 8.356 .000
Error 9552.400 32 298.513
Total 2214031.000 40
Corrected Total 176862.775 39 a R Squared = .946 (Adjusted R Squared = .934).
343

Table A5: 3 Analysis variance of fresh shoot biomass of Lole and Wanmun cultivars, Lole grafted onto Wanmun and Wanmun grafted onto Lole grown on 30 and 80% soil field capacity at 5 months after planting.
Source Type III Sum of Squares df Mean Square F P(H0)
Corrected Model 644019.175 7 92002.739 96.586 .000
Intercept 3876930.225 1 3876930.225 4070.054 .000
Water levels 229977.225 1 229977.225 241.433 .000
Cultivars 361493.475 3 120497.825 126.500 .000
Water levels * Cultivars 52548.475 3 17516.158 18.389 .000
Error 30481.600 32 952.550 .000
Total 4551431.000 40
Corrected Total 674500.775 39 a R Squared = .955 (Adjusted R Squared = .945). Table A5: 4 Analysis variance of dry shoot biomass of Lole and Wanmun cultivars, Lole grafted onto Wanmun and Wanmun grafted onto Lole grown on 30 and 80% soil field capacity at 1 month after planting.
Source Type III Sum of Squares df Mean Square F P(H0)
Corrected Model 824.289 7 117.756 196.607 .000
Intercept 7307.290 1 7307.290 12200.371 .000
Water levels 625.997 1 625.997 1045.176 .000
Cultivars 158.416 3 52.805 88.165 .000
Water levels * Cultivars 39.876 3 13.292 22.192 .000
Error 19.166 32 .599
Total 8150.746 40
Corrected Total 843.455 39 a R Squared = .977 (Adjusted R Squared = .972). Table A5: 5 Analysis variance of dry shoot biomass of Lole and Wanmun cultivars, Lole grafted onto Wanmun and Wanmun grafted onto Lole grown on 30 and 80% soil field capacity at 2 months after planting.
Source Type III Sum of Squares df Mean Square F P(H0)
Corrected Model 4421.917 7 631.702 66.946 .000
Intercept 41186.232 1 41186.232 4364.782 .000
Water levels 2875.907 1 2875.907 304.779 .000
Cultivars 1400.329 3 466.776 49.467 .000
Water levels * Cultivars 145.681 3 48.560 5.146 .005
Error 301.953 32 9.436
Total 45910.102 40
Corrected Total 4723.870 39 a R Squared = .936 (Adjusted R Squared = .922).
344

Table A5: 6 Analysis variance of dry shoot biomass of Lole and Wanmun cultivars, Lole grafted onto Wanmun and Wanmun grafted onto Lole grown on 30 and 80% soil field capacity at 5 months after planting.
Source Type III Sum of Squares df Mean Square F P(H0)
Corrected Model 5.299 7 .757 213.377 .000
Intercept 290.133 1 290.133 81774.963 .000
Water levels 2.601 1 2.601 733.022 .000
Cultivars 2.444 3 .815 229.653 .000
Water levels * Cultivars .254 3 8.474E-02 23.884 .000
Error .114 32 3.548E-03
Total 295.546 40
Corrected Total 5.413 39 a R Squared = .979 (Adjusted R Squared = .974). Table A5: 7 Analysis variance of fresh leaf weight of Lole and Wanmun cultivars, Lole grafted onto Wanmun and Wanmun grafted onto Lole grown on 30 and 80% soil field capacity at harvest time.
Source Type III Sum of Squares df Mean Square F P(H0)
Corrected Model 63786.620 7 9112.374 127.769 .000
Intercept 460338.480 1 460338.480 6454.607 .000
Water levels 53513.614 1 53513.614 750.338 .000
Cultivars 8185.242 3 2728.414 38.256 .000
Water levels * Cultivars 2087.763 3 695.921 9.758 .000
Error 2282.220 32 71.319
Total 526407.320 40
Corrected Total 66068.839 39 a R Squared = .965 (Adjusted R Squared = .958). Table A5: 8 Analysis variance of leaf dry weight of Lole and Wanmun cultivars, Lole grafted onto Wanmun and Wanmun grafted onto Lole grown on 30 and 80% soil field capacity at harvest time.
Source Type III Sum of Squares df Mean Square F P(H0)
Corrected Model 896.065 7 128.009 162.770 .000
Intercept 10027.989 1 10027.989 12751.097 .000
Water levels 665.366 1 665.366 846.047 .000
Cultivars 169.401 3 56.467 71.801 .000
Water levels * Cultivars 61.297 3 20.432 25.981 .000
Error 25.166 32 .786
Total 10949.220 40
Corrected Total 921.231 39 a R Squared = .973 (Adjusted R Squared = .967).
345

Table A5: 9 Analysis variance of leaf area of Lole and Wanmun cultivars, Lole grafted onto Wanmun and Wanmun grafted onto Lole grown on 30 and 80% soil field capacity at harvest time.
Source Type III Sum of Squares df Mean Square F P(H0)
Corrected Model 10435276.05 7 1490753.722 808.115 .000
Intercept 164613830.51 1 164613830.51 89234.651 .000
Water levels 3491829.009 1 3491829.009 1892.867 .000
Cultivars 5459673.782 3 1819891.261 986.535 .000
Water levels * Cultivars 1483773.267 3 494591.089 268.11 .000
Error 59031.358 32 1844.73
Total 175108137.928 40
Corrected Total 10494307.41 39 a R Squared = .994 (Adjusted R Squared = .993). Table A5: 10 Analysis variance of specific leaf weight of Lole and Wanmun cultivars, Lole grafted onto Wanmun and Wanmun grafted onto Lole grown on 30 and 80% soil field capacity at harvest time.
Source Type III Sum of Squares df Mean Square F P(H0)
Corrected Model 52.497 7 7.500 45.148 .000
Intercept 2409.452 1 2409.452 14505.098 .000
Water levels 36.472 1 36.472 219.563 .000
Cultivars 5.922 3 1.974 11.885 .000
Water levels * Cultivars 10.103 3 3.368 20.274 .000
Error 5.316 32 .166
Total 2467.265 40
Corrected Total 57.813 39 a R Squared = .908 (Adjusted R Squared = .888). Table A5: 11 Analysis variance of root fresh weight of Lole and Wanmun cultivars, Lole grafted onto Wanmun and Wanmun grafted onto Lole grown on 30 and 80% soil field capacity at 1 month after planting.
Source Type III Sum of Squares df Mean Square F P(H0)
Corrected Model 4902.264 7 700.323 28.587 .000
Intercept 78739.002 1 78739.002 3214.148 .000
Water levels 2861.172 1 2861.172 116.794 .000
Cultivars 1218.807 3 406.269 16.584 .000
Water levels * Cultivars 822.285 3 274.095 11.189 .000
Error 783.924 32 24.498
Total 84425.190 40
Corrected Total 5686.188 39 a R Squared = .862 (Adjusted R Squared = .832).
346

Table A5: 12 Analysis variance of root dry weight of Lole and Wanmun cultivars, Lole grafted onto Wanmun and Wanmun grafted onto Lole grown on 30 and 80% soil field capacity at 1 months after planting (data was transformed into ln transformation).
Source Type III Sum of Squares df Mean Square F P(H0)
Corrected Model 14.763 7 2.109 425.906 .000
Intercept 659.169 1 659.169 133114.01 .000
Water levels 8.159 1 8.159 1647.620 .000
Cultivars 5.253 3 1.751 353.614 .000
Water levels * Cultivars 1.351 3 .450 90.959 .000
Error .158 32 4.952E-03
Total 674.091 40
Corrected Total 14.922 39 a R Squared = .989 (Adjusted R Squared = .987). Table A5: 13 Analysis variance of root fresh weight of Lole and Wanmun cultivars, Lole grafted onto Wanmun and Wanmun grafted onto Lole grown on 30 and 80% soil field capacity at 2 months after planting.
Source Type III Sum of Squares df Mean Square F P(H0)
Corrected Model 220454.575 7 31493.511 71.178 .000
Intercept 326705.625 1 326705.625 738.380 .000
Water levels 48511.225 1 48511.225 109.639 .000
Cultivars 129609.675 3 43203.225 97.643 .000
Water levels * Cultivars 42333.675 3 14111.225 31.892 .000
Error 14158.800 32 442.463
Total 561319.000 40
Corrected Total 234613.375 39 a R Squared = .940 (Adjusted R Squared = .926). Table A5: 14 Analysis variance of root dry weight of Lole and Wanmun cultivars, Lole grafted onto Wanmun and Wanmun grafted onto Lole grown on 30 and 80% soil field capacity at 2 months after planting.
Source Type III Sum of Squares df Mean Square F P(H0)
Corrected Model 283.556 7 40.508 365.760 .000
Intercept 2057.790 1 2057.790 18580.499 .000
Water levels 195.806 1 195.806 1768.002 .000
Cultivars 44.613 3 14.871 134.275 .000
Water levels * Cultivars 43.137 3 14.379 129.832 .000
Error 3.544 32 .111
Total 2344.890 40
Corrected Total 287.100 39 a R Squared = . 988 (Adjusted R Squared = .985).
347

Table A5: 15 Analysis variance of root fresh weight of Lole and Wanmun cultivars, Lole grafted onto Wanmun and Wanmun grafted onto Lole grown on 30 and 80% soil field capacity at 5 months after planting.
Source Type III Sum of Squares df Mean Square F P(H0)
Corrected Model 1010.046 7 144.292 65.554 .000
Intercept 2733.401 1 2733.401 1241.816 .000
Water levels 754.119 1 754.119 342.605 .000
Cultivars 145.745 3 48.582 22.071 .000
Water levels * Cultivars 110.182 3 36.727 16.686 .000
Error 70.436 32 2.201
Total 3813.883 40
Corrected Total 1080.482 39 a R Squared = .935 (Adjusted R Squared = .921). Table A5: 16 Analysis variance of root dry weight of Lole and Wanmun cultivars, Lole grafted onto Wanmun and Wanmun grafted onto Lole grown on 30 and 80% soil field capacity at 5 months after planting.
Source Type III Sum of Squares df Mean Square F P(H0)
Corrected Model 35.580 7 5.083 121.281 .000
Intercept 206.723 1 206.723 4932.550 .000
Water levels 10.791 1 10.791 257.474 .000
Cultivars 24.018 3 8.006 191.03 .000
Water levels * Cultivars .771 3 .257 6.132 .002
Error 1.341 32 4.191E-02
Total 243.644 40
Corrected Total 36.921 39 a R Squared = .964 (Adjusted R Squared = .956). Table A5: 17 Analysis variance of tuber weight of Lole and Wanmun cultivars, Lole grafted onto Wanmun and Wanmun grafted onto Lole grown on 30 and 80% soil field capacity at harvest time.
Source Type III Sum of Squares df Mean Square F P(H0)
Corrected Model 1743833.400 7 249119.057 134.039 .000
Intercept 4609104.771 1 4609104.771 2479.937 .000
Water levels 634614.943 1 634614.943 341.456 .000
Cultivars 825056.200 3 275018.733 147.974 .000
Water levels * Cultivars 136731.756 3 45577.252 24.523 .000
Error 52039.600 32 1858.557
Total 7551074.000 40
Corrected Total 1795873.000 39 a R Squared = .971(Adjusted R Squared = .964).
348

Table A5: 18 Analysis variance of tuber number of Lole and Wanmun cultivars, Lole grafted onto Wanmun and Wanmun grafted onto Lole grown on 30 and 80% soil field capacity at harvest time.
Source Type III Sum of Squares df Mean Square F P(H0)
Corrected Model 228.306 7 32.615 91.322 .000
Intercept 583.393 1 583.393 1633.500 .000
Water levels 55.736 1 55.736 156.060 .000
Cultivars 62.206 3 20.735 58.059 .000
Water levels * Cultivars 93.850 3 31.283 87.593 .000
Error 10.000 32 .357
Total 855.000 40
Corrected Total 238.306 39 a R Squared = .958 (Adjusted R Squared = .948). Table A5: 19 Analysis variance of average weight of tuber of Lole and Wanmun cultivars, Lole grafted onto Wanmun and Wanmun grafted onto Lole grown on 30 and 80 % soil field capacity at harvest time (data was transformed into ln transformation).
Source Type III Sum of Squares df Mean Square F P(H0)
Corrected Model 30.003 7 4.286 36.167 .000
Intercept 620.744 1 620.744 5237.886 .000
Water levels .579 1 .579 4.883 .035
Cultivars 25.640 3 8.547 72.118 .000
Water levels * Cultivars 4.066 3 1.355 11.437 .000
Error 3.318 32 .119
Total 741.576 40
Corrected Total 33.322 39 a R Squared = .900 (Adjusted R Squared = .876). Table A5: 20 Analysis variance of harvest index of tuber of Lole and Wanmun cultivars, Lole grafted onto Wanmun and Wanmun grafted onto Lole grown on 30 and 80% soil field capacity at harvest time.
Source Type III Sum of Squares df Mean Square F P(H0)
Corrected Model 2.130 7 .304 140.785 .000
Intercept 7.787 1 7.787 3602.617 .000
Water levels 4.479E-0 1 4.479E-02 20.721 .000
Cultivars 2.075 3 .692 320.011 .000
Water levels * Cultivars 1.024E-02 3 3.414E-03 1.57 .214
Error 6.916E-02 32 2.161E-03
Total 9.986 40
Corrected Total 2.199 39 a R Squared = .969 (Adjusted R Squared = .962).
349

Table A5: 21 Analysis variance of chlorophyll a concentration of Lole and Wanmun cultivars, Lole grafted onto Wanmun and Wanmun grafted onto Lole grown on 30 and 80% soil field capacity.
Source Type III Sum of Squares df Mean Square F P(H0)
Corrected Model 4704196.706 7 672028.101 23.346 .000
Intercept 204175008.24 1 204175008.24 7093.068 .000
Water levels 3477944.600 1 3477944.600 120.824 .000
Cultivars 487115.758 3 162371.919 5.641 .003
Water levels * Cultivars 739136.347 3 246378.782 8.559 .000
Error 1151405.826 32 28785.146
Total 210030610.77 40
Corrected Total 5855602.531 39 a R Squared = .803 (Adjusted R Squared = .769). Table A5: 22 Analysis variance of chlorophyll b concentration of Lole and Wanmun cultivars, Lole grafted onto Wanmun and Wanmun grafted onto Lole grown on 30 and 80 % soil field capacity.
Source Type III Sum of Squares df Mean Square F P(H0)
Corrected Model 574296.347 7 82042.335 13.609 .000
Intercept 15577588.697 1 15577588.690 2583.929 .000
Water levels 415672.797 1 415672.797 68.950 .000
Cultivars 112653.910 3 37551.303 6.229 .001
Water levels * Cultivars 45969.640 3 15323.213 2.542 .070
Error 241145.759 32 6028.644
Total 16393030.800 40
Corrected Total 815442.107 39 a R Squared = .704 (Adjusted R Squared = .653). Table A5: 23 Analysis variance of carotene concentration of Lole and Wanmun cultivars, Lole grafted onto Wanmun and Wanmun grafted onto Lole grown on 30 and 80% soil field capacity.
Source Type III Sum of Squares df Mean Square F P(H0)
Corrected Model 172538.647 7 24648.378 20.807 .000
Intercept 10083728.677 1 10083728.678 8512.317 .000
Water levels 132445.786 1 132445.786 111.806 .000
Cultivars 13148.899 3 4382.966 3.700 .019
Water levels * Cultivars 26943.962 3 8981.321 .000
Error 47384.180 32 1184.604 7.582
Total 10303651.50 40
Corrected Total 219922.827 39 a R Squared = .785 (Adjusted R Squared = .747).
350

Table A5: 24 Analysis variance of total chlorophyll concentration of Lole and Wanmun cultivars, Lole grafted onto Wanmun and Wanmun grafted onto Lole grown on 30 and 80% soil field capacity.
Source Type III Sum of Squares df Mean Square F P(H0)
Corrected Model 8280913.520 7 1182987.646 20.271 .000
Intercept 332545403.483 1 332545403.48 5698.251 .000
Water levels 6298351.860 1 6298351.860 107.924 .000
Cultivars 861846.214 3 287282.071 4.923 .005
Water levels * Cultivars 1120715.446 3 373571.815 6.401 .001
Error 2334368.139 32 58359.203
Total 343160685.145 40
Corrected Total 10615281.65 39 a R Squared = .780 (Adjusted R Squared = .742). Table A5: 25 Analysis variance of chlorophyll a/b ratio of Lole and Wanmun cultivars, Lole grafted onto Wanmun and Wanmun grafted onto Lole grown on 30 and 80% soil field capacity (data was transformed into ln transformation).
Source Type III Sum of Squares df Mean Square F P(H0)
Corrected Model .320 7 4.569E-02 8.277 .000
Intercept 80.996 1 80.996 14672.909 .000
Water levels 6.127E-02 1 6.127E-02 11.099 .002
Cultivars .244 3 8.126E-02 14.721 .000
Water levels * Cultivars 1.480E-02 3 4.934E-03 .894 .453
Error .221 32 5.520E-03
Total 81.537 40
Corrected Total .541 39 a R Squared = .592(Adjusted R Squared = .520). Table A5: 26 Analysis variance of stomata density of upper (adaxial) leaves surface of Lole and Wanmun cultivars, Lole grafted onto Wanmun and Wanmun grafted onto Lole grown on 30 and 80% soil field capacity at harvest time.
Source Type III Sum of Squares df Mean Square F P(H0)
Corrected Model 550.99 7 78.71 6.02 0.00
Intercept 19262.35 1 19262.35 1471.93 0.00
Water levels 20.86 1 20.86 1.59 0.21
Cultivars 463.58 3 154.53 11.81 0.00
Water levels * Cultivars 66.54 3 22.18 1.70 0.19
Error 418.77 32 13.09
Total 20232.10 40
Corrected Total 969.75 39 a R Squared = .568 (Adjusted R Squared = .474).
351

Table A5: 27 Analysis variance of stomatal density of lower (abaxial) leaves surface of Lole and Wanmun cultivars, Lole grafted onto Wanmun and Wanmun grafted onto Lole grown on 30 and 80% soil field capacity at harvest time.
Source Type III Sum of Squares df Mean Square F P(H0)
Corrected Model 3202.84 7 457.55 12.23 .000
Intercept 93659.38 1 93659.38 2503.77 .000
Water levels 134.44 1 134.44 3.60 .067
Cultivars 2925.80 3 975.27 26.07 .000
Water levels * Cultivars 142.59 3 47.53 1.27 .301
Error 1197.04 32 37.41
Total 98059.26 40
Corrected Total 4399.88 39 a R Squared = .728 (Adjusted R Squared = .668). Table A5: 28 Analysis variance of length of guard cell of Lole and Wanmun cultivars, Lole grafted onto Wanmun and Wanmun grafted onto Lole grown on 30 and 80% soil field capacity.
Source Type III Sum of Squares df Mean Square F P(H0)
Corrected Model 147.360 7 21.051 68.534 .000
Intercept 4611.685 1 4611.685 15013.623 .000
Water levels 5.069 1 1.690 5.501 .002
Cultivars 142.045 3 142.045 462.435 .000
Water levels * Cultivars .246 3 8.183E-02 .266 .849
Error 22.116 32 .307
Total 4781.160 40
Corrected Total 169.476 39 a R Squared = .870 (Adjusted R Squared = .857). Table A5: 29 Analysis variance of cuticle thickness of Lole and Wanmun cultivars, Lole grafted onto Wanmun and Wanmun grafted onto Lole grown on 30 and 80% soil field capacity.
Source Type III Sum of Squares df Mean Square F P(H0)
Corrected Model 12.011 7 1.716 7.122 .000
Intercept 424.121 1 424.121 1760.242 .000
Water levels 9.113 1 9.113 37.820 .000
Cultivars 2.585 3 .862 3.577 .018
Water levels * Cultivars .313 3 .104 .434 .730
Error 17.348 32 .241
Total 453.480 40
Corrected Total 29.350 39 a R Squared = .409 (Adjusted R Squared = .352).
352
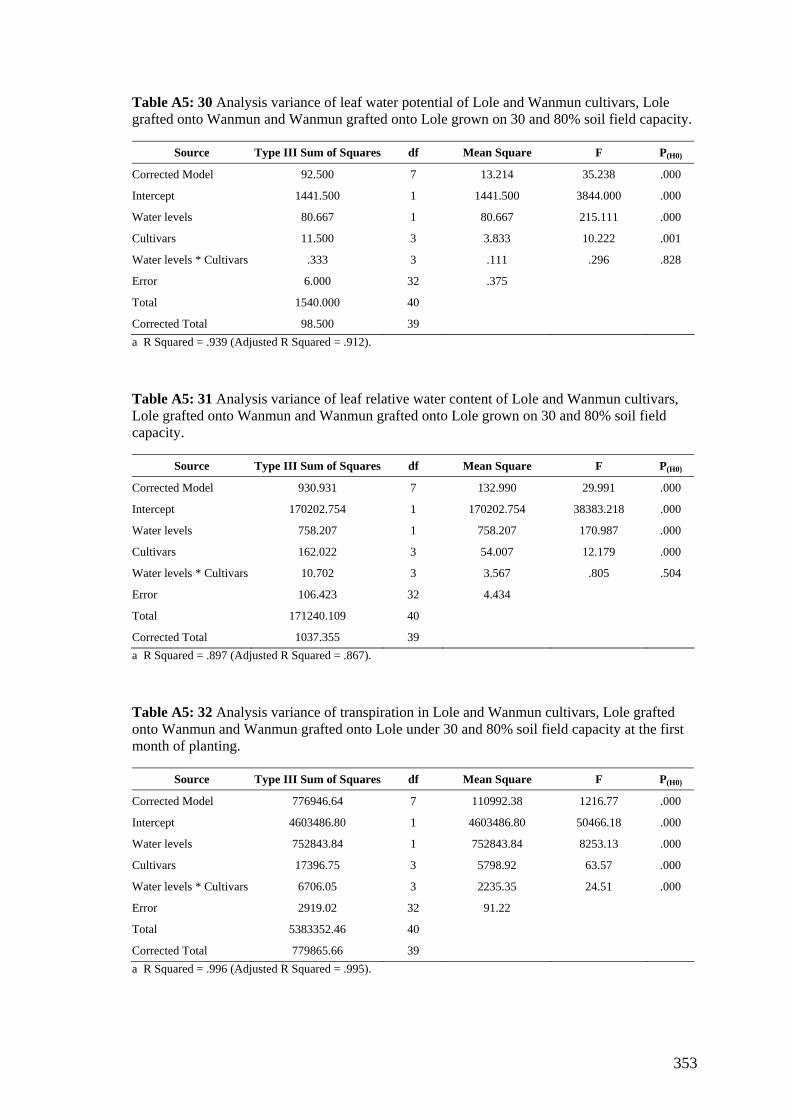
Table A5: 30 Analysis variance of leaf water potential of Lole and Wanmun cultivars, Lole grafted onto Wanmun and Wanmun grafted onto Lole grown on 30 and 80% soil field capacity.
Source Type III Sum of Squares df Mean Square F P(H0)
Corrected Model 92.500 7 13.214 35.238 .000
Intercept 1441.500 1 1441.500 3844.000 .000
Water levels 80.667 1 80.667 215.111 .000
Cultivars 11.500 3 3.833 10.222 .001
Water levels * Cultivars .333 3 .111 .296 .828
Error 6.000 32 .375
Total 1540.000 40
Corrected Total 98.500 39 a R Squared = .939 (Adjusted R Squared = .912). Table A5: 31 Analysis variance of leaf relative water content of Lole and Wanmun cultivars, Lole grafted onto Wanmun and Wanmun grafted onto Lole grown on 30 and 80% soil field capacity.
Source Type III Sum of Squares df Mean Square F P(H0)
Corrected Model 930.931 7 132.990 29.991 .000
Intercept 170202.754 1 170202.754 38383.218 .000
Water levels 758.207 1 758.207 170.987 .000
Cultivars 162.022 3 54.007 12.179 .000
Water levels * Cultivars 10.702 3 3.567 .805 .504
Error 106.423 32 4.434
Total 171240.109 40
Corrected Total 1037.355 39 a R Squared = .897 (Adjusted R Squared = .867). Table A5: 32 Analysis variance of transpiration in Lole and Wanmun cultivars, Lole grafted onto Wanmun and Wanmun grafted onto Lole under 30 and 80% soil field capacity at the first month of planting.
Source Type III Sum of Squares df Mean Square F P(H0)
Corrected Model 776946.64 7 110992.38 1216.77 .000
Intercept 4603486.80 1 4603486.80 50466.18 .000
Water levels 752843.84 1 752843.84 8253.13 .000
Cultivars 17396.75 3 5798.92 63.57 .000
Water levels * Cultivars 6706.05 3 2235.35 24.51 .000
Error 2919.02 32 91.22
Total 5383352.46 40
Corrected Total 779865.66 39 a R Squared = .996 (Adjusted R Squared = .995).
353

Table A5: 33 Analysis variance of transpiration in Lole and Wanmun cultivars, Lole grafted onto Wanmun and Wanmun grafted onto Lole grown on 30 and 80 % soil field capacity at the second month of planting.
Source Type III Sum of Squares df Mean Square F P(H0)
Corrected Model 2122057.14 7 303151.02 1424.27 .000
Intercept 10445351.00 1 10445351.00 49074.49 .000
Water levels 2107498.56 1 2107498.56 9901.48 .000
Cultivars 12496.27 3 4165.42 19.57 .000
Water levels * Cultivars 2062.32 3 687.44 3.23 .035
Error 6811.10 32 212.85
Total 12574219.25 40
Corrected Total 2128868.24 39 a R Squared = .997 (Adjusted R Squared = .996). Table A5: 34 Analysis variance of transpiration in Lole and Wanmun cultivars, Lole grafted onto Wanmun and Wanmun grafted onto Lole grown on 30 and 80% soil field capacity at the third month of planting.
Source Type III Sum of Squares df Mean Square F P(H0)
Corrected Model 1275782.04 7 182254.58 1732.20 .000
Intercept 11369743.64 1 11369743.64 108061.23 .000
Water levels 1264869.23 1 1264869.23 12021.67 .000
Cultivars 10083.07 3 3361.02 31.94 .000
Water levels * Cultivars 829.75 3 276.58 2.63 .067
Error 3366.90 32 105.22
Total 12648892.58 40
Corrected Total 1279148.94 39 a R Squared = .997 (Adjusted R Squared = .997). Table A5: 35 Analysis variance of transpiration in Lole and Wanmun cultivars, Lole grafted onto Wanmun and Wanmun grafted onto Lole grown on 30 and 80% soil field capacity at the fourth month of planting.
Source Type III Sum of Squares df Mean Square F P(H0)
Corrected Model 1322479.906 7 188925.701 3082.626 .000
Intercept 11571627.61 1 11571627.61 188809.70 .000
Water levels 1310910.642 1 1310910.642 21389.61 .000
Cultivars 9488.859 3 3162.953 51.609 .000
Water levels * Cultivars 2080.405 3 693.468 11.315 .000
Error 1961.192 32 61.287
Total 12896068.71 40
Corrected Total 1324441.09 39 a R Squared = .999 (Adjusted R Squared = .998).
354

Table A5: 36 Analysis variance of transpiration in Lole and Wanmun cultivars, Lole grafted onto Wanmun and Wanmun grafted onto Lole grown on 30 and 80% soil field capacity at the fifth month of planting.
Source Type III Sum of Squares df Mean Square F P(H0)
Corrected Model 1707323.90 7 243903.41 300.79 .000
Intercept 11968360.00 1 11968360.00 14759.75 .000
Water levels 1682230.23 1 1682230.23 2074.58 .000
Cultivars 24349.25 3 8116.42 10.00 .000
Water levels * Cultivars 744.43 3 248.14 .30 .821
Error 25948.10 32 810.88
Total 13701632.00 40
Corrected Total 1733272.00 39 a R Squared = .985 (Adjusted R Squared = .982). Table A5: 37 Analysis variance of water use efficiency of tuber of Lole and Wanmun cultivars, Lole grafted onto Wanmun and Wanmun grafted onto Lole grown on 30 and 80% soil field capacity at harvest time.
Source Type III Sum of Squares df Mean Square F P(H0)
Corrected Model 8.051 7 1.155 6.912 .000
Intercept 438.706 1 438.706 2636.514 .000
Water levels 1.394 1 1.394 8.378 .007
Cultivars 5.030 3 1.677 10.077 .000
Water levels * Cultivars 1.627 3 .542 3.259 .034
Error 5.325 32 .166
Total 452.082 40
Corrected Total 13.376 39 a R Squared = .602(Adjusted R Squared = .515).
355

Table A5: 38 Means of the daily transpiration of Lole and Wanmun cultivars as affected of soil water regimes (30 and 80% soil field capacity) and potassium levels (K16, K80, and K160).
Daily transpiration (g/day/plant)
WUE (g/kg of H2O)
Water levels 1st
month 2nd
month 3rd
month 4th
month 5th
month 30% 202.06b 281.48b 355.32b 356.83b 341.93b 3.50a 80% 476.44a 740.55a 710.97a 718.89a 752.08a 3.13b
Cultivars Lole 337.06b 490.40b 520.36b 526.81c 523.30b 3.46a Wanmun 373.93a 534.45a 553.89a 558.83a 580.10a 3.58a L-W 321.63c 497.95b 515.33b 519.90c 523.15b 3.51a W-L 324.36c 521.25a 543.00a 545.89b 561.45a 2.70b
Cultivar*Water Lole*30% 200.54 269.80 344.38 354.14 323.40 3.72 Wanmun*30% 217.40 295.90 368.38 377.20 377.40 3.62 L-W*30% 201.58 273.20 341.74 342.32 316.90 3.99 W-L*30% 188.70 287.00 366.78 353.64 350.00 2.67 Lole*80% 473.58 711.00 696.34 699.48 723.20 3.21 Wanmun*80% 530.46 773.00 739.40 740.46 782.80 3.54 L-W*80% 441.68 722.70 688.92 697.48 729.40 3.02 W-L*80% 460.02 755.50 719.22 738.14 772.90 2.73
Values within a column followed by the same letter symbol are not significantly different (p<0.05). All the interactions are significant (p<0.05).
356