
© Crown copyright Met Office From the global to the km-scale: Recent progress with the integration...
24
© Crown copyright Met Office From the global to the km- scale: Recent progress with the integration of new verification methods into operations Marion Mittermaier with contributions from Rachel North and Randy Bullock (NCAR)
-
Upload
kristina-lynne-kennedy -
Category
Documents
-
view
213 -
download
0
Transcript of © Crown copyright Met Office From the global to the km-scale: Recent progress with the integration...

© Crown copyright Met Office
From the global to the km-scale:Recent progress with the integration of new verification methods into operations
Marion Mittermaierwith contributions from Rachel North and Randy Bullock (NCAR)
© Crown copyright Met Office
Outline
1. Using feature-based verification for global model evaluation during trialling
2. Implementation of the HiRA framework for km-scale NWP

© Crown copyright Met Office
Synoptic evolution:Feature-based assessment of global model forecasts
with Rachel North

© Crown copyright Met Office
Forecast evolution ….
… determined by features and how features affect one another…
© Crown copyright Met Office
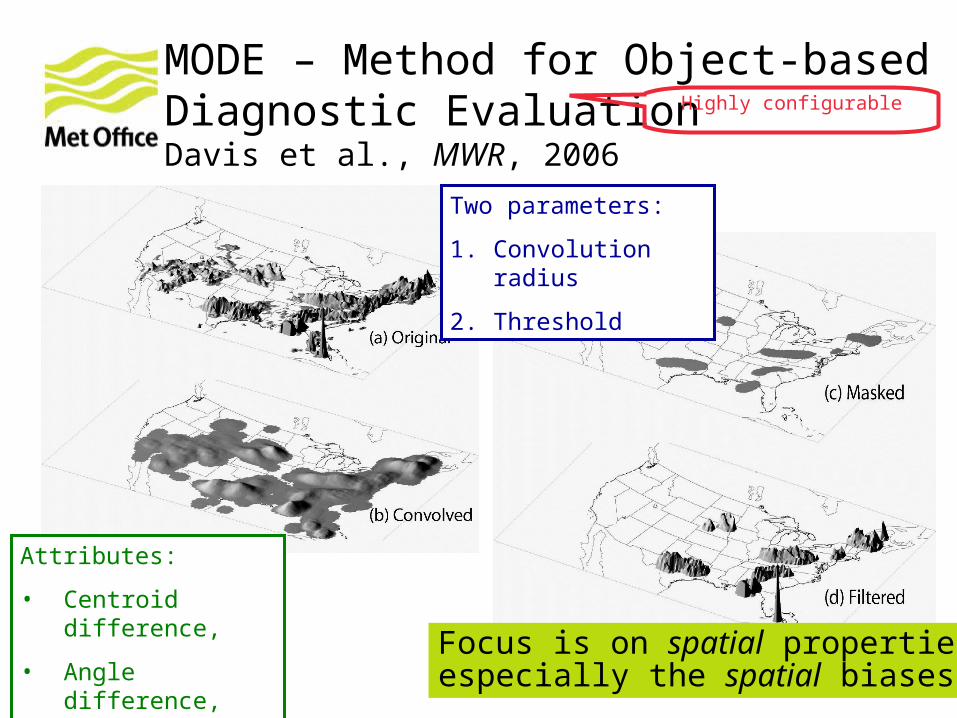
MODE – Method for Object-based Diagnostic EvaluationDavis et al., MWR, 2006
Two parameters:
1. Convolution radius
2. Threshold
Highly configurable
Attributes:
• Centroid difference,
• Angle difference,
• Area ratio etc
Focus is on spatial properties,especially the spatial biases

© Crown copyright Met Office
Setting the scene
• Comparing the previous operational dynamical core (New Dynamics) to the now operational dynamical core (ENDgame) (as of 15 July 2014)
• Baseline GA3.1 ND (25 km) for NWP (this was the operational GM version)
• Assessment of GA 5.0#99.13 N512 EG (25 km) and N768 (17 km) NH winter and NH summer trials.
• Comparison to an independent ECMWF analysis:• N512 ND with N768 EG (current and future operational configurations)• N512 EG with N512 ND (impact of changed dynamical core at the same
resolution)
• Considering:• 250 hPa jet cores, • mslp lows and • mslp highs.

© Crown copyright Met Office
GA3.1
Temporal evolution
• Older N320 trial 250 hPa winds > 60 m/s at forecast lead time of t+96h from the 12Z initialisation compared to EC analyses
• Differences in the size of forecast and analysed objects is not overshadowed by growth of synoptic forecast error, i.e. still able to find matches.

© Crown copyright Met Office
Foci for ENDgame assessment
• Spatial biases – extent of features• Changes in intensity – deeper, stronger, higher
etc• Changes in the number of analysed and
forecast objects – hits, false alarms, misses• Changes in the attribute distributions – are the
forecast attribute distributions closer to perfection?
© Crown copyright Met Office
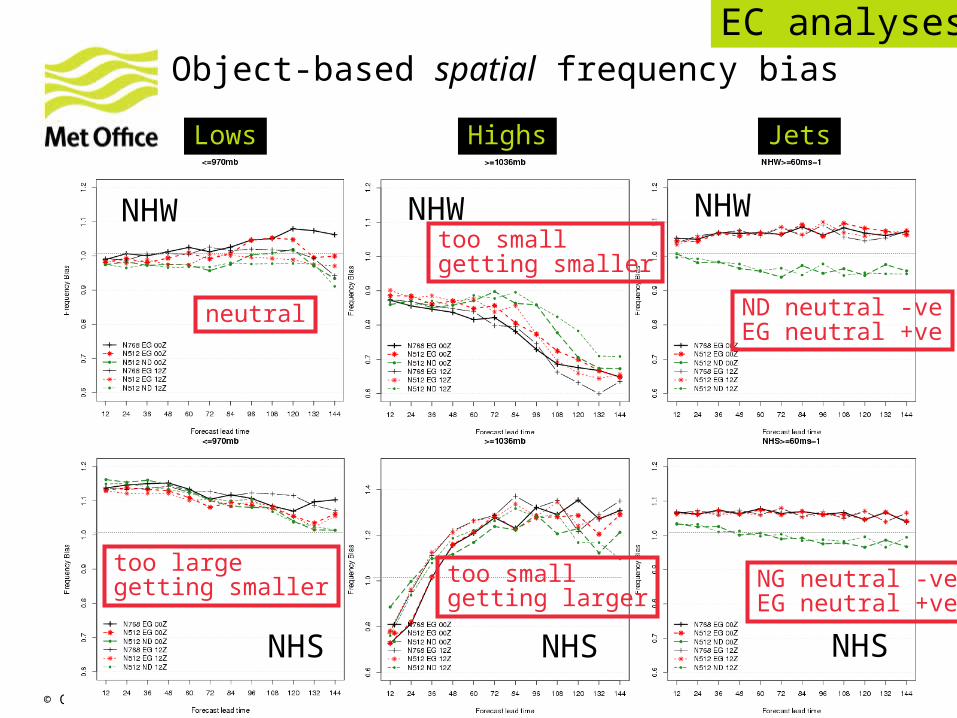
Object-based spatial frequency bias
NHW NHW
NHS NHS
EC analyses
too largegetting smaller
neutral
Lows Highs Jets
too smallgetting larger
too smallgetting smaller
ND neutral -veEG neutral +ve
NHW
NHS
NG neutral -veEG neutral +ve

© Crown copyright Met Office
Object intensitiesEC analysesN768 EG v N512 ND
• Do not look at absolute min/max values in objects. Use the 10th or 90th percentile as a more reliable estimate of how the intensity distribution has shifted/changed.
• Lows are deeper, highs and jets are stronger sharper gradients and a more active energetic model.
• Differences in the 00Z and 12Z analyses.
10th percentile 90th percentile
EG deeper
Lows Highs Jets
90th percentile
EG stronger EG stronger

© Crown copyright Met Office
JetsHighsLows
Number of objects
• Lows EG more matched objects Some increase in false alarms with
fewer misses Larger matched and unmatched areas
• Highs
EG more matched objects Substantially more false alarms at early
lead times with misses steady; impact of diurnal pressure bias
Area of matched objects improved at later lead times
• Jets EG more matched objects Substantial increase in false alarms
with comparable misses Modest increase in matched areas, but
substantial increase in unmatched area
EC analyses

© Crown copyright Met Office
Distribution Difference Skill Score
• DDSS of attribute A is:
• F and G are the binned test and control distributions (m bins)
• H is the perfect distribution of attribute A (Heaviside)
• Measures the relative improvement in the distribution of an attribute compared to perfect attribute distribution.
• We know what the perfect attribution looks like.
m
kktestkperf
m
kkctrlktest
AGAH
AGAFDDSS
1,,
1,,
])()([
])()([
e.g. limited area ratio,intersection-over-union ratio
e.g. centroid difference,angle difference
EC analyses

© Crown copyright Met Office
Distribution Difference Skill Score
Lows Highs Jets
Lows Highs JetsPosition error Overlap
ExtentPosition error
Position error
Rotation error
EG better
N768 better
N768 betterEG better
Mixed
Mixed
EC analyses

© Crown copyright Met Office
Tropical depressions below 1005 mbOver two trials, June-Aug 2012, Oct-Nov 2012
CIs depend on attribute but are often very wide. Noisy. Verdict: sample size probably an issue in some cases.
EC analyses

© Crown copyright Met Office
Conclusions
• Lows deeper and often larger in extent • Highs are too intense and too small – tightening of pressure
gradients.• Jets stronger and slightly too large (too small before). Generally
shows as too strong w.r.t. verifying analysis.• Significant shifts in frequency bias (i.t.o. spatial extent) with a
negative impact on false alarm rate. • Compelling seasonal differences in the Northern Hemisphere
which may have to do with the land-atmosphere boundary.• Pressure biases in the analyses can be very influential for any
threshold-based method.

© Crown copyright Met Office
Conclusions (cont’d)
• Analysis has added a new dimension to the traditional root-mean-square method of assessing global NWP performance.
• The features that drive our synoptic weather patterns are linked and analysing them as such provides potentially useful information for understanding and resolving model deficiencies.
• Feature-based output is also a lot closer to the way in which forecasters (meteorologists) use and interpret model output on a daily basis and should provide more meaningful objective guidance for forecasting applications.

© Crown copyright Met Office© Crown copyright Met Office
The High Resolution Assessment framework: Comparing ensemble and deterministic performance

© Crown copyright Met Office
Low
Small uncertainty at large scales = large uncertainty at small scales
5% error at 1000 km = 100% error at 50 km
Link to larger scale:Russell et al. 2008Hanley et al. 2011, 2012
Justifies the use of a downscaling ensemble (MOGREPS-UK)

© Crown copyright Met Office
3 x 3
Spatial sampling
7 x 717 x 17
Only ~130 1.5 km grid points in >500 000 domain used to assess entire forecast!Note the variability in the neighbourhoods.
• Represents a fundamental departure from our current verification system strategy where the emphasis is on extracting the nearest GP or bilinear interpolation to get matched forecast-ob pair.
• Make use of spatial verification methods which compare single observations to a forecast neighbourhood around the observation location. SO-NF
Forecast neighbourhood
Observation
x
NOT upscaling/smoothing!

© Crown copyright Met Office
High Resolution Assessment (HiRA) framework
• Use standard synoptic observations and a range of neighbourhood sizes
• Use 24h persisted observations as reference
• The method needs to be able to compare: Deterministic vs deterministic
(different resolutions, and test vs control of the same resolution)
Deterministic vs EPS EPS vs EPS
Test whether differences are statistically significant (Wilcoxon) [“s” denotes significant at 5%]
Grid scale calculated for reference NOT main focus.
Mittermaier 2014, WAF.
Variable Old New
Temp RMSESS CRPSS
Vector wind (wind
speed)RMSVESS RPSS
Cloud cover ETS BSS
CBH ETS BSS
Visibility ETS BSS
1h precip ETS BSS
RMS(V)ESS = Root Mean Square (Vector) Error Skill ScoreETS = Equitable Threat ScoreBSS = Brier Skill ScoreRPSS = Ranked Probability Skill ScoreCRPSS = Continuous Ranked Probability Skill ScoreMAE = Mean Absolute ErrorPC = Proportion Correct
MAE
MAE
PC
PC
PC
PC
@ grid scaleReady for operational trialling Jan 2015

© Crown copyright Met Office
Deterministic vs EPS
1st 5 weeks of 03Z MOGREPS-UK
+ve = MOGREPS-UK ensemble better“none” = 12 nearest GP values MOGREPS-UK vs 1 nearest GP UKV
MOGREPS-UK @ 2.2 kmUKV @ 1.5 km
Benefit of ensemble
Need neighbourhood for convective
precip
neighbourhood greater benefit
for UKV

© Crown copyright Met Office
Skill against persistence
MOGREPS-UK @ 2.2 kmUKV @ 1.5 km

© Crown copyright Met Office
Conclusions
• New verification framework illustrates benefit of km-scale ensemble over deterministic.
• Bigger neighbourhoods will improve forecast skill (for the most part) but the UKV needs (and benefits more from) neighbourhood processing, i.e. better “harvesting” of information content.
• The ensemble is more reliable to begin with and requires a smaller neighbourhood to achieve reliability.
• There is a trade-off between resolution and reliability as a function of neighbourhood size, and therefore simple neighbourhood processing for the ensemble is possibly not optimal.

© Crown copyright Met Office
Questions?Mittermaier MP, 2014: A strategy for verifying near-convection-resolving forecasts at observing sites. Wea. Forecasting. 29(2), 185-204.
Mittermaier M.P., 2014: Quantifying the difference in MODE object attribute distributions for comparing different NWP configurations. In internal review.
Mittermaier M.P., R. North and A. Semple, 2014: Feature-based diagnostic assessment of global NWP forecasts, in preparation for QJRMS.