,. CROATICA CHE'MICA ACTA 38 (1966) 229
6
CCA-4SO ,. CROATICA CHE'MICA ACTA 38 (1966) 229· 661.666 :548.4 :548.73 Note Crystallite Size and Lattice Distortion Determination of Graphite s. Popovic Institute »Ruder Boskovic «, Zagreb , Croatia, Yugoslavia ,Rec eived April 11, 1966 A graphite sample was prepared by heating chemically purified petro- leum coke powder to 30oo 0 c in an argon atmosphere and its structural -characteristics were determined by various X-ray diffraction methods 1 -s. The validity of the values obtained for the crystallite size and the lattice distortion proportion is discussed. EXPERIMENTAL X-ray diffraction line profiles were recorded using a Philips diffractometer fitted with a scintillation counter and a single-channel pulse-height analyser. In order to eliminate the instrumental broadening, a method of mixing the sample under examination with a standard was used 1 • As standard germanium powder was selected for two reasons: 1) The germa- nium lines a re located close to the graphite lines, and equality of the instrumental functions for two neighbouring lines of both samples can be assumed; 2) Ger- manium powder was prepared from a single crystal of high purity and very regular crystal lattice. In addition to the fact that the electrical resistivity of the germanium single -crystal used (40 Q cm.) was almost equal to the intrinsic value (47 Q cm.), the above conclusion was confirmed from our measurements of the unit cell dimension• and line breadths. The fraction of germanium powder from 300 to 325 mesh gave lines narrower than those of a series of other substances we intended to use as standards. In order to avoid the additional backgrbund produced by germanium and gum tragacanth binder and to record low intensity lines, we attempted to find a standard whose absorption coefficient was equal to that of the sample examined; it would thus be possible to take the patterns of graphite and a standard separately under the same experimental conditions. Diffraction lines of our germanium powder were about 150/o narrower than the line's of natural Ceylon graphite. We intended to use natural graphite as a standard because of the equal absorption coefficients of this and the examined sample. In order to increase the crys tallinity and remove the impurities, Ceylon graphite was chemically treated (with hydrofluoric acid) and heated (to 3000°C) in an argon atmosphere . Such treatment produced a decrea se in the interlayer spacing by 0.0015 A and an increase in the angular separation of the (100) and (101) lines. The doublet resolution of the (004) and (006) lines was more pronounced for the treated sample. However, the lines of the treated Ceylon graphite were about 10°/o wi der than those of germanium. Figures 1, 2 and 3 show the graphite (002), (004) and (110) lines with closely located germanium lines. The profiles of the (002)K (002)K a and (004)K a lines were corrected - for the instrumental broadening by Stokes' method 2 , using the strips of Lipson and Beevers 7 and by (iividing t he angular range of the lines into 60 intervals. Pure diffraction profiles, obtained by Stokes' method , were almost symmetrical :in relation to the maximum intensity.
Transcript of ,. CROATICA CHE'MICA ACTA 38 (1966) 229
CCA-4SO
,. CROATICA CHE'MICA ACTA 38 (1966) 229·
661.666 :548.4 :548.73 Note
Crystallite Size and Lattice Distortion Determination of Graphite
s. Popovic
Institute »Ruder Boskovic«, Zagreb, Croatia, Yugoslavia
,Received April 11, 1966
A graphite sample was prepared by heating chemically purified petro
leum coke powder to 30oo0c in an argon atmosphere and its structural
-characteristics were determined by various X-ray diffraction methods1-s. The
validity of the values obtained for the crystallite size and the lattice distortion
proportion is discussed.
EXPERIMENTAL
X-ray diffraction line profiles were recorded using a Philips diffractometer fitted with a scintillation counter and a single-channel pulse-height analyser. In order to eliminate the instrumental broadening, a method of mixing the sample under examination with a standard was used1•
As standard germanium powder was selected for two reasons: 1) The germanium lines are located close to the graphite lines, and equality of the instrumental functions for two neighbouring lines of both samples can be assumed; 2) Germanium powder was prepared from a single crystal of high purity and very regular crystal lattice.
In addition to the fact that the electrical resistivity of the germanium single -crystal used (40 Q cm.) was almost equal to the intrinsic value (47 Q cm.), the above conclusion was confirmed from our measurements of the unit cell dimension• and line breadths. The fraction of germanium powder from 300 to 325 mesh gave lines narrower than those of a series of other substances we intended to use as standards.
In order to avoid the additional backgrbund produced by germanium and gum tragacanth binder and to record low intensity lines, we attempted to find a standard whose absorption coefficient was equal to that of the sample examined; it would thus be possible to take the patterns of graphite and a standard separately under the same experimental conditions. Diffraction lines of our germanium powder were about 150/o narrower than the line's of natural Ceylon graphite. We intended to use natural graphite as a standard because of the equal absorption coefficients of this and the examined sample. In order to increase the crystallinity and remove the impurities, Ceylon graphite was chemically treated (with hydrofluoric acid) and heated (to 3000°C) in an argon atmosphere. Such treatment produced a decrease in the interlayer spacing by 0.0015 A and an increase in the angular separation of the (100) and (101) lines. The doublet resolution of the (004) and (006) lines was more pronounced for the treated sample. However, the lines of the treated Ceylon graphite were about 10°/o wider than those of germanium.
Figures 1, 2 and 3 show the graphite (002), (004) and (110) lines with closely located germanium lines. The profiles of the (002)K ~. (002)K a and (004)K a lines were corrected -for the instrumental broadening by Stokes' method2, using the strips of Lipson and Beevers7 and by (iividing t he angular range of the lines into 60 intervals. Pure diffraction profiles, obtained by Stokes' method, were almost symmetrical :in relation to the maximum intensity.
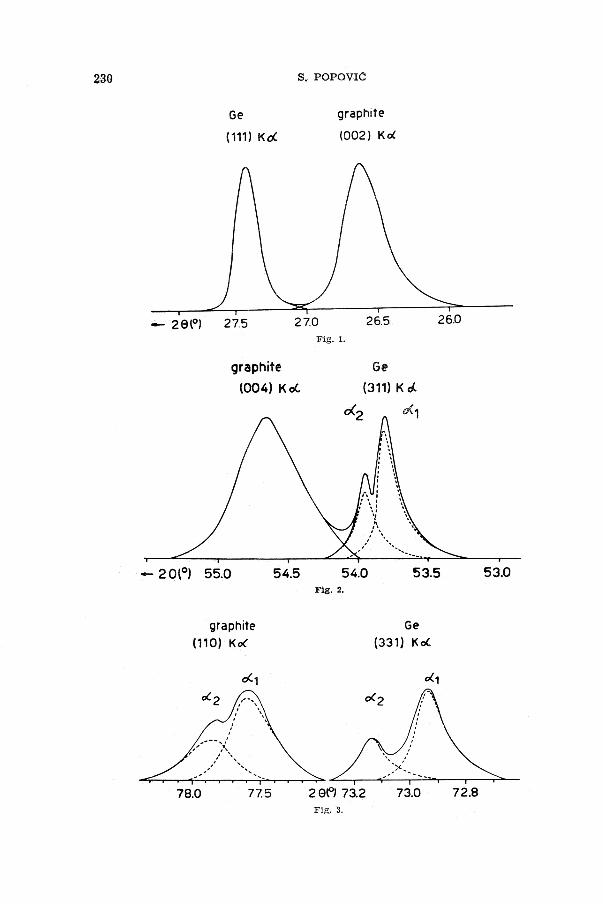
2~0 S. POPOVIC
Ge graphite
(111) Ko( (002) Kd
........ 29\0 ) 27.5 27.0 26.5 26.D
graphite
(004) K rJ.
- 20l0) 55.0
graphite (110) Ko(
oe, "'2 ,.---, . ' . \
' . '
78.0 77.5
54.5
Fig. 1.
Ge (311) K 0..
o(2 c<1
54.0 Fig. 2.
2 9l°J 73.2 Fig. 3.
53.5
Ge (331) Ko(
o<'.1
73.0 72.8
53.0

CRYSTALLITE SIZE AND LATTICE DISTORTION 231
RESULTS Ar:m . DISCUSSION
a) Crystallite siz e and lattice distortion
Pure diffraction breadths (the angular width where the intensity is half
its maximum value, B112, vr the integral breadth, Bi), determined both by
Alexander's procetj.ure5 and _by Stokes' method2, are given in Table I.
The crystallite dimensions L (L = Dhko ) and H (H = D 001) w ere evaluated
by means of Scherrer's equations5, neglecting the broadening caused by the
lattice distortion. Because of the presence of the lattice distortion, true crystal
lite dimensions are certainly greater than those given in Table I.
TABLE I
Alexander's method Stokes' method I line
I Dhkz (J\) I I D !tk1 (J\) ~(O) ' ~(O)
I I
~ 1h = 0.145
I H = 500
I I (002)K~ ~ % = 0.165 H = 440 ~i = 0.166 H = 490
I ~ % = 0.163
I H = 497
I I (002)Ka ~ % = 0.180 H = 450
~i = 0.184 H = 494
I ~ % = 0.390
I H = 228
I I (004)Ka ~ Vo = 0.405 H = 218
~i = 0.422 H = 235
I
~ % = 0.167
I
L = 605
I
I (llO)Ka
~i = 0.180 L = 630 I
As seen from Table I, the value of H, derived from the (004) line, is
about half those obtained from the (002)KB and (002)Ka lines. This can be
explained only by the presence of the lattice distortion: the proportion of
lattice distortion broadening increases with the reflection order l.
The values of the line breadths obtained by Alexander's procedure are
smaller than those obtained by Stokes' method. One can conclude that pure
diffraction profiles cannot be described by (1 + k 2 s2)-1, which is assumed in
Alexander's procedure (c is the angular deviation from the true Bragg
angle 6l). The pure diffraction profile is the convolution of the crystallite size
profile, p(c), and the lattice distortion profile, s(s). If Bip and Bis are the integral
breadths of the profiles p(c) and s(c) respectively, the resultant integral breadth
will be1
~i = S p(E) s(t: )dt: (1}
In order to determine the relationship between f:li, Bip and Bis in explicit
form, one must assume an analytical expression for the functions p(c) and
s(s)B,9. Such an assumption, however, affects the final result of the separation
of line broadening effects.
In the case when the lattice distortion may be characterized by some
proportion of disoriented layers10, one can suppose that11

232 S . POPOVIC
IS c Bis= 2 - tg e
c (2)
where c is the lattice constant corresponding to the reflection (OOl). In order IS c
to find H and - , one must have at least two orders of reflection (OOl) . c For our sample we can use the (002) and (004) lines.
If we assume that the forms of the profiles p(c) and s(c) are8
(3)
from equation (1) we obtain the following relationship between the integral breadths:
(4)
Using two equations (4), for two reflections, we obtained the following 6. c
values for H and - : c
H = -5200.A ~ = 0,007 c
The negative value obtained for H indicates the non validity of assumption (3) . If we assume thatD
p(c) = (1 + k i c2) -1
it follows from equation (1) that
. 2 s(c) = (1 + k 2 e?)-!
Bi = <Bip + 2 Bis)2
Bip + 4 Bis Solving two equations (6), for two reflections, we obtained:
H = 530 A IS c = 0.0012 c
(5)
(6)
The validity of the above values will be discussed together with the results obtained by the method of Warren and Averbach.
The Fourier coefficients of the (002)KB, (002)Ka and (004)Ka lines were determined by Stokes' method. By plotting the coefficients of these lines against the harmonics of the Fourier series3 we obtained curves, the initial slopes of which gave the following values of H for our sample:
H coo2)Ktl = 574 A. H (002)Ka = 565 A H (004)Ka = 560 A
Thus, using the m ethod of Warren and Averbach, we obtained almost the same values for H from the (002) and (004) lines, differing from the results obtained by a simple application of Scherrer's equations5• We can conclude that one must take into account the distortion broadening, if the examined samples are less perfectly crystallized graphites.

CRYSTALLITE SIZE AND . LATTICE DISTORTION 233
Using the Fourier coefficientss for the (002) and (004) lines we obtained
tic . the value 0.003 for -
c
8c The above results for H and - , obtained by the method of Warren
c and Averbach, are similiar to those obtained using assumption (5). It is noti-
cable that the value 6.. c . = 0.0012 is too small in relation to that obtained c
by the method of Warren and Averbach. The definition (2) for Bis is evidently not quite correct, and just that definition substantially affects the numerical
values of 8
c which we get from (6) . c
We can conclude that the derivation of the pure diffraction profile ·by Stokes' method, and the interpretation of the Fourier coefficients according to Warren and Averbach, is undoubtedly the most adequate method for the determination of the structural characteristics of polycrystalline materials.
b) Proportion of disoriented layers
By an approximate treatment of the case of random errors in layer stacking, Wilson12 deduced the following equation
(7)
which gives · the integral line breadth of the (hkl) reflection in terms of p, the probability of an error of stacking between successive planes. If we intend to detect low intensity (110), (101), (112) and (114) lines with sufficient accuracy, we cannot use the mixture method. In order to avoid the additional background, we used graphite specimens without standard. The line profiles of these samples were corrected for absorption by extrapolation to zero thickness of the specimen13• The influences of other instrumental functions were eliminated by Stokes' m ethod using separately recorded n early located lines of germanium. As the linear absorption coefficient of germanium is about thirty times greater than that of graphite, one can suppose that the X-rays were diffracted only at the surface of the germanium powder.
We applied Wilson's formula (7) to the integral breadths of the (110) , (112) and (114) lines (obtained by the above method) and obtained the value 0.23 fo r the proportion of disoriented layers. This result is in good agreement with the value 0.26 deduced from Bacon's equation14 for the mean interlayer spacing.
REFERENCES
1. F. W. Jones, Proc. Roy. Soc . Al66 (1938) 16. 2. A. R. S to k es, Proc. Phys. Soc. (London) 61 (1948) 382. 3. B. E. Warren and B . L. Aver b a ch, J . Appl. Phys. 21 (1950) 595, ibid. 23 (1952)
497 and 1059. 4. L. A 1 ex and er, J . Appl. Phys. 25 (1954) 155. 5. M. P . K 1 u g and L. A 1 ex an d er, X-Ra y Diffraction Procedures, John Wiley
and Sons, Inc., New York, 1954, pp. 491-538.

234 S. POPOVIC
6. S. Popovic, II Jugoslqvenski simpozij o reaktorskim materijalima, Herceg"Novi 1965 (2nd Yugoslav Symposium on Reactor Materials, Herceg-Novi, 1965).
7. H. Lipson and C. A. Beevers, Proc. Phys. Soc. (London) 48 (1936) 772, 8. W. H a 11, Proc. Phys. Soc. (London) 62 (1949) 741. 9. L. I. Lis a k, Sb. trudov Lab. metallofiz An SSSR, Voprosi fiziki materialov
i metallovedenija, No. 5 (1954) 45. 10. G. F. Bacon, Industrial Carbon and Graphite, London, 1959, p. 183. 11. L. S. Z e vi n i D. M. He j k er, Rentgenovskie metodi issledov anija stroiteljnih.
materialov, Strojizdat, Moskva, 1965. 12. A. J. C. W i 1 son, X-Ray Optics, Methuen and Co., London, 1949. 13. S. Po po vi c, Croat. Chem. Acta 38 (1966) 91. 14. G. E. Bacon, Acta Cryst. 4 (1951) 558.
IZVOD
Odredivanje velicine kristalita i distorzije kristalne resetke grafita
s. Popovic
Profili rendgenskih difrakcionih linija grafitiziranog petrolkoksa snimani su. difraktometrom sa scintilacionim brojacem i jednokanalnim amplitudnim diskriminatorom. Korigiranje profila linija zbog instrumentalnog prosirenja vrseno je Stokesovom metodom i Alexanderovim postupkom uz koriStenje blizu polozenih linija praska germaniuma (visoke cistoce i veoma pravilne kristalne resetke). Velicina kristalita i distorzija resetke odredena je metodom Warrena .i Averbacha. Potvrdeno je· da je ta metoda adekvatnija od drugih postupaka, kod kojih se profili linija opisuju analitickim funkcijama.
U cilju smanjenja suma i registriranja slabo intenzivnih linija (101), (112) i (114), koriSteni su uzorci grafita bez standardne tvari. Korigiranje profila zbog apsorpcije izvrseno je ekstrapolacijom na debljinu uzorka jednaku nuli. Ciste difrakcione sirine tih linija sluze za odredivanje udjela neorijentiranih slojeva.
INSTITUT ~RUDER BOSKOVIC« ZAGREB Primljeno 11. travnja 198'.