© Copyright 2005 David Rosete. All rights reserved1 A Leaders Edge – What Attributes Make an...
17
© Copyright 2005 David Rosete. All righ ts reserved 1 A Leaders Edge – What Attributes Make an Effective Leader? 5 th Annual Emotional Intelligence Conference, Netherlands, June 2005 David Rosete BA(Hons), MPsychol(Org), Organisational Psychologist PhD scholar within the Department of Psychology
-
date post
20-Dec-2015 -
Category
Documents
-
view
214 -
download
0
Transcript of © Copyright 2005 David Rosete. All rights reserved1 A Leaders Edge – What Attributes Make an...
© Copyright 2005 David Rosete. All rights reserved 1
A Leaders Edge – What Attributes Make an Effective Leader?
5th Annual Emotional Intelligence Conference, Netherlands, June 2005
David Rosete BA(Hons), MPsychol(Org), Organisational Psychologist
PhD scholar within the Department of Psychology

© Copyright 2005 David Rosete. All rights reserved 2
Are good leaders more emotionally intelligent?
EI and Leadership While there has been speculation regarding the
relationship between EI and leadership effectiveness, this has generally not been based upon empirical research and has failed to accurately measure effective leadership.
The transformational/transactional leadership model of Bass and Avolio (1995) has provided the general framework for most of the assertions made about the link between emotional intelligence and leadership effectiveness.
While research based on self-reported managerial style is important, research is still needed to evaluate whether an ability-based test of EI or self-report measure of EI is related to relatively objective (or non-self-report) measures of leadership effectiveness such as supervisor ratings or measures of actual business unit performance.
Lopes, Côté, Grewal, Kadis, Gall and Salovey (2003) Rosete and Ciarrochi (2004)

© Copyright 2005 David Rosete. All rights reserved 3
Present Study and Hypotheses
This study sought to address two major questions. First, to what extent are self-reported and
performance based measures of EI related to leadership performance?
Second, to what extent do the EI measures predict variance in performance over and above that accounted for by traditional personality and reasoning measures?

© Copyright 2005 David Rosete. All rights reserved 4
Participants
The initial sample consisted of 122 executives from a large Australian Public Service organisation.
Executives who did not complete the main battery of measures or whose performance ratings were not accessible were then excluded leaving a final sample of 117 executives.
The main sample also consisted of both assistant directors (n = 64) and directors (n = 52) with 1 unreported.
56 (48.28%) of respondents were male, and 60 (51.72%) female with 1 unreported.
Participant ages ranged from 27 – 60 years, and the average age was 40.54 years (S.D. = 8.95).
The mean tenure within the organisation was approximately 15 years.
The level of qualifications amongst the sample was quite impressive with approximately 32% reported to have completed a masters degree or higher; 22% reported to have completed a postgraduate diploma or certificate; 33% reported to have completed an undergraduate degree and 4% reported to have completed some form of associate diploma or certificate.

© Copyright 2005 David Rosete. All rights reserved 5
Procedure
Participants were administered a battery of psychological tests (i.e., 16PF, MSCEIT, and SUEIT).
All participants were provided with information regarding the instruments, consent forms, a copy of the 16PF, and a copy of the SUEIT.
In exchange for their participation, individuals were provided with a confidential feedback report on their results on each of the instruments.

© Copyright 2005 David Rosete. All rights reserved 6
Emotional Intelligence via the MSCEIT Mayer-Salovey-Caruso Emotional Intelligence Test
(MSCEIT © 2002, Multi-Health Systems Inc). It contains 141 items which are broken down into eight tasks,
which are further divided into four branches of abilities including (a) perceiving emotion, (b) using emotion to facilitate thought, (c) understanding emotion, and (d) managing emotions.
The coefficient alphas were perceiving emotion (r = .76); using emotion to facilitate thought (r = .70); understanding emotion (r = .78); managing emotion (r = .75) and an overall reliability of r = .67.
MSCEIT TOTAL
EXPERIENTIAL STRATEGIC
Understanding ManagingPerceiving Facilitating
Faces
Pictures
Sensations
Facilitation
Blends
Changes
Emotion Management
Emotional Relations

© Copyright 2005 David Rosete. All rights reserved 7
Emotional Intelligence via the SUEIT
The SUEIT is a self-report measure consisting of 65 items. Each item asks participants to indicate the extent to which a particular statement is true of the way they typically think, feel and act at work (on a five-point scale: 1 = never, 2 = seldom, 3 = sometimes, 4 = usually, 5 = always).
The SUEIT report provides an overall EI score that indicates a participant’s general workplace EI, and five sub-scale scores including (1) emotional recognition and expression (in oneself); (2) emotions direct cognition; (3) understanding of emotions external; (4) emotional management; and (5) emotional control.
The coefficient alphas for the five sub-scales were: ER&C (r = .74); EDC (r = .78); UEE (r = .69); EM (r = .73) and EC (r = .76) with an overall reliability of r = .72 for the SUEIT EI.
The SUEIT was developed after an extensive factor analytic study involving five of the predominant measures of EI.
Four of these were other self-report measures of EI including: Bar-On Emotional Quotient Inventory (Bar-On, 1997) Trait Meta-Mood Scale (Salovey et al., 1995) Toronto Alexithymia Scale-II (TAS-20; Bagby, Taylor & Parker, 1994) Emotional Intelligence Scale (Schutte et al 1998)

© Copyright 2005 David Rosete. All rights reserved 8
Measuring Personality via the 16PF
16PF5 185 items. 16 Primary personality factors.
Impression Management (IM) index. Each scale contains 10 to 15 items. Administered individually or in a group by
hand (35 – 50 minutes) or by computer (25 – 35 minutes)
Readability is at the fifth-grade level.

© Copyright 2005 David Rosete. All rights reserved 9
Measuring Cognitive Ability viaFactor B Reasoning
Factor B - Reasoning scale measures three areas of general reasoning ability, verbal, numerical, and logical reasoning in a 15-item scale.
The scale has an overall coefficient alpha of .80 and has been shown to correlate with other general ability measures such as the Information Inventory (r = .61) and the Culture Fair Intelligence Test (r = .51).
The scale itself was included in the personality measure as it is considered that reasoning ability is an important dimension of individual differences in personality.

© Copyright 2005 David Rosete. All rights reserved 10
Measuring Leadership Effectiveness
Annual Appraisal The annual appraisal is a formal feedback discussion between a
manager and an executive about work performance. The purpose of the annual appraisal is to review an executive’s
performance against their business plans, sometimes referred to as performance and development agreement (PDA).
There are two focuses placed on the annual appraisal: (1) “What” has been achieved, and (2) “How” has it been achieved.
Examples of the “What” focus include whether occupational health premiums been decreased, whether external charter standards been met, whether the specific area has delivered on key government initiatives, or whether tax revenue targets been achieved.
The “what” section is always expressed in terms of both deliverable and measurable objectives. While this section of the PDA is highly individualistic, the intent is always the same, namely, to establish if the executive officer is achieving organisational goals and objectives.
© Copyright 2005 David Rosete. All rights reserved 11
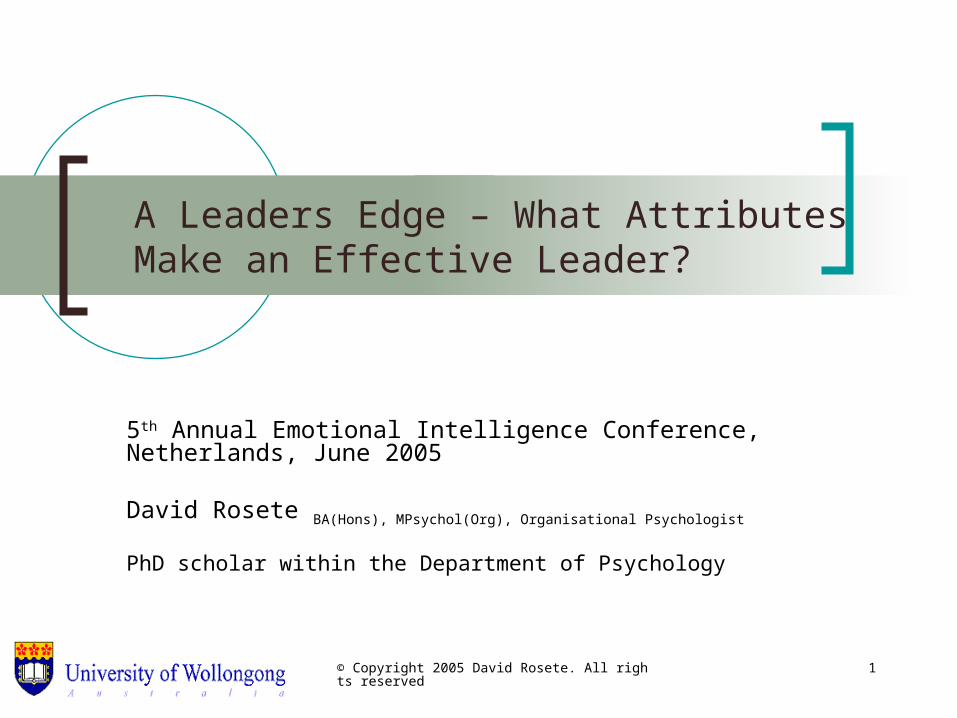
Measuring Leadership Effectiveness
The “How” focus of the PDA is on how the work and leadership behaviours were adopted to achieve business outputs.
A significant part of the “how” aspect is an individual’s ability to demonstrate core leadership behaviours as outlined by the Australian Public Service Commission (APSC) Leadership Capability Framework.

© Copyright 2005 David Rosete. All rights reserved 12
Measuring Leadership Effectiveness
M a n a g e r
E x e c u t iv e O ffi c e r
S p e c ifi c t a r g e t sb e e n m e t ?
I n d e p e n d e n t ly c o lle c t a n de v id e n c e
I n d e p e n d e n t ly c o lle c t a n de v id e n c e
P D A D is c u s s io n
R e v ie w o r ig in a l o b je c t iv e s & o u t c o m e s
R e v ie w e x e c u t iv e b e h a v io u r s a g a in s t le a d e r s h ip f r a m e w o r k
R e v ie w a n y le a r n in g & d e v e lo p m e n t p la n s
R e v ie we v id e n c e
A g r e e o n in t e r im ra t in g s
P e r f o r m a n c er a t in g s
W h a t & H o w
M a n a g e r -E m p lo y e e
C o r p o r a t e A s s u r a n c e C o m m it t e e D e p a r t m e n t s P e r f o r m a n c eA s s u r a n c e C o m m it t e e
F in a l R a t in g s
Feed
back
to
the
Exec
utiv
e O
ffice
r

© Copyright 2005 David Rosete. All rights reserved 13
Correlations Coefficients between the MSCEIT, SUEIT, and Reasoning Scales with Performance management Ratings
00.050.1
0.150.2
0.250.3
0.350.4
0.450.5
What How
ReasoningSUEIT EIMSCEIT**
** p < .01

© Copyright 2005 David Rosete. All rights reserved 14
Correlations Coefficients between Personality (Big Five) and Performance management Ratings
-0.2
-0.15
-0.1
-0.05
0
0.05
0.1
0.15
What How
ExtraversionAnxietyTough MindednessIndependenceSelf Control
© Copyright 2005 David Rosete. All rights reserved 15
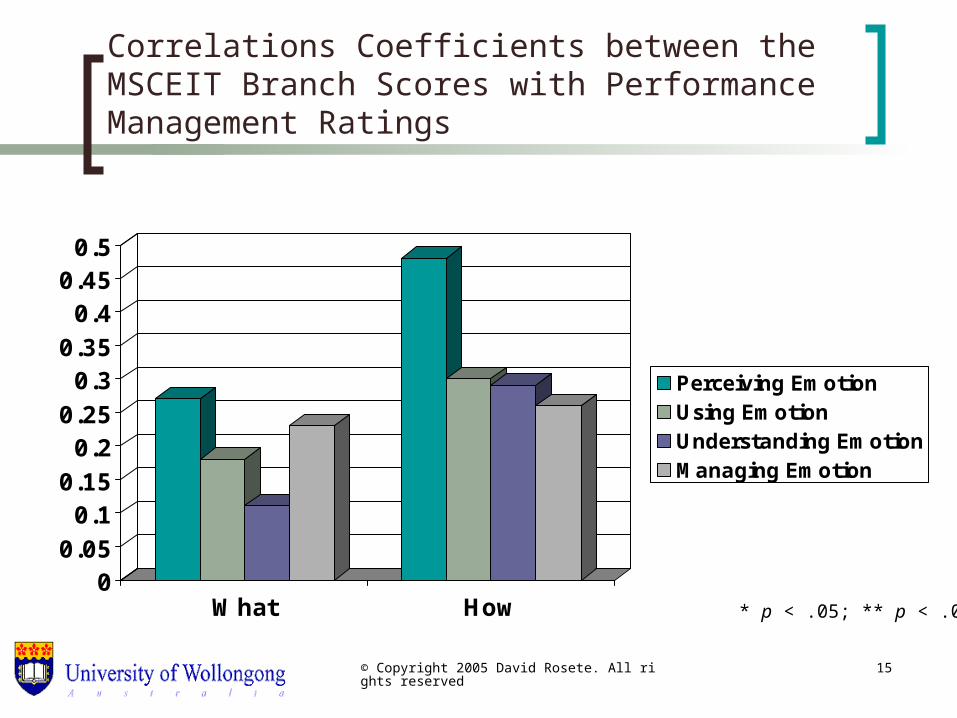
Correlations Coefficients between the MSCEIT Branch Scores with Performance Management Ratings
00.050.1
0.150.2
0.250.3
0.350.4
0.450.5
What How
Perceiving EmotionUsing EmotionUnderstanding EmotionManaging Emotion
* p < .05; ** p < .01
© Copyright 2005 David Rosete. All rights reserved 16
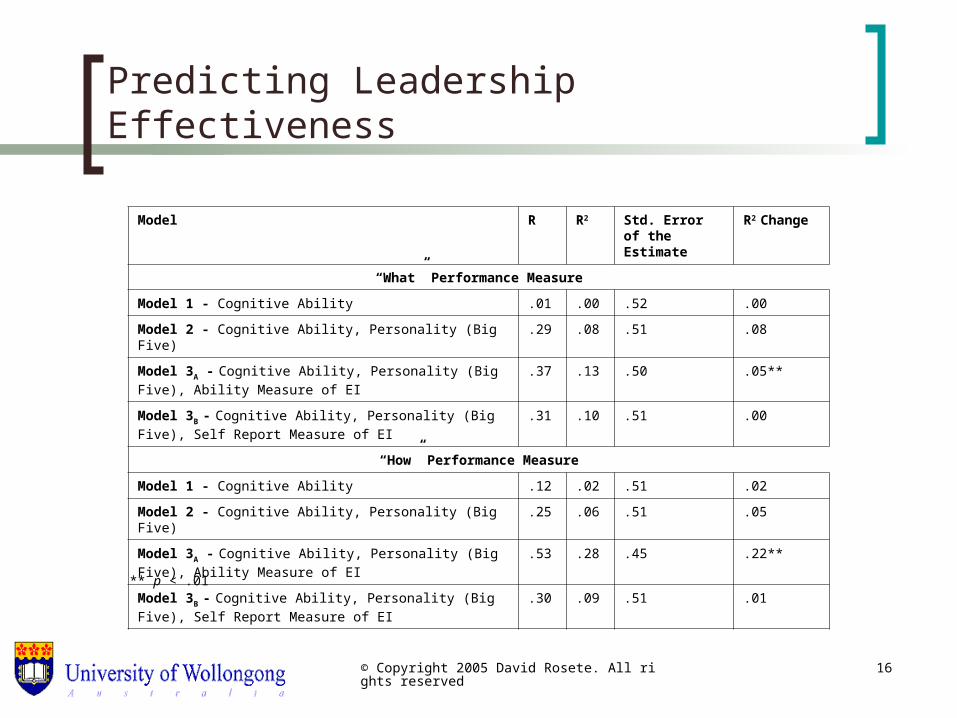
Predicting Leadership Effectiveness
Model R R2 Std. Error of the Estimate
R2 Change
“What” Performance Measure
Model 1 - Cognitive Ability .01 .00 .52 .00
Model 2 - Cognitive Ability, Personality (Big Five) .29 .08 .51 .08
Model 3A - Cognitive Ability, Personality (Big Five), Ability Measure of EI
.37 .13 .50 .05**
Model 3B - Cognitive Ability, Personality (Big Five), Self Report Measure of EI
.31 .10 .51 .00
“How” Performance Measure
Model 1 - Cognitive Ability .12 .02 .51 .02
Model 2 - Cognitive Ability, Personality (Big Five) .25 .06 .51 .05
Model 3A - Cognitive Ability, Personality (Big Five), Ability Measure of EI
.53 .28 .45 .22**
Model 3B - Cognitive Ability, Personality (Big Five), Self Report Measure of EI
.30 .09 .51 .01
** p < .01

© Copyright 2005 David Rosete. All rights reserved 17
Summary & Future Direction