© Confederation of Indian Industry CII – Sohrabji Godrej Green Business Centre, India “GHG...
23
© Confederation of Indian Industry CII – Sohrabji Godrej Green Business Centre, India “GHG Protocol” – India Experience
-
Upload
samson-crawford -
Category
Documents
-
view
237 -
download
0
Transcript of © Confederation of Indian Industry CII – Sohrabji Godrej Green Business Centre, India “GHG...
© Confederation of Indian Industry
CII – Sohrabji Godrej Green Business Centre, India
“GHG Protocol” – India Experience
© Confederation of Indian Industry
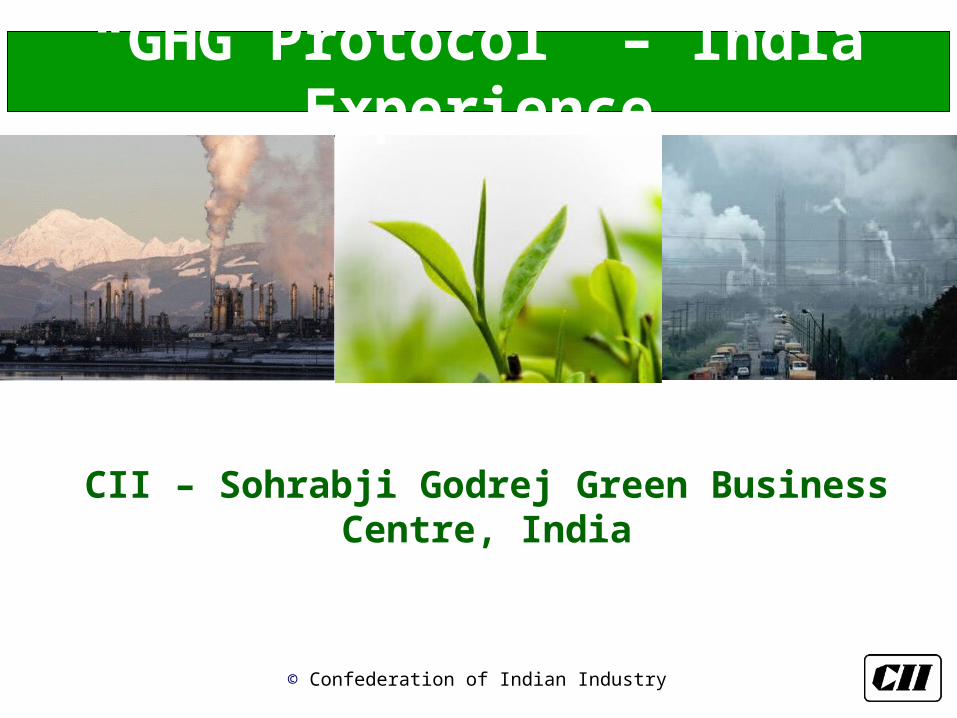
Centre of “Excellence” for Energy, Environment, Green Buildings, Renewable energy, Water & Climate change activities in India
CII – Sohrabji Godrej Green Business Centre, Hyderabad
A unique Public – Private Partnership ( CII, Govt of Andhra Pradesh, USAID and Pirojsha Godrej
Foundation )
© Confederation of Indian Industry
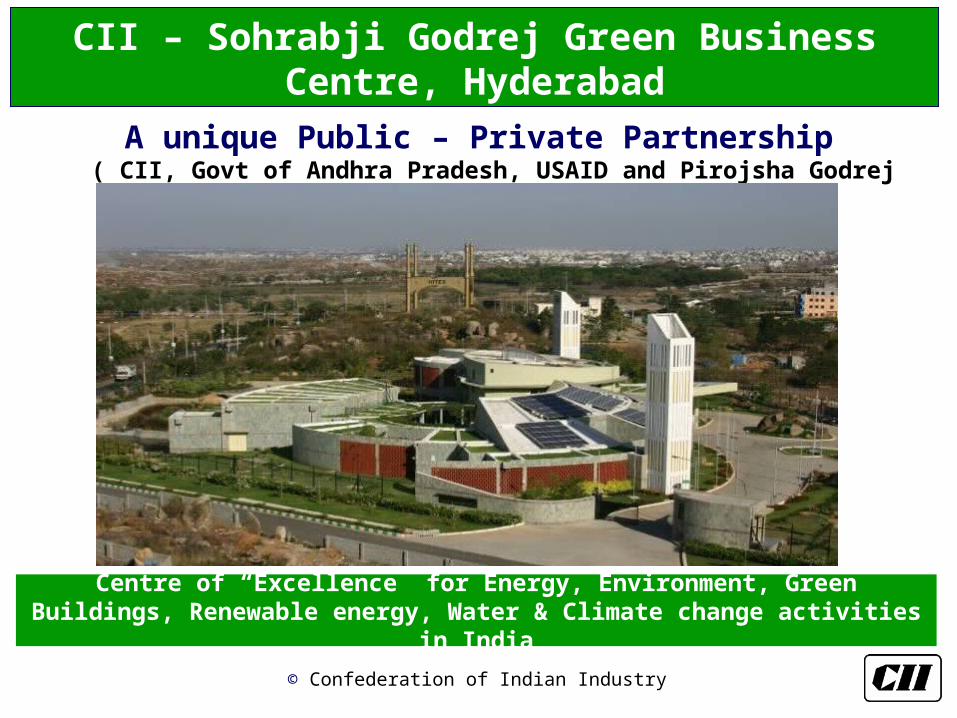
Mission on Sustainable growth
Core Purpose - “To promote and champion conservation of Natural resources in Indian Industry”, without compromising on high and accelerated growth
© Confederation of Indian Industry
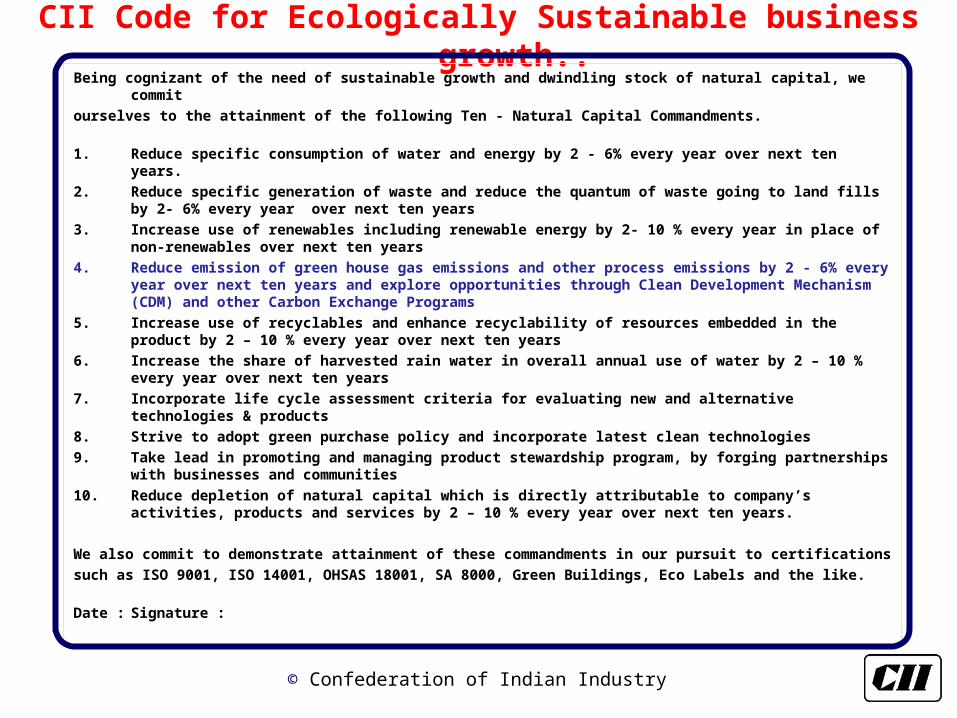
CII Code for Ecologically Sustainable business growth..
Being cognizant of the need of sustainable growth and dwindling stock of natural capital, we commit
ourselves to the attainment of the following Ten - Natural Capital Commandments.
1. Reduce specific consumption of water and energy by 2 - 6% every year over next ten years.
2. Reduce specific generation of waste and reduce the quantum of waste going to land fills by 2- 6% every year over next ten years
3. Increase use of renewables including renewable energy by 2- 10 % every year in place of non-renewables over next ten years
4. Reduce emission of green house gas emissions and other process emissions by 2 - 6% every year over next ten years and explore opportunities through Clean Development Mechanism (CDM) and other Carbon Exchange Programs
5. Increase use of recyclables and enhance recyclability of resources embedded in the product by 2 – 10 % every year over next ten years
6. Increase the share of harvested rain water in overall annual use of water by 2 – 10 % every year over next ten years
7. Incorporate life cycle assessment criteria for evaluating new and alternative technologies & products
8. Strive to adopt green purchase policy and incorporate latest clean technologies 9. Take lead in promoting and managing product stewardship program, by forging
partnerships with businesses and communities10. Reduce depletion of natural capital which is directly attributable to company’s activities,
products and services by 2 – 10 % every year over next ten years.
We also commit to demonstrate attainment of these commandments in our pursuit to certifications
such as ISO 9001, ISO 14001, OHSAS 18001, SA 8000, Green Buildings, Eco Labels and the like.
Date : Signature :
© Confederation of Indian Industry
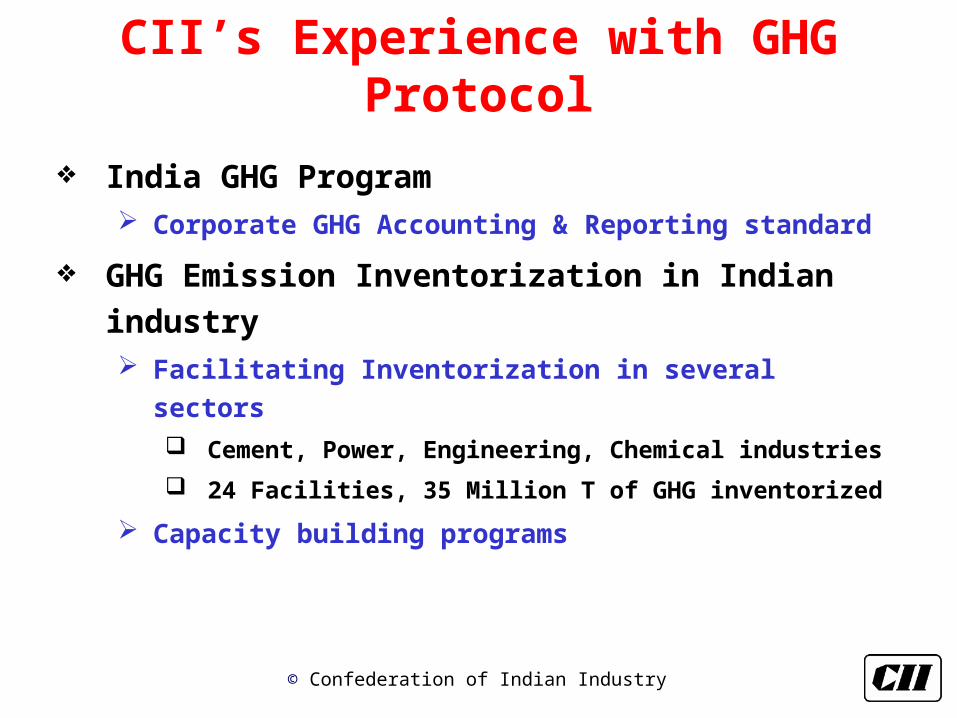
CII’s Experience with GHG Protocol
India GHG Program Corporate GHG Accounting & Reporting standard
GHG Emission Inventorization in Indian industry Facilitating Inventorization in several sectors
Cement, Power, Engineering, Chemical industries
24 Facilities, 35 Million T of GHG inventorized
Capacity building programs
© Confederation of Indian Industry
Lessons learnt

© Confederation of Indian Industry
1. Commitment from Top Management
Voluntary commitment from the
Chief Executive for GHG Intensity
reduction
Facilitates – Quicker
implementation
Paradigm shift
‘Projects not possible approach’ to
‘How to make it possible’

© Confederation of Indian Industry
2. Identification of focus areas
Structured system / tool
for GHG emission
inventorisation Holistic approach for
emission reduction
Easy for top management
to identify Focus areas E.g Cement companies –
more focus on blended
cement
© Confederation of Indian Industry
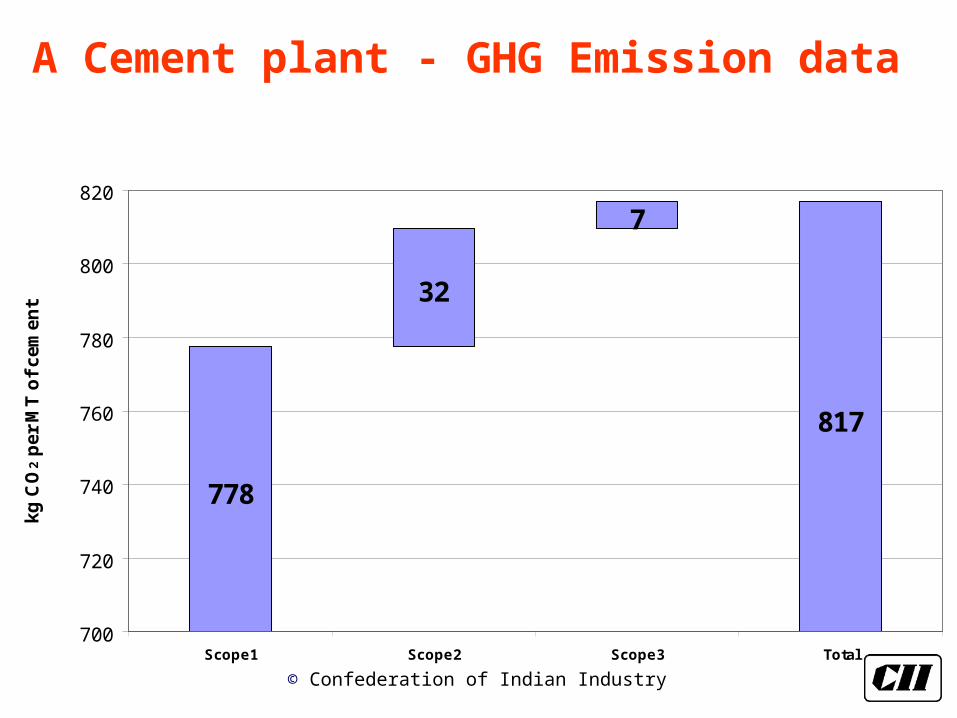
A Cement plant - GHG Emission data
778
817
32
7
700
720
740
760
780
800
820
Scope1 Scope2 Scope3 Total
kg C
O2 p
er M
T o
f ce
men
t
© Confederation of Indian Industry
GHG Emission Reduction opportunities
© Confederation of Indian Industry
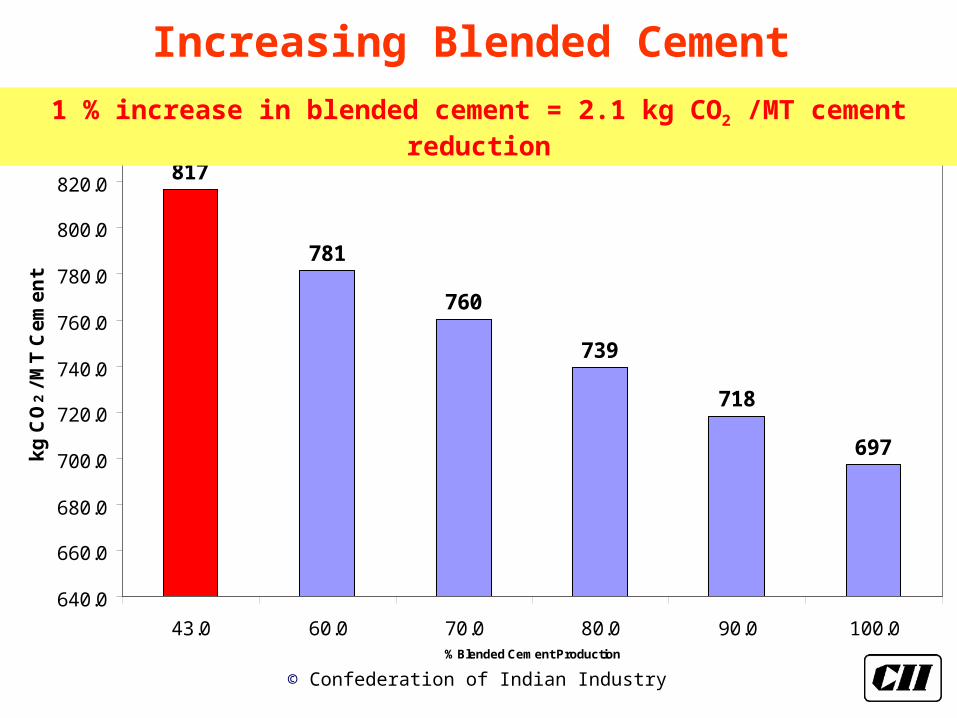
Increasing Blended Cement
817
781
760
739
718
697
640.0
660.0
680.0
700.0
720.0
740.0
760.0
780.0
800.0
820.0
840.0
43.0 60.0 70.0 80.0 90.0 100.0% Blended Cement Production
kg
CO
2 / M
T C
em
en
t
1 % increase in blended cement = 2.1 kg CO2 /MT cement reduction
© Confederation of Indian Industry
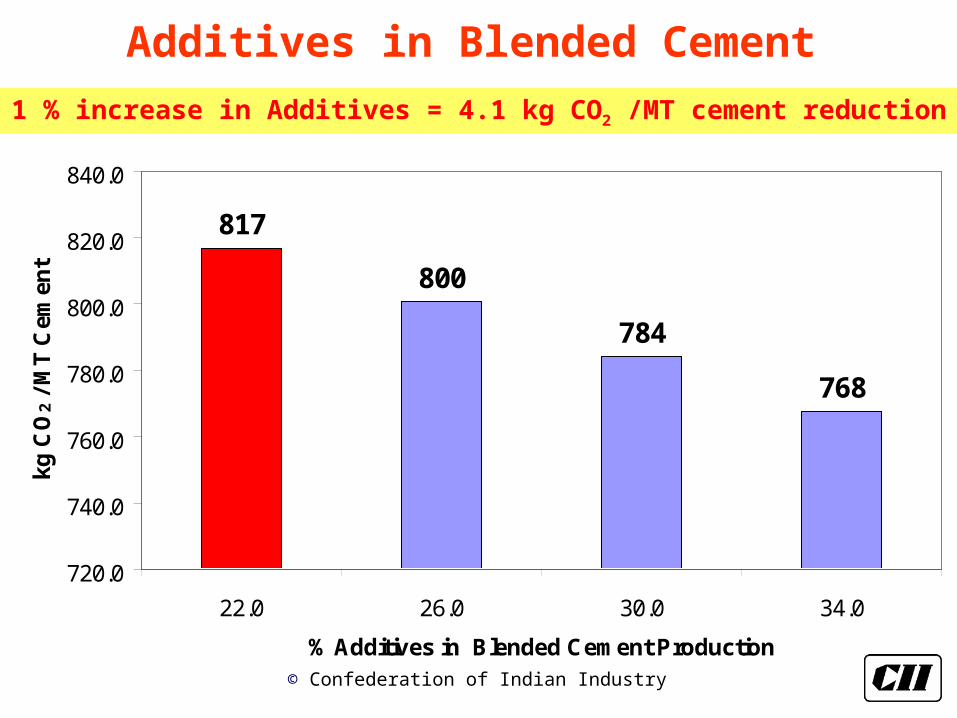
Additives in Blended Cement
817
800
784
768
720.0
740.0
760.0
780.0
800.0
820.0
840.0
22.0 26.0 30.0 34.0
% Additives in Blended Cement Production
kg C
O2
/ MT
Cem
ent
1 % increase in Additives = 4.1 kg CO2 /MT cement reduction

© Confederation of Indian Industry
Specific fuel consumption
817
810
803
796
790
783
760.0
770.0
780.0
790.0
800.0
810.0
820.0
830.0
840.0
800.0 780.0 760.0 740.0 720.0 700.0% Blended Cement Production
kg
CO
2 / M
T C
em
en
t
10 kcal /kg clinker reduction = 3.2 kg CO2 /MT cement reduction
© Confederation of Indian Industry
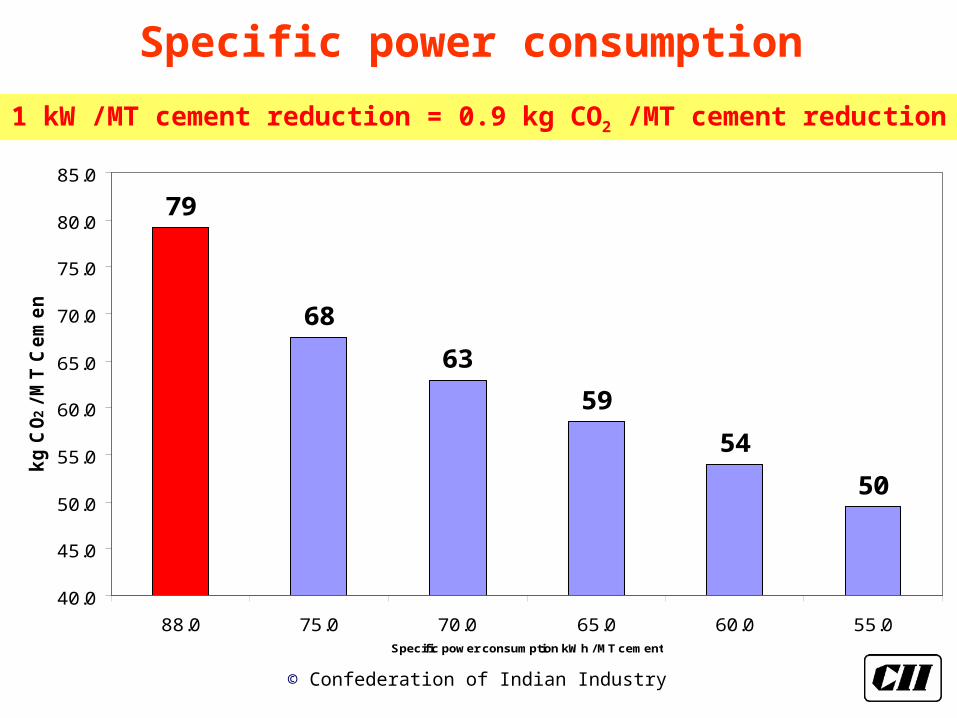
Specific power consumption
79
68
63
59
54
50
40.0
45.0
50.0
55.0
60.0
65.0
70.0
75.0
80.0
85.0
88.0 75.0 70.0 65.0 60.0 55.0Specific power consumption kWh / MT cement
kg
CO
2 / M
T C
em
en
t
1 kW /MT cement reduction = 0.9 kg CO2 /MT cement reduction
© Confederation of Indian Industry
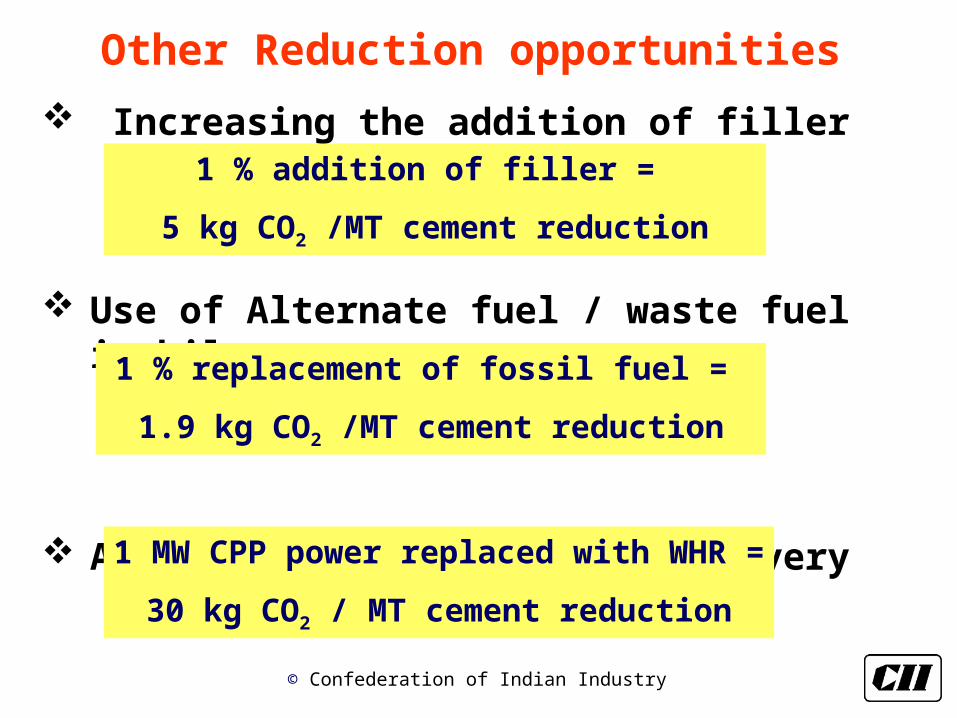
Other Reduction opportunities
Increasing the addition of filler
Use of Alternate fuel / waste fuel in kiln
Application of Waste heat recovery
1 % addition of filler =
5 kg CO2 /MT cement reduction
1 % replacement of fossil fuel =
1.9 kg CO2 /MT cement reduction
1 MW CPP power replaced with WHR =
30 kg CO2 / MT cement reduction

© Confederation of Indian Industry
Long term GHG emission target
Based on the present technology 100 % Blended Cement 32 + 5 % additives 700 kcal / kg Clinker 65 kW / MT Cement
Equivalent financial benefits – $ 4.5 Million
© Confederation of Indian Industry
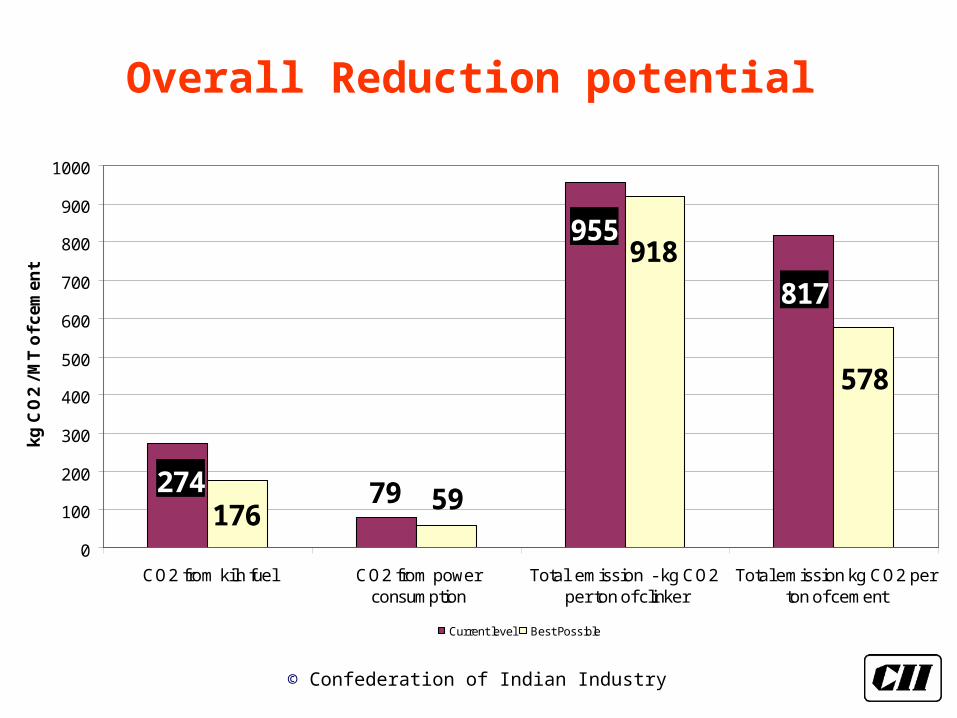
Overall Reduction potential
955
817
79274
918
578
591760
100
200
300
400
500
600
700
800
900
1000
CO2 from kiln fuel CO2 from powerconsumption
Total emission - kg CO2 per ton of clinker
Total emission kg CO2 perton of cement
kg
CO
2 /
MT
of
ce
me
nt
Current level Best Possible
© Confederation of Indian Industry
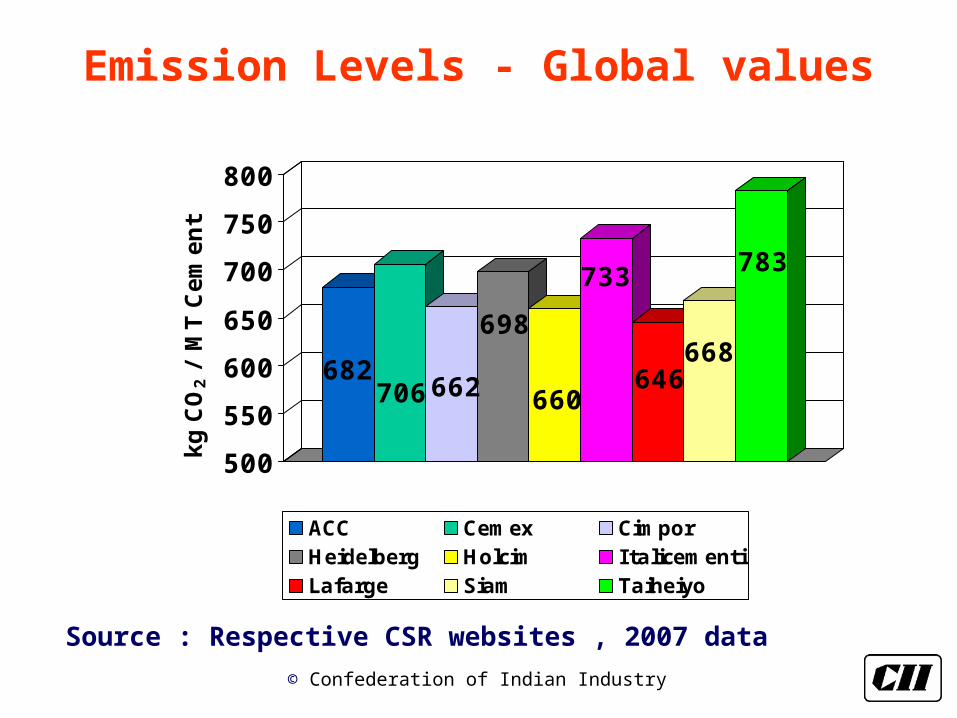
Emission Levels - Global values
682706662
698
660
733
646668
783
500
550
600
650
700
750
800kg C
O2 /
MT C
em
ent
ACC Cemex CimporHeidelberg Holcim ItalicementiLafarge Siam Taiheiyo
Source : Respective CSR websites , 2007 data
© Confederation of Indian Industry
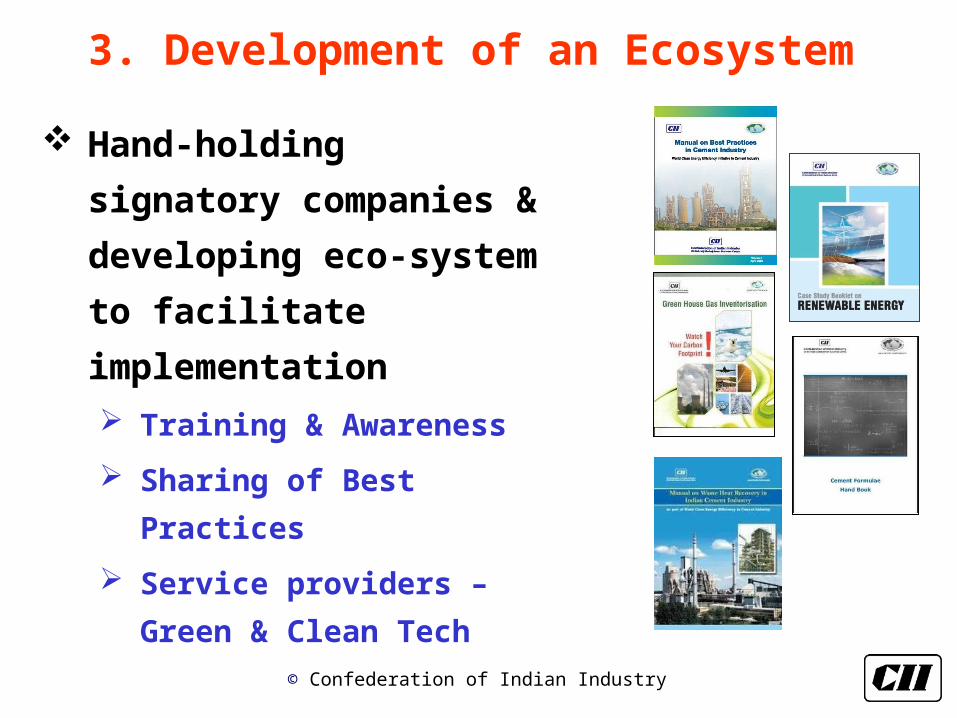
3. Development of an Ecosystem
Hand-holding
signatory companies
& developing eco-
system to facilitate
implementation Training & Awareness
Sharing of Best
Practices
Service providers –
Green & Clean Tech
© Confederation of Indian Industry
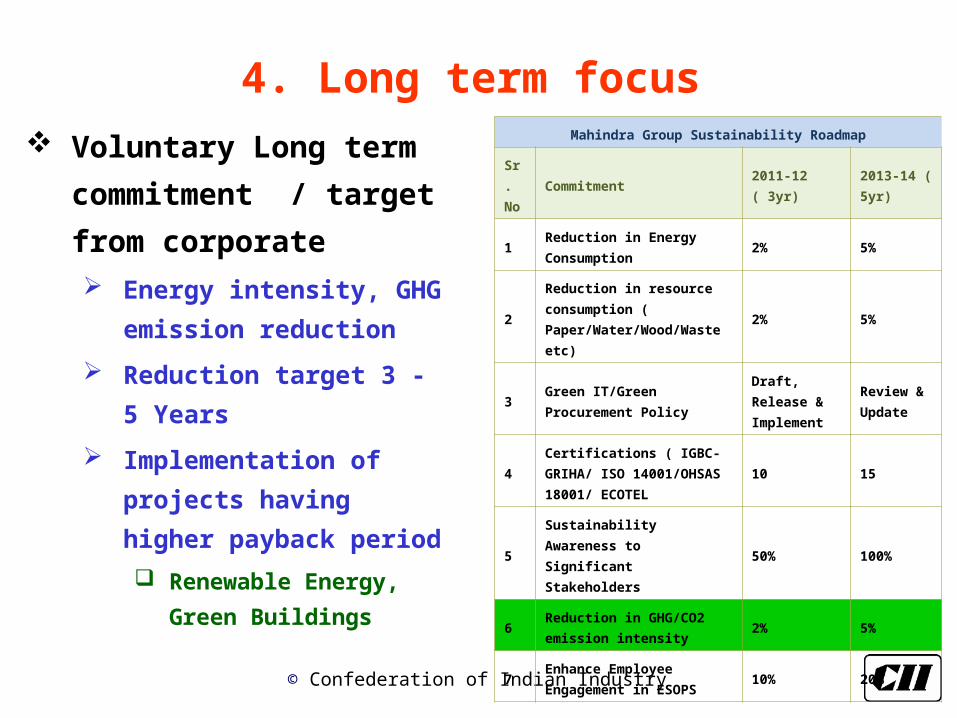
4. Long term focus Voluntary Long term
commitment / target
from corporate Energy intensity, GHG
emission reduction
Reduction target 3 - 5
Years
Implementation of
projects having higher
payback period
Renewable Energy,
Green Buildings
Mahindra Group Sustainability Roadmap
Sr.
NoCommitment
2011-12
( 3yr)
2013-14 (
5yr)
1Reduction in Energy
Consumption2% 5%
2
Reduction in resource
consumption (
Paper/Water/Wood/Wast
e etc)
2% 5%
3Green IT/Green
Procurement Policy
Draft,
Release &
Implement
Review &
Update
4
Certifications ( IGBC-
GRIHA/ ISO
14001/OHSAS 18001/
ECOTEL
10 15
5
Sustainability
Awareness to Significant
Stakeholders
50% 100%
6Reduction in GHG/CO2
emission intensity2% 5%
7Enhance Employee
Engagement in ESOPS10% 20%
© Confederation of Indian Industry
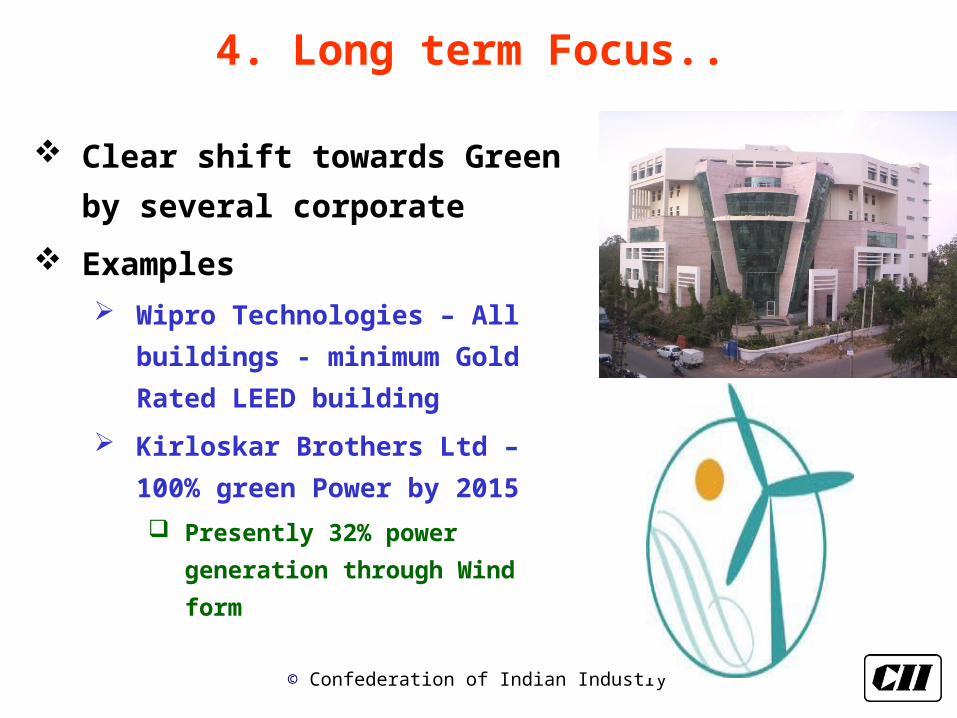
4. Long term Focus..
Clear shift towards Green
by several corporate
Examples Wipro Technologies – All
buildings - minimum Gold
Rated LEED building
Kirloskar Brothers Ltd –
100% green Power by 2015
Presently 32% power
generation through Wind
form
© Confederation of Indian Industry
What companies need
Identification of low carbon technologies
Best practices sharing, case studies
Protocol development for sectoral benchmarking
How to prioritize projects for maximum GHG
mitigation
Develop software tools to enable decision making
Converting GHG reduction measures to financial
benefits
Document on market opportunities for GHG reduction
Linking with Carbon markets
Low cost financing
Carbon Neutrality - Protocol

© Confederation of Indian Industry
Thank You
K.S. VenkatagiriPrincipal CounsellorCII – Sohrabji Godrej Green Business CentreEmail: [email protected] website www.greenbusinesscentre.com