ÙÙÙÙ Comprehensive Product Review Ofria Global Allocation ... · Comprehensive Product Review...
29
Comprehensive Product Review Ofria Global Allocation Fund Œ ÙÙÙÙ Morningstar Analyst Pillar Ratings Process Pillar Performance Pillar People Pillar Parent Pillar Price Pillar Positive Positive Positive Neutral Positive Turnover Ratio % Time Period: 1/1/2011 to 12/31/2014 2011 2012 2013 2014 31.0 39.0 50.0 75.0 Net Expense Ratio Time Period: 1/1/2011 to 12/31/2014 2011 2012 2013 2014 1.06 1.07 1.05 1.04 Morningstar Rating Trend 2015-10 2015-09 2015-08 2015-07 2015-06 2015-05 2015-04 2015-03 2015-02 2015-01 2014-12 2014-11 ÙÙÙ ÙÙÙ ÙÙÙ ÙÙÙ ÙÙÙ ÙÙÙ ÙÙÙ ÙÙÙ ÙÙÙ ÙÙÙÙ ÙÙÙÙ ÙÙÙÙ Snapshot Inception Date Primary Prospectus Benchmark Morningstar Category Domicile Firm Name Morningstar Analyst Rating Manager Name Longest Manager Tenure Base Currency Annual Report Net Expense Ratio Turnover Ratio % Global Fund Report Analysis Date Portfolio Date 10/21/1994 FTSE World TR USD US OE World Allocation United States BlackRock Œ Multiple 27 US Dollar 1.04 75.00 1/13/2015 7/31/2015 Product Size Time Period: 10/1/2010 to 9/30/2015 2011 2012 2013 2014 2015 $ 45,659,687,561 $ 49,310,073,509 $ 52,960,459,457 $ 56,610,845,405 $ 60,261,231,353 Estimated Net Flows - Fund Level Time Period: 10/1/2010 to 9/30/2015 2010 2011 2012 2013 2014 2015 $ -1,500,000,000 $ -750,000,000 $ 0 $ 750,000,000 $ 1,500,000,000 Estimated Net Asset Flows in $Millions (Month-End) - Share Class 1 Mo 3 Mo 6 Mo 1 Yr 3 Yr 5 Yr -211 -427 -613 -1,630 -4,239 -3,696 Estimated Net Asset Flow in $Millions (Month-End) - Fund Fund Size 1 Mo 3 Mo 6 Mo YTD 1 Yr 3 Yr 5 Yr 51,380 -339 -798 -1,183 -3,546 -5,224 -10,110 -5,663 Over/Under Benchmark Performance Time Period: 10/1/2005 to 9/30/2015 Rolling Window: 3 Years 1 Month shift Calculation Benchmark: FTSE World TR USD -30.0% -20.0% -10.0% 0.0% 10.0% 20.0% 30.0% 40.0% -5.0% -1.0% 3.0% 7.0% 11.0% 15.0% 19.0% 23.0% 2008 2015 Ofria Global Allocation Fund outperforms 37 times (43.53 %) FTSE World TR USD outperforms 48 times (56.47 %) Zero Excess Return Ofria Global Allocation Fund Return FTSE World TR USD Return Source: Morningstar Direct
Transcript of ÙÙÙÙ Comprehensive Product Review Ofria Global Allocation ... · Comprehensive Product Review...

Comprehensive Product Review Ofria Global Allocation FundŒ
ÙÙÙÙ
Morningstar Analyst Pillar Ratings
Process Pillar
Performance Pillar
People Pillar
Parent Pillar
Price Pillar
Positive
Positive
Positive
Neutral
Positive
Turnover Ratio %
Time Period: 1/1/2011 to 12/31/2014
Turnover
Ratio %
2011 2012 2013 2014
31.0 39.050.0
75.0
Net Expense Ratio
Time Period: 1/1/2011 to 12/31/2014
2011 2012 2013 2014
1.06 1.07 1.05 1.04
Morningstar Rating Trend2015-102015-092015-082015-072015-062015-052015-042015-032015-022015-012014-122014-11 ÙÙÙ
ÙÙÙÙÙÙÙÙÙÙÙÙÙÙÙÙÙÙÙÙÙÙÙÙ
ÙÙÙÙÙÙÙÙÙÙÙÙ
Snapshot
Inception Date
Primary Prospectus Benchmark
Morningstar Category
Domicile
Firm Name
Morningstar Analyst Rating
Manager Name
Longest Manager Tenure
Base Currency
Annual Report Net Expense Ratio
Turnover Ratio %
Global Fund Report Analysis Date
Portfolio Date
10/21/1994
FTSE World TR USD
US OE World Allocation
United States
BlackRock
Œ
Multiple
27
US Dollar
1.04
75.00
1/13/2015
7/31/2015
Product Size
Time Period: 10/1/2010 to 9/30/2015
2011 2012 2013 2014 2015
$ 45,659,687,561
$ 49,310,073,509
$ 52,960,459,457
$ 56,610,845,405
$ 60,261,231,353
Estimated Net Flows - Fund Level
Time Period: 10/1/2010 to 9/30/2015
2010 2011 2012 2013 2014 2015$ -1,500,000,000
$ -750,000,000
$ 0
$ 750,000,000
$ 1,500,000,000
Estimated Net Asset Flows in $Millions (Month-End) - Share Class
1 Mo 3 Mo 6 Mo 1 Yr 3 Yr 5 Yr
-211 -427 -613 -1,630 -4,239 -3,696
Estimated Net Asset Flow in $Millions (Month-End) - Fund
Fund Size 1 Mo 3 Mo 6 Mo YTD 1 Yr 3 Yr 5 Yr
51,380 -339 -798 -1,183 -3,546 -5,224 -10,110 -5,663
Over/Under Benchmark Performance
Time Period: 10/1/2005 to 9/30/2015 Rolling Window: 3 Years 1 Month shift Calculation Benchmark: FTSE World TR USD
-30.0% -20.0% -10.0% 0.0% 10.0% 20.0% 30.0% 40.0%
-5.0%-1.0%3.0%7.0%11.0%15.0%19.0%23.0% 2008
2015
Ofria Global Allocation Fund outperforms 37 times (43.53 %)
FTSE World TR USD outperforms 48 times (56.47 %)
Zero Excess Return
Ofria
Glo
bal A
lloca
tion
Fund
Ret
urn
FTSE World TR USD Return
Source: Morningstar Direct
Comprehensive Product Review Ofria Global Allocation FundŒ
ÙÙÙÙ
Process: Portfolio
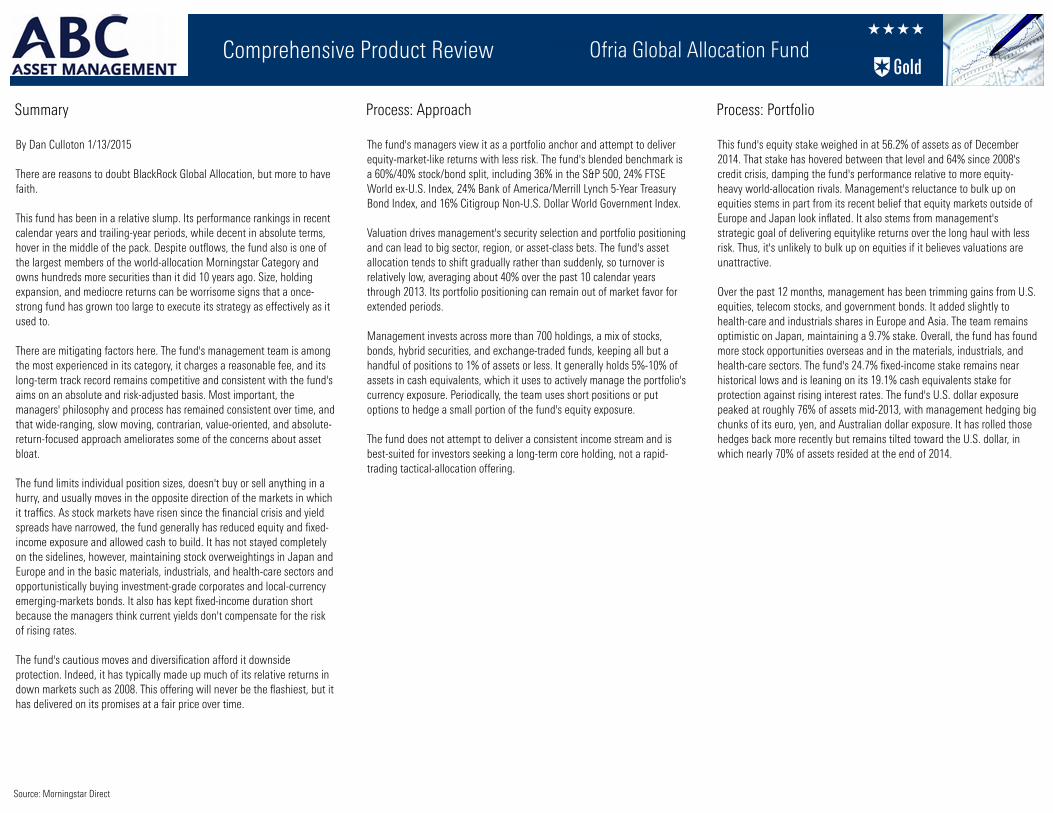
This fund's equity stake weighed in at 56.2% of assets as of December 2014. That stake has hovered between that level and 64% since 2008's credit crisis, damping the fund's performance relative to more equity-heavy world-allocation rivals. Management's reluctance to bulk up on equities stems in part from its recent belief that equity markets outside of Europe and Japan look inflated. It also stems from management's strategic goal of delivering equitylike returns over the long haul with less risk. Thus, it's unlikely to bulk up on equities if it believes valuations are unattractive.
Over the past 12 months, management has been trimming gains from U.S. equities, telecom stocks, and government bonds. It added slightly to health-care and industrials shares in Europe and Asia. The team remains optimistic on Japan, maintaining a 9.7% stake. Overall, the fund has found more stock opportunities overseas and in the materials, industrials, and health-care sectors. The fund's 24.7% fixed-income stake remains near historical lows and is leaning on its 19.1% cash equivalents stake for protection against rising interest rates. The fund's U.S. dollar exposure peaked at roughly 76% of assets mid-2013, with management hedging big chunks of its euro, yen, and Australian dollar exposure. It has rolled those hedges back more recently but remains tilted toward the U.S. dollar, in which nearly 70% of assets resided at the end of 2014.
Process: Approach
The fund's managers view it as a portfolio anchor and attempt to deliver equity-market-like returns with less risk. The fund's blended benchmark is a 60%/40% stock/bond split, including 36% in the S&P 500, 24% FTSE World ex-U.S. Index, 24% Bank of America/Merrill Lynch 5-Year Treasury Bond Index, and 16% Citigroup Non-U.S. Dollar World Government Index.
Valuation drives management's security selection and portfolio positioning and can lead to big sector, region, or asset-class bets. The fund's asset allocation tends to shift gradually rather than suddenly, so turnover is relatively low, averaging about 40% over the past 10 calendar years through 2013. Its portfolio positioning can remain out of market favor for extended periods.
Management invests across more than 700 holdings, a mix of stocks, bonds, hybrid securities, and exchange-traded funds, keeping all but a handful of positions to 1% of assets or less. It generally holds 5%-10% of assets in cash equivalents, which it uses to actively manage the portfolio's currency exposure. Periodically, the team uses short positions or put options to hedge a small portion of the fund's equity exposure.
The fund does not attempt to deliver a consistent income stream and is best-suited for investors seeking a long-term core holding, not a rapid-trading tactical-allocation offering.
Summary
By Dan Culloton 1/13/2015
There are reasons to doubt BlackRock Global Allocation, but more to have faith.
This fund has been in a relative slump. Its performance rankings in recent calendar years and trailing-year periods, while decent in absolute terms, hover in the middle of the pack. Despite outflows, the fund also is one of the largest members of the world-allocation Morningstar Category and owns hundreds more securities than it did 10 years ago. Size, holding expansion, and mediocre returns can be worrisome signs that a once-strong fund has grown too large to execute its strategy as effectively as it used to.
There are mitigating factors here. The fund's management team is among the most experienced in its category, it charges a reasonable fee, and its long-term track record remains competitive and consistent with the fund's aims on an absolute and risk-adjusted basis. Most important, the managers' philosophy and process has remained consistent over time, and that wide-ranging, slow moving, contrarian, value-oriented, and absolute-return-focused approach ameliorates some of the concerns about asset bloat.
The fund limits individual position sizes, doesn't buy or sell anything in a hurry, and usually moves in the opposite direction of the markets in which it traffics. As stock markets have risen since the financial crisis and yield spreads have narrowed, the fund generally has reduced equity and fixed-income exposure and allowed cash to build. It has not stayed completely on the sidelines, however, maintaining stock overweightings in Japan and Europe and in the basic materials, industrials, and health-care sectors and opportunistically buying investment-grade corporates and local-currency emerging-markets bonds. It also has kept fixed-income duration short because the managers think current yields don't compensate for the risk of rising rates.
The fund's cautious moves and diversification afford it downside protection. Indeed, it has typically made up much of its relative returns in down markets such as 2008. This offering will never be the flashiest, but it has delivered on its promises at a fair price over time.
Source: Morningstar Direct
Comprehensive Product Review Ofria Global Allocation FundŒ
ÙÙÙÙ
Parent
BlackRock has become the world’s largest asset manager via acquisitions. The firm, with $4.3 trillion in assets, only runs money, and its executives stress its fiduciary duty. Communication with clients and employees is clear, and its funds’ boards of trustees are independent.
BlackRock’s size can work against it, though. It’s still culling hundreds of acquired strategies. Its iShares ETF lineup is responsible, but it has some niche funds and others that could be cheaper. It has cut some mutual funds’ fees, but they’re still no bargain. Manager ownership of funds has improved but could be higher. It has made progress in revamping its actively managed fixed-income funds but not as much in active equities. Fund manager tenure and retention still rank behind most top 25 U.S.-based fund families. BlackRock doesn't chase every fad, but there are few trends in which it's not involved. Not one of its regulatory issues in recent years amounts to much, but it’s had more than other top U.S.-based fund families. And BlackRock must balance the interests of its clients with its public shareholders’ growth expectations.
BlackRock’s culture deserves an upgrade for its unparalleled scale and resources, reputation for operational competence, and disciplined, experienced, and competitive leadership. It still gets a C Parent pillar score overall, though, because there’s still progress to make on fees, manager incentives, and regulatory history.
Price
The 1.05% expense ratio on the fund's A shares and 0.78% levy on the Institutional shares are low relative to similarly distributed world-allocation funds and below the median for similarly distributed aggressive-, moderate-, and conservative-allocation funds.
The Retirement, C, and B shares offer below-average expenses versus similarly distributed world-allocation funds.
The shares' expense ratios are unlikely to drop much further given the management-fee breakpoints currently in place for the fund.
Performance
By Dan Culloton 1/13/2015
This fund's 8.6% and 6.3% annualized gains over the trailing three- and five-year periods through Dec. 31, 2014, land in the world-allocation category's bottom half. Those showings stem from management's decisions since the 2008 crisis to tread lightly in or stay out of certain slices of the market because of perceived risks, rising interest rates in particular. That has led the team to scoop up convertible bonds and eschew financials and consumer discretionary stocks in early 2009. Management also avoided rallying emerging-markets and high-yield debt while also scaling back on government bonds as yields ground lower. Those decisions damped the fund's gains in 2009, 2010, and 2012, while the latter move left it with less ballast in late 2011's sell-off. But several of those same moves also fueled the fund's above-average, albeit barely, returns in 2013 and 2014.
Management's aversion to permanent capital loss and investments that it believes don't adequately compensate investors for their risks has driven the fund's long-term success. Its 6.9% gain over the trailing decade through Dec. 31, 2014, lands just ahead of the FTSE World Index's 6.7% with one third less volatility, as measured by standard deviation. Over that stretch, the fund captured about 55% of that index's downside and about two thirds of its upside--better than its average peer and consistent with its goal of equitylike returns with less risk.
Source: Morningstar Direct

Comprehensive Product Review Ofria Global Allocation FundŒ
ÙÙÙÙ
Manager Biography
Dennis W. Stattman since 2/3/1989
University of Virginia, 1973, B.S., CommerceUniversity of Chicago, 1980, M.B.A.
Mr. Stattman, Senior Portfolio Manager, is head of the BlackRock Global Allocation team and a member of the Leadership Committee and Central StrategyGroup. Mr. Stattman’s service with the firm dates back to 1989, including his years with Merrill Lynch Investment Managers (MLIM), which merged with BlackRock in 2006. Mr. Stattman joined Merrill Lynch Investment Managers in 1989 as an Associate Portfolio Manager of the Merrill Lynch Global Allocation Fund. Mr. Stattman was named Senior Portfolio Manager of the Merrill Lynch Global Allocation Fund in September 2002. From September of 1989 through February 1996, he was also Senior Portfolio Manager of the Merrill Lynch Special Value Fund. Prior to joining MLIM, Mr. Stattman served as the Director of Research for Meridian Management Company, and as Pension Investment Officer for the World Bank. Mr. Stattman earned a B.S. in Commerce from the University of Virginia in 1973 and an M.B.A. with honors from the University of Chicago in 1980. He is a CFA Charterholder.
Dan Chamby since 12/31/2003
University of Pennsylvania, 1988, M.B.A.Duquesne University, 1982, B.A.
Dan Chamby, CFA , Managing Director and Portfolio Manager, is a member of BlackRock's Global Allocation team.Mr. Chamby's service with the firm datesback to 1993, including his years with Merrill Lynch Investment Managers (MLIM), which merged with BlackRock in 2006. He has been with the Global Allocation Fund since joining MLIM, most recently as a portfolio manager. Prior to joining MLIM, he was with Fujitsu Ltd. in their Tokyo headquarters as a research analyst. He began his investment career with Mellon Bank in 1982 as an Asia/Pacific credit analyst, and later managed the International MoneyMarket desk.He earned a BA degree in political science and French literature from Duquesne University in 1982, and an MBA degree from the University of Pennsylvania in 1988. He is a CFA Charterholder.
Aldo Roldan since 10/2/2006
University of Chile, 1973, B.A., EconomicsUniversity of Pennsylvania, 1978, Ph.D., Economics
Aldo Roldan, Ph.D, Managing Director and Portfolio Manager, is a member of BlackRock's Global Allocation team.Mr. Roldan's service with the firm dates back to 1998, including his years with Merrill Lynch Investment Managers (MLIM), which merged with BlackRock in 2006. At MLIM, he was a portfolio manager for various global portfolios, and was Head of Emerging Market Debt. Mr. Roldan joined the Global Allocationteam in July of 2006. Prior to joining MLIM in 1998, he was a senior vice president at Santander Investments, and earlier was a global economic analyst at JP Morgan Chase. Mr. Roldan began his investment career at Chase Econometrics, where he founded and managed the Emerging Markets Research Group.Mr. Roldan earned a BA degree in economics from the University of Chile in 1973, and a Ph.D in economics and econometrics from the University of Pennsylvania in 1978.
People
By Dan Culloton 1/13/2015
Dennis Stattman has been at the helm since 1989 and is one of the longest-serving managers in the world-allocation category. Joining him as managers are Dan Chamby, who has worked on the fund for most of its history, and Aldo Roldan, who joined the team in 2006 and oversees its currency strategy. Most of the team's 10 senior analysts have worked on the strategy for more than a decade. Each has expertise in particular sectors and asset classes, but all are trained and encouraged to look across sectors, regions, and asset classes to uncover opportunities.
The team has expanded since BlackRock's late-2006 acquisition of its prior employer, Merrill Lynch Investment Management. A dozen research associates and two quantitative associates round out the investment research effort. Co-chief operating officers Kevin McKenna and Lisa O'Donnell and roughly a dozen administrative and product specialist personnel have streamlined the team's back-office operation in recent years. BlackRock's formidable risk and quantitative analysis group supports the fund's risk-management effort. Over the past few years, the team has begun interacting with other portfolio-management, asset-allocation, and capital-markets groups across BlackRock, which should be beneficial in assessing market risks and opportunities.
Morningstar nominated the team for Morningstar Manager of the Decade in 2009.
Source: Morningstar Direct

Comprehensive Product Review Ofria Global Allocation FundŒ
ÙÙÙÙ
Trailing Returns (Annualized)
ReturnExcessReturn
YTD
1 Year
3 Years
5 Years
10 Years
Since Inception
-3.81% 2.52%
-4.40% 1.40%
4.38% -3.63%
4.67% -3.17%
5.75% 0.45%
8.86% 2.08%
Cumulative Returns
Time Period: 10/1/2010 to 9/30/2015
Calculation Benchmark: FTSE World TR USD
Investment Benchmark
Return (Cumulative)
Excess Return (Cumulative)
4.67%
-3.17%
7.84%
0.00%
Trailing Return Peer Group Performance Thru 2 Lenses
Calculation Benchmark: FTSE World TR USD
YTD 1 Year 3 Years 5 Years 10 Years
Ofria Global Allocation Fund
Allocation
Peer group rank of peer group count
Median
Average
Std Dev
50th Percentile
Allocation + World Allocation
Peer group rank of peer group count
Median
Average
Std Dev
50th Percentile
-3.81% -4.40% 4.38% 4.67% 5.75%
151 of 560 216 of 542 180 of 458 167 of 342 31 of 194
-5.00% -5.10% 3.85% 4.65% 4.08%
-5.57% -6.17% 3.01% 4.30% 4.27%
3.43% 4.76% 3.61% 2.69% 1.48%
-5.00% -5.10% 3.85% 4.65% 4.08%
7,360 of 36,021 7,765 of 34,484 5,112 of 25,936 3,975 of 20,424 600 of 8,093
-7.15% -9.62% 0.63% 0.97% 2.95%
-7.53% -9.28% 0.50% 1.30% 3.09%
5.61% 7.18% 4.93% 3.88% 2.74%
-7.15% -9.62% 0.63% 0.97% 2.95%
Returns by Sector
Time Period: 11/1/2010 to 10/31/2015
PortfolioWeights
BenchmarkWeights
PortfolioRescaledWeights
BenchmarkRescaledWeights
PortfolioReturn
BenchmarkReturn
ExcessReturn
Basic Materials
Communication Services
Consumer Cyclical
Consumer Defensive
Energy
Financial Services
Healthcare
Industrials
Real Estate
Technology
Utilities
Unclassified
Attribution Total
Cash
Bond
Other
Missing Performance
Total
Reported Total
Expense Ratio
Residual(Reported - Attribution + Expense)
5.35% 7.15% 8.88% 7.19% -9.91% -3.74% -6.18%
4.03% 4.87% 6.66% 4.88% 12.52% 10.37% 2.15%
4.79% 10.44% 8.06% 10.49% 10.84% 13.69% -2.85%
3.59% 10.29% 6.02% 10.33% 11.63% 11.64% -0.02%
7.22% 9.28% 12.02% 9.32% 0.86% 0.60% 0.26%
9.24% 18.27% 15.37% 18.35% 9.49% 7.22% 2.27%
8.10% 10.36% 13.59% 10.39% 18.35% 18.25% 0.09%
6.19% 10.81% 10.36% 10.86% 9.13% 8.63% 0.51%
1.36% 2.59% 2.30% 2.59% 4.73% 8.02% -3.29%
7.55% 12.18% 12.64% 12.23% 10.29% 11.97% -1.68%
2.15% 3.35% 3.57% 3.37% 4.44% 3.97% 0.46%
0.33% 0.02% 0.52% 0.02% 6.77% 27.82% -21.06%
59.90% 99.62% 100.00% 100.00% 8.37% 8.91% -0.54%
4.12% 0.00%
29.66% 0.00%
9.88% 0.11%
1.03% 0.27%
104.59% 100.00%
5.07% 8.73% -3.66%
1.11% 0.00% 1.11%
-2.19% -0.18% -2.01%
Source: Morningstar Direct

Comprehensive Product Review Ofria Global Allocation FundŒ
ÙÙÙÙ
Net Cash Allocated
Time Period: 10/1/2010 to 9/30/2015
Currency: US Dollar
3/2011 9/2011 3/2012 9/2012 3/2013 9/2013 3/2014 9/2014 3/2015 9/20150.0%
5.0%
10.0%
15.0%
20.0%
25.0%
Ofria Global Allocation Fund US OE Mid-Cap Value
Equity Style Valuation
Time Period: 10/1/2010 to 9/30/2015
0.0
10.0
20.0
30.0
40.0
50.0
60.0
70.0
80.0
90.0
100.0
3/2011 9/2011 3/2012 9/2012 3/2013 9/2013 3/2014 9/2014 3/2015 9/2015
Value % Core % Growth %
Source: Morningstar Direct

Comprehensive Product Review Ofria Global Allocation FundŒ
ÙÙÙÙ
Sector Weights Relative to Benchmark
Time Period: 10/1/2014 to 9/30/2015
Rela
tive
Wei
ghts
Morningstar Sector
Basic Materials Communication Services Consumer Cyclical Consumer Defensive Energy Financial Services Healthcare Industrials Real Estate Technology Utilities -10.00-7.50-5.00-2.500.002.505.007.5010.0012.5015.0017.5020.00
GICS Equity Sectors
Time Period: 10/1/2010 to 9/30/2015
0.0
10.0
20.0
30.0
40.0
50.0
60.0
70.0
80.0
90.0
100.0
2010 2011 2012 2013 2014 2015
Energy %
Materials %
Industrials %
Consumer Discretionary %
Consumer Staples %
Healthcare %
Financials %
Information Technology %
Telecom Services %
Utilities %
Morningstar Equity Super Sector
Time Period: 10/1/2010 to 9/30/2015
0.0
10.0
20.0
30.0
40.0
50.0
60.0
70.0
80.0
90.0
100.0
2010 2011 2012 2013 2014 2015
Equity Econ Super Sector Cyclical %
Equity Econ Super Sector Defensive %
Equity Econ Super Sector Sensitive %
Source: Morningstar Direct
Comprehensive Product Review Ofria Global Allocation FundŒ
ÙÙÙÙ
Equity Style
Time Period: 10/1/2010 to 9/30/2015
0.0
10.0
20.0
30.0
40.0
50.0
60.0
70.0
80.0
90.0
100.0
2010 2011 2012 2013 2014 2015
Large Value %
Large Core %
Large Growth %
Mid Value %
Mid Core %
Mid Growth %
Small Value %
Small Core %
Small Growth %
International Exposure
Time Period: 10/1/2010 to 9/30/2015
0.0
10.0
20.0
30.0
40.0
50.0
60.0
70.0
80.0
90.0
100.0
2010 2011 2012 2013 2014 2015
United States %
International %
Equity Market Capitalization
Time Period: 10/1/2010 to 9/30/2015
0.0
10.0
20.0
30.0
40.0
50.0
60.0
70.0
80.0
90.0
100.0
2011 2012 2013 2014 2015
Giant %
Large %
Mid %
Small %
Micro %
Portfolio Date: 7/31/2015
32.0 29.5 21.0
5.8 5.8 3.4
0.3 0.5 1.7
LargeM
idSm
all
Value Blend Growth
Market Cap %
Market Cap Giant 49.7
Market Cap Large 32.5
Market Cap Mid 15.3
Market Cap Small 2.4
Market Cap Micro 0.1
Source: Morningstar Direct

Comprehensive Product Review Ofria Global Allocation FundŒ
ÙÙÙÙ
Holdings-Based Style Map
Mic
roSm
all
Mid
Larg
eGi
ant
Deep-Val Core-Val Core Core-Grth High-Grth
Ofria Global Allocation Fund FTSE World TR USD US OE World Allocation
Holdings-Based Style Trail
Time Period: 10/31/2010 to 9/30/2015
Mic
roSm
all
Mid
Larg
eGi
ant
Deep-Val Core-Val Core Core-Grth High-Grth
Ofria Global Allocation Fund FTSE World TR USD US OE World Allocation
Asset Allocation
Portfolio Date: 7/31/2015
%
Stock 53.6
Bond 16.6
Cash 21.1
Other 8.6
Total 100.0
Equity Regional Exposure
Portfolio Date: 7/31/2015
%North America 53.0Latin America 0.9United Kingdom 7.1Europe Developed 13.6Europe Emerging 0.0Africa/Middle East 1.8Australasia 0.3Japan 17.1Asia Developed 3.6Asia Emerging 2.6Total 100.0
Top 50 Holdings
Calculation Benchmark: FTSE World TR USD Portfolio Date: 7/31/2015
Portfolio Weighting Benchmark Weighting Share Change Stylector Icon Sector Return YTD
Uk Conv Gilt Regs 2.25 09/07/2023
US Treasury Note 2.25%
US Treasury Note 0.01%
Mexico (United Mexican States) 10 12/05/2024
US Treasury Note 2.125%
JPMorgan Chase & Co
Procter & Gamble Co
Bank of America Corporation
Anadarko Petroleum Corp
Wells Fargo & Co
Verizon Communications Inc
HSBC Holdings PLC
Italy (Republic Of) 1.5 06/01/2025
Mobileye Nv
Brazil Federative Republic Of 10 01/01/2025
Fuji Heavy Industries Ltd
Nestle SA
US Treasury Note 1.75%
Allergan PLC
Pioneer Natural Resources Co
Teva Pharmaceutical Industries Ltd ADR
Citigroup Inc
SABMiller PLC
US Treasury Note
Coca-Cola Co
FedEx Corp
Safran SA
Cisco Systems Inc
Statoil ASA
Berkshire Hathaway Inc Class B
Humana Inc
Visa Inc Class A
AbbVie Inc
AT&T Inc
Rio Tinto PLC
East Japan Railway Co
General Electric Co
US Treasury Note 2%
Sanofi
Sun Hung Kai Properties Ltd
Marathon Petroleum Corp
Apple Inc
Amgen Inc
Poland (Republic Of) 5.25 10/25/2020
AstraZeneca PLC
Japan Airlines Co Ltd
Denso Corp
Oracle Corporation
Pfizer Inc
1.22% -7,250,000.00
1.17% -7,625,000.00
1.11% -6,185,000.00
0.81% -12,236,219.00
0.80% 433,606,800.00
0.69% -11,802.00 a Technology
0.63% 200,500.00 Ç y Financial Services 24.88%
0.63% 143,144.00 Ç s Consumer Defensive -2.44%
0.56% 658,302.00 È y Financial Services 12.39%
0.56% -327,510.00 Ç o Energy -17.42%
0.51% -243,933.00 Ç y Financial Services 18.10%
0.51% 1,390,249.00 Ç i Communication Services 15.58%
0.51% 12,661,966.00 Ç y Financial Services 2.57%
0.48% -590,131,000.00
0.46% -532,487.00
0.46% 180,681.00
0.46% -451,700.00 É t Consumer Cyclical 33.76%
0.44% -207,906.00 È s Consumer Defensive 18.89%
0.40% -2,275,000.00
0.38% -75,938.00 É d Healthcare 32.25%
0.38% 1,341,323.00 È o Energy 6.90%
0.38% 438,702.00 È d Healthcare 22.29%
0.38% -117,760.00 Ç y Financial Services 15.02%
0.37% 820,554.00 É s Consumer Defensive 34.21%
0.36% 192,951,645.00
0.34% 254,862.00 Ç s Consumer Defensive 17.72%
0.33% 189,398.00 È p Industrials 6.47%
0.33% -151,829.00 É p Industrials 32.43%
0.33% -722,993.00 Ç a Technology 14.22%
0.33% 0.00 Ç o Energy 5.91%
0.32% 88,748.00 È y Financial Services 2.56%
0.32% 537,694.00 È d Healthcare 29.56%
0.32% -1,202,427.00 É y Financial Services 38.67%
0.31% -1,590,549.00 È d Healthcare 7.76%
0.31% 472,503.00 Ç i Communication Services 19.11%
0.31% -142,968.00 Ç r Basic Materials -9.84%
0.30% -223,800.00 É p Industrials 49.54%
0.30% -74,263.00 È p Industrials 38.08%
0.30% 81,158,800.00
0.30% 506,457.00 È d Healthcare 13.59%
0.30% 973,000.00 È u Real Estate -2.16%
0.30% 443,973.00 Ç o Energy 42.22%
0.29% 129,109.00 È a Technology 23.35%
0.29% -249,566.00 É d Healthcare 15.08%
0.29% -15,675,000.00
0.29% 488,763.00 Ç d Healthcare 13.79%
0.29% 49,500.00 Ç p Industrials 41.07%
0.29% -392,700.00 Ç t Consumer Cyclical 17.11%
0.28% -100,206.00 Ç a Technology -0.78%
0.28% -3,008,013.00 Ç d Healthcare 20.88%
0.69%
0.57%
0.52%
0.10%
0.82%
0.52%
0.48%
0.06%
0.66%
0.35%
0.05%
0.48%
0.14%
0.47%
0.12%
0.06%
0.39%
0.04%
0.44%
0.07%
0.41%
0.33%
0.59%
0.13%
0.10%
0.71%
0.33%
0.07%
0.08%
1.90%
0.36%
0.23%
0.01%
0.06%
0.37%
0.60%
Source: Morningstar Direct

Comprehensive Product Review Ofria Global Allocation FundŒ
ÙÙÙÙ
Number of Stock Holdings
Time Period: 11/1/2010 to 7/31/2015
7/2011 1/2012 7/2012 1/2013 7/2013 1/2014 7/2014 1/2015 7/2015
833 839 877 865 848 788 742 791 794 802 774 787 756 768 825 849 887 907 947
Concentration of Assets in Top 10 Holdings
Time Period: 11/1/2010 to 7/31/2015
7/2011 1/2012 7/2012 1/2013 7/2013 1/2014 7/2014 1/2015 7/2015
13.4 11.5 13.2 12.4 12.5 12.2 12.6 12.2 11.1 10.6 9.0 8.4 9.4 9.1 9.2 9.011.6 9.7 8.2
Historical Active Share
Time Period: 11/1/2010 to 10/31/2015
4/2011 10/2011 4/2012 10/2012 4/2013 10/2013 4/2014 10/2014 4/2015 10/2015
56.9
2
57.1
0
56.5
2
56.5
1
56.5
4
55.7
9
55.6
9
55.9
1
56.5
7
56.3
7
55.8
4
56.8
2
56.4
4
56.2
2
54.7
6
54.7
9
54.6
5
55.4
8
55.1
1
55.0
8
57.8
3
57.7
6
57.7
9
58.2
3
58.3
9
58.6
6
59.1
0
58.9
3
58.5
4
59.7
8
59.4
0
59.1
0
58.4
4
58.4
8
58.6
9
59.7
2
59.3
0
59.3
1
62.1
9
62.3
8
62.7
7
64.5
7
64.4
6
64.5
6
64.4
0
64.3
9
64.1
7
64.7
6
64.4
9
64.4
7
59.7
2
59.6
4
59.8
8
59.7
7
59.4
8
59.4
0
59.2
0
59.2
8
59.4
0
59.3
6
Turnover Ratio %
Time Period: 1/1/2011 to 12/31/2014
6/2012 12/2012 6/2013 12/2013 6/2014 12/2014
31%
42%
53%
64%
75%
Common Holdings
Portfolio Date
OfriaGlobalAllocationFund
FTSEWorldTR USD
US OEWorldAllocation
7/31/2015
10/31/2015 0.31
10/31/2015 0.08 0.12
Ofria Global Allocation Fund
FTSE World TR USD
US OE World Allocation
Positively Correlated Negatively Correlated
Source: Morningstar Direct

Comprehensive Product Review Ofria Global Allocation FundŒ
ÙÙÙÙ
Historical Factor Exposure
Time Period: 10/1/2014 to 9/30/2015
Expo
sure
Size
Exposure Size
-0.25
-0.20
-0.15
-0.10
-0.05
0.00
0.05
0.10
10/31/2014 11/30/2014 12/31/2014 1/31/2015 2/28/2015 3/31/2015 4/30/2015 5/31/2015 6/30/2015 7/31/2015 8/31/2015 9/30/2015
Price to Fair Value Price to Book Value Price to Cash Flow
Price to Earnings Price to Sales Profit Margin
Dividend Yield Return on Equity
Factor Exposure
As of Date : 7/31/2015
Expo
sure
Size
Exposure Size
-0.30
-0.20
-0.10
0.00
0.10
0.20
Price to Fair Value Price to Book Value Price to Cash Flow Price to Earnings Price to Sales Profit Margin Dividend Yield Return on Equity Revenue Growth Net Income Growth FCF Growth Sustainable Growth Current Ratio Financial Leverage Debt to Equity
Valuation Profitability GrowthFinancial Health
Source: Morningstar Direct
Comprehensive Product Review Ofria Global Allocation FundŒ
ÙÙÙÙ
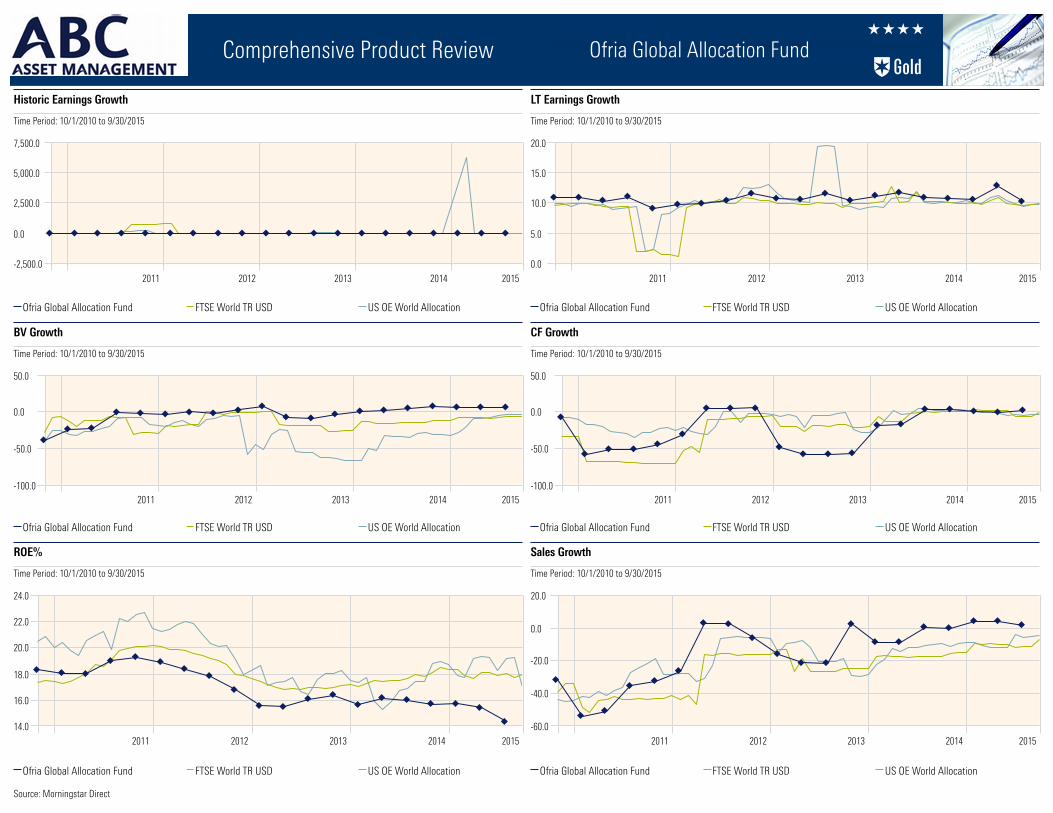
BV Growth
Time Period: 10/1/2010 to 9/30/2015
2011 2012 2013 2014 2015-100.0
-50.0
0.0
50.0
Ofria Global Allocation Fund FTSE World TR USD US OE World Allocation
Historic Earnings Growth
Time Period: 10/1/2010 to 9/30/2015
2011 2012 2013 2014 2015
-2,500.0
0.0
2,500.0
5,000.0
7,500.0
Ofria Global Allocation Fund FTSE World TR USD US OE World Allocation
CF Growth
Time Period: 10/1/2010 to 9/30/2015
2011 2012 2013 2014 2015-100.0
-50.0
0.0
50.0
Ofria Global Allocation Fund FTSE World TR USD US OE World Allocation
LT Earnings Growth
Time Period: 10/1/2010 to 9/30/2015
2011 2012 2013 2014 2015
0.0
5.0
10.0
15.0
20.0
Ofria Global Allocation Fund FTSE World TR USD US OE World Allocation
ROE%
Time Period: 10/1/2010 to 9/30/2015
2011 2012 2013 2014 2015
14.0
16.0
18.0
20.0
22.0
24.0
Ofria Global Allocation Fund FTSE World TR USD US OE World Allocation
Sales Growth
Time Period: 10/1/2010 to 9/30/2015
2011 2012 2013 2014 2015
-60.0
-40.0
-20.0
0.0
20.0
Ofria Global Allocation Fund FTSE World TR USD US OE World Allocation
Source: Morningstar Direct

Comprehensive Product Review Ofria Global Allocation FundŒ
ÙÙÙÙ
Price / Earnings
Time Period: 10/1/2010 to 9/30/2015
2011 2012 2013 2014 201510.0
12.0
14.0
16.0
18.0
Ofria Global Allocation Fund FTSE World TR USD US OE World Allocation
Price / Sales
Time Period: 10/1/2010 to 9/30/2015
2011 2012 2013 2014 20150.8
1.0
1.2
1.4
Ofria Global Allocation Fund FTSE World TR USD US OE World Allocation
Price / Book
Time Period: 10/1/2010 to 9/30/2015
2011 2012 2013 2014 20151.4
1.6
1.8
2.0
2.2
Ofria Global Allocation Fund FTSE World TR USD US OE World Allocation
Price / Cash Flow
Time Period: 10/1/2010 to 9/30/2015
2011 2012 2013 2014 20154.0
5.0
6.0
7.0
8.0
Ofria Global Allocation Fund FTSE World TR USD US OE World Allocation
Dividend Yield
Time Period: 10/1/2010 to 9/30/2015
2011 2012 2013 2014 2015
1.5
2.3
3.0
3.8
4.5
Ofria Global Allocation Fund FTSE World TR USD US OE World Allocation
Return on Invested Capital
Time Period: 10/1/2010 to 9/30/2015
2011 2012 2013 2014 2015
5.0
10.0
15.0
20.0
Ofria Global Allocation Fund FTSE World TR USD US OE World Allocation
Source: Morningstar Direct

Comprehensive Product Review Ofria Global Allocation FundŒ
ÙÙÙÙ
Net Margin %
Time Period: 10/1/2010 to 9/30/2015
2011 2012 2013 2014 201510.0
12.0
14.0
16.0
18.0
Ofria Global Allocation Fund FTSE World TR USD US OE World Allocation
Debt-to-Capital
Time Period: 10/1/2010 to 9/30/2015
2011 2012 2013 2014 2015
25.0
30.0
35.0
40.0
Ofria Global Allocation Fund FTSE World TR USD US OE World Allocation
Return on Assets
Time Period: 10/1/2010 to 9/30/2015
2011 2012 2013 2014 2015
4.0
6.0
8.0
10.0
Ofria Global Allocation Fund FTSE World TR USD US OE World Allocation
Price / Free Cash Flow
Time Period: 10/1/2010 to 9/30/2015
2011 2012 2013 2014 2015-20.0
0.0
20.0
40.0
60.0
Ofria Global Allocation Fund FTSE World TR USD US OE World Allocation
Cash Return %
Time Period: 10/1/2010 to 9/30/2015
2011 2012 2013 2014 2015-200.0
-100.0
0.0
100.0
200.0
Ofria Global Allocation Fund FTSE World TR USD US OE World Allocation
Style Consistency Metric
Time Period: 10/1/2010 to 9/30/2015
2011 2012 2013 2014 20150.0
5.0
10.0
15.0
20.0
Ofria Global Allocation Fund FTSE World TR USD US OE World Allocation
Source: Morningstar Direct

Comprehensive Product Review Ofria Global Allocation FundŒ
ÙÙÙÙ
Trailing Returns
As of Date: 9/30/2015 Peer Group: Open End Funds - U.S. - World Allocation
YTD 1 Year 3 Years % Rank 5 Years 10 Years Since Inception Inception Date
Ofria Global Allocation Fund
FTSE World TR USD
US OE World Allocation
10/21/1994
12/31/1993
4/1/1970-5.68% -6.46% 1.78% 3.06% 3.37% 9.41%
-3.81%
-6.33%
-4.40%
-5.79%
4.38%
8.02%
4.67%
7.84%
5.75%
5.30%
8.86%
6.98%
39
1
78
Retu
rn
YTD 1 Year 3 Years 5 Years 10 Years Since Inception-22.5%-20.0%-17.5%-15.0%-12.5%-10.0%-7.5%-5.0%-2.5%0.0%2.5%5.0%7.5%10.0%
-10.0%
-5.0%
0.0%
5.0%
10.0%
2009 2010 2011 2012 2013 YTD
15.0%
20.0%
25.0%
Ofria Global Allocation Fund FTSE World TR USD US OE World Allocation
Calendar Year Returns
Peer Group: Open End Funds - U.S. - World Allocation
2010 % Rank 2011 % Rank 2012 % Rank 2013 % Rank 2014 % Rank YTD % Rank
Ofria Global Allocation
FTSE World TR USD
US OE World Allocatio10.95% -3.67% 10.18% 8.46% 1.50% -1.76%
9.85%
12.73%
-3.71%
-6.48%
10.01%
16.96%
14.43%
24.67%
1.87%
4.77%
0.41%
1.06%
73 59 76 41 51 24
32 77 8 2 12 14
57 59 73 74 57 65
Longest Up-Streak # of Periods
Longest Up-Streak Return
Longest Up-Streak Start Date
Longest Down-Streak End Date
Longest Down-Streak # of Periods
Longest Down-Streak Return
Longest Down-Streak Start Date
Longest Down-Streak End Date
Max Drawdown # of Periods
Max Drawdown
Max Drawdown Peak Date
Max Drawdown Valley Date
5.00
7.57
2/1/2014
5.00
-8.93
5/1/2015
9/30/2015
9/30/2015
5.00
-12.93
5/1/2011
9/30/2011
5.00
11.88
12/1/2010
4.00
-8.26
6/1/2015
9/30/2015
9/30/2015
5.00
-13.71
5/1/2011
9/30/2011
6.00
14.26
11/1/2012
5.00
-20.24
5/1/2011
9/30/2011
9/30/2011
5.00
-20.24
5/1/2011
9/30/2011
Performance
Time Period: 10/1/2010 to 9/30/2015
Investment Benchmark Cat Avg
Annualized Return
Cumulative Return
Std Dev
Sharpe Ratio
Sortino Ratio
Calmar Ratio
3.06
3.06
8.40
0.24
4.67
4.67
8.73
0.56
0.86
0.34
7.84
7.84
13.01
0.64
1.00
0.39
0.39
0.58
Best Month
Worst Month
Best Quarter
Worst Quarter
Up Period Percent
Down Period Percent
Average Gain
Average Loss
Gain Std Dev
Loss Std Dev
6.40
-7.07
6.67
-10.49
58.33
41.67
1.86
-1.96
4.85
5.84
7.26
-7.83
8.09
-10.87
58.33
41.67
2.02
-1.87
5.27
6.16
10.68
-9.23
12.02
-17.25
60.00
40.00
3.05
-2.89
7.75
8.85
Relative PerformanceExcess Return
Alpha
Beta
R2
Tracking Error
Information Ratio (arith)
Treynor Ratio (geo)
Up Capture Ratio
Down Capture Ratio
Up Number Ratio
Down Number Ratio
Up Percent Ratio
Down Percent Ratio
-3.17
-0.56
0.65
94.87
4.92
-0.64
7.06
62.89
65.04
0.89
0.88
0.03
0.83
0.00
0.00
1.00
100.00
0.00
7.78
100.00
100.00
1.00
1.00
0.00
0.00
-4.78
-1.94
0.63
94.85
5.20
-0.92
4.78
57.92
68.43
0.89
0.88
0.00
0.83
Source: Morningstar Direct
Comprehensive Product Review Ofria Global Allocation FundŒ
ÙÙÙÙ
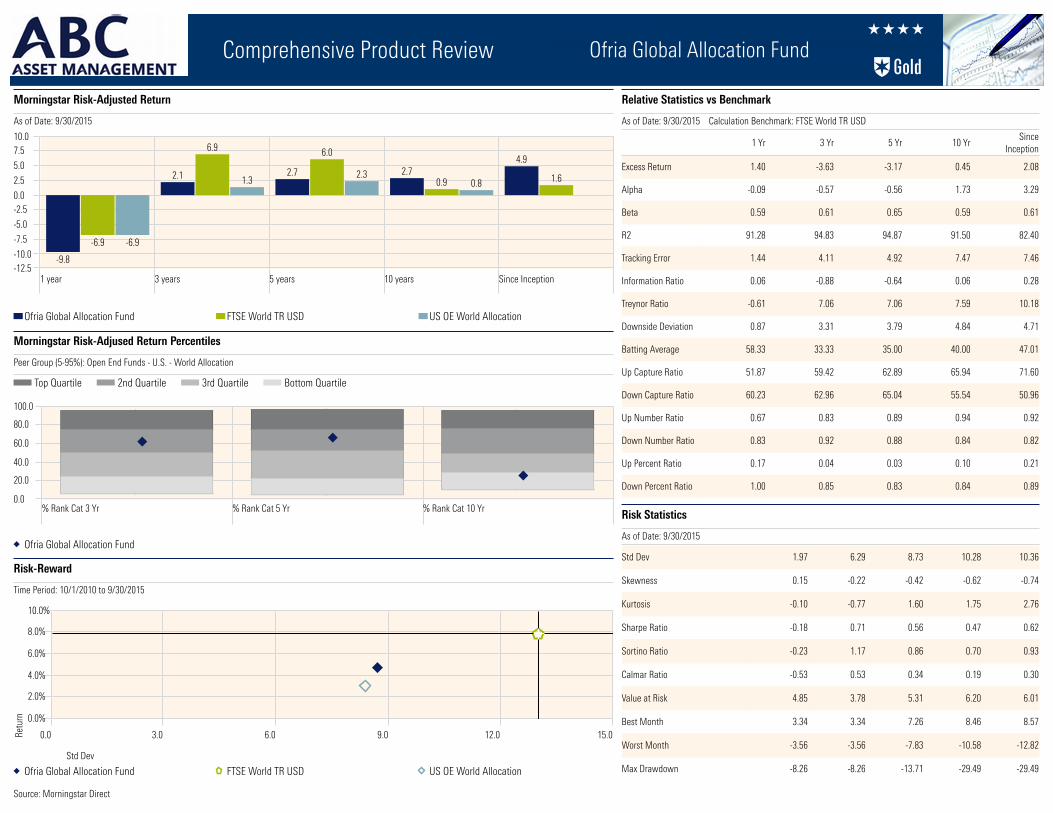
Morningstar Risk-Adjusted Return
As of Date: 9/30/2015
1 year 3 years 5 years 10 years Since Inception-12.5-10.0
-7.5
-5.0
-2.50.0
2.5
5.0
7.510.0
-9.8
2.1 2.7 2.74.9
-6.9
6.9 6.0
0.9 1.6
-6.9
1.32.3
0.8
Ofria Global Allocation Fund FTSE World TR USD US OE World Allocation
Morningstar Risk-Adjused Return Percentiles
Peer Group (5-95%): Open End Funds - U.S. - World Allocation
Top Quartile 2nd Quartile 3rd Quartile Bottom Quartile
0.0
20.0
40.0
60.0
80.0
% Rank Cat 3 Yr % Rank Cat 5 Yr % Rank Cat 10 Yr
100.0
Ofria Global Allocation Fund
Risk-Reward
Time Period: 10/1/2010 to 9/30/2015
Retu
rn
Std Dev
0.0 3.0 6.0 9.0 12.0 15.0
0.0%
2.0%
4.0%
6.0%
8.0%
10.0%
Ofria Global Allocation Fund FTSE World TR USD US OE World Allocation
Relative Statistics vs Benchmark
As of Date: 9/30/2015 Calculation Benchmark: FTSE World TR USD
1 Yr 3 Yr 5 Yr 10 YrSince
Inception
Excess Return
Alpha
Beta
R2
Tracking Error
Information Ratio
Treynor Ratio
Downside Deviation
Batting Average
Up Capture Ratio
Down Capture Ratio
Up Number Ratio
Down Number Ratio
Up Percent Ratio
Down Percent Ratio
1.40
-0.09
0.59
91.28
1.44
0.06
-0.61
0.87
58.33
51.87
60.23
0.67
0.83
0.17
1.00
-3.63
-0.57
0.61
94.83
4.11
-0.88
7.06
3.31
33.33
59.42
62.96
0.83
0.92
0.04
0.85
-3.17
-0.56
0.65
94.87
4.92
-0.64
7.06
3.79
35.00
62.89
65.04
0.89
0.88
0.03
0.83
0.45
1.73
0.59
91.50
7.47
0.06
7.59
4.84
40.00
65.94
55.54
0.94
0.84
0.10
0.84
2.08
3.29
0.61
82.40
7.46
0.28
10.18
4.71
47.01
71.60
50.96
0.92
0.82
0.21
0.89
Risk Statistics
As of Date: 9/30/2015
Std Dev
Skewness
Kurtosis
Sharpe Ratio
Sortino Ratio
Calmar Ratio
Value at Risk
Best Month
Worst Month
Max Drawdown
1.97
0.15
-0.10
-0.18
-0.23
-0.53
4.85
3.34
-3.56
-8.26
6.29
-0.22
-0.77
0.71
1.17
0.53
3.78
3.34
-3.56
-8.26
8.73
-0.42
1.60
0.56
0.86
0.34
5.31
7.26
-7.83
-13.71
10.28
-0.62
1.75
0.47
0.70
0.19
6.20
8.46
-10.58
-29.49
10.36
-0.74
2.76
0.62
0.93
0.30
6.01
8.57
-12.82
-29.49
Source: Morningstar Direct

Comprehensive Product Review Ofria Global Allocation FundŒ
ÙÙÙÙ
Rolling Return
Time Period: 10/1/2010 to 9/30/2015
Rolling Window: 3 Years 1 Month shift
Retu
rn
09 10 11 12
2014
01 02 03 04 05 06 07 08 09 10 11 12
2015
01 02 03 04 05 06 07 08 09-2.5
0.0
2.5
5.0
7.5
10.0
12.5
15.0
17.5
20.0
6.9 6.87.8
6.65.6 5.8 5.6
4.65.7
6.76.2
8.2
10.5
7.88.7 8.6
7.0 7.1 6.87.9
10.1
8.4 8.0
6.1
4.4
11.4 11.5
13.0
10.9
8.79.4 9.7
8.6
10.1
11.4 11.5
15.2
17.7
14.1
15.815.2
12.5 12.711.7
13.2
16.7
14.0 13.9
10.5
8.0
Ofria Global Allocation Fund FTSE World TR USD US OE World Allocation
Total Return
As of Date: 9/30/2015
1 year 3 years 5 years 10 years Since Inception-8.0
-6.0
-4.0
-2.0
0.0
2.0
4.0
6.0
8.0
10.0
12.0
-4.4
4.4 4.75.7
8.9
-5.8
8.0 7.8
5.3
7.0
-6.5
1.83.1 3.4
9.4
Source: Morningstar Direct

Comprehensive Product Review Ofria Global Allocation FundŒ
ÙÙÙÙ
Rolling Standard Deviation
Time Period: 10/1/2010 to 9/30/2015
Rolling Window: 3 Years 1 Month shift
Retu
rn
09 10 11 12
2014
01 02 03 04 05 06 07 08 09 10 11 12
2015
01 02 03 04 05 06 07 08 09
-2.5
0.0
2.5
5.0
7.5
10.0
12.5
15.0
17.5
20.0
6.9 6.87.8
6.65.6 5.8 5.6
4.6
5.76.7
6.2
8.2
10.5
7.88.7 8.6
7.0 7.1 6.8
7.9
10.1
8.4 8.0
6.1
4.4
11.4 11.5
13.0
10.9
8.79.4 9.7
8.6
10.1
11.4 11.5
15.2
17.7
14.1
15.815.2
12.5 12.711.7
13.2
16.7
14.0 13.9
10.5
8.0
Ofria Global Allocation Fund FTSE World TR USD US OE World Allocation
Standard Deviation
As of Date: 9/30/2015
1 year 3 years 5 years 10 years Since Inception0.0
2.0
4.0
6.0
8.0
10.0
12.0
14.0
16.0
18.0
6.8 6.3
8.710.3 10.4
11.110.0
13.0
16.715.3
6.7 6.78.4
11.1 10.9
Source: Morningstar Direct

Comprehensive Product Review Ofria Global Allocation FundŒ
ÙÙÙÙ
Rolling Alpha
Time Period: 10/1/2010 to 9/30/2015
Rolling Window: 3 Years 1 Month shift
S O N D
2014
J F M A M J J A S O N D
2015
J F M A M J J A S
-7.00
-6.00
-5.00
-4.00
-3.00
-2.00
-1.00
0.00
1.00
-4.86 -5.05-4.78 -4.86
-4.26 -4.32-4.71
-5.12-4.86 -4.87
-5.74
-6.44
-4.76-5.19
-4.96-4.76
-3.44 -3.51
-2.88
-2.08
-0.48
-0.98-1.42
-1.64
-2.51
Ofria Global Allocation Fund US OE World Allocation
Alpha
As of Date: 9/30/2015
1 year 3 years 5 years 10 years Since Inception-7.50
-6.75
-6.00
-5.25
-4.50
-3.75
-3.00
-2.25
-1.50
-0.75
0.00
0.75
1.50
2.25
3.00
-4.25
-2.51
-4.28
0.92
2.26
-6.43
-5.19 -5.41
-1.75
0.73
Source: Morningstar Direct

Comprehensive Product Review Ofria Global Allocation FundŒ
ÙÙÙÙ
Rolling Beta
Time Period: 10/1/2010 to 9/30/2015
Rolling Window: 3 Years 1 Month shift
S O N D
2014
J F M A M J J A S O N D
2015
J F M A M J J A S
-0.20
0.00
0.20
0.40
0.60
0.80
1.00
1.20
0.67 0.67 0.67 0.67 0.67 0.67 0.67 0.67 0.66 0.66 0.67 0.690.66 0.65 0.66 0.65 0.62 0.62 0.62 0.62 0.61 0.62 0.62 0.61 0.61
1.00 1.00 1.00 1.00 1.00 1.00 1.00 1.00 1.00 1.00 1.00 1.00 1.00 1.00 1.00 1.00 1.00 1.00 1.00 1.00 1.00 1.00 1.00 1.00 1.00
Ofria Global Allocation Fund FTSE World TR USD US OE World Allocation
Beta
As of Date: 9/30/2015
1 year 3 years 5 years 10 years Since Inception0.00
0.10
0.20
0.30
0.40
0.50
0.60
0.70
0.80
0.90
1.00
1.10
0.59 0.610.65
0.59 0.61
1.00 1.00 1.00 1.00 1.00
0.590.65 0.63 0.65
Source: Morningstar Direct

Comprehensive Product Review Ofria Global Allocation FundŒ
ÙÙÙÙ
Rolling Tracking Error
Time Period: 10/1/2010 to 9/30/2015
Rolling Window: 3 Years 1 Month shift
S O N D
2014
J F M A M J J A S O N D
2015
J F M A M J J A S
-0.8
0.0
0.8
1.5
2.3
3.0
3.8
4.5
5.3
6.0
4.7 4.8 4.8 4.8 4.9 5.0 4.9 4.9 4.9 4.94.5
4.3 4.34.2 4.2 4.1
4.6 4.7 4.6 4.7 4.7 4.7 4.75.1 5.1
Ofria Global Allocation Fund US OE World Allocation
Tracking Error
As of Date: 9/30/2015
1 year 3 years 5 years 10 years Since Inception0.00
0.75
1.50
2.25
3.00
3.75
4.50
5.25
6.00
6.75
7.50
8.25
9.00
6.53
5.09 4.93
7.46
8.37
6.25
5.37 5.26
6.29
7.91
Source: Morningstar Direct
Comprehensive Product Review Ofria Global Allocation FundŒ
ÙÙÙÙ
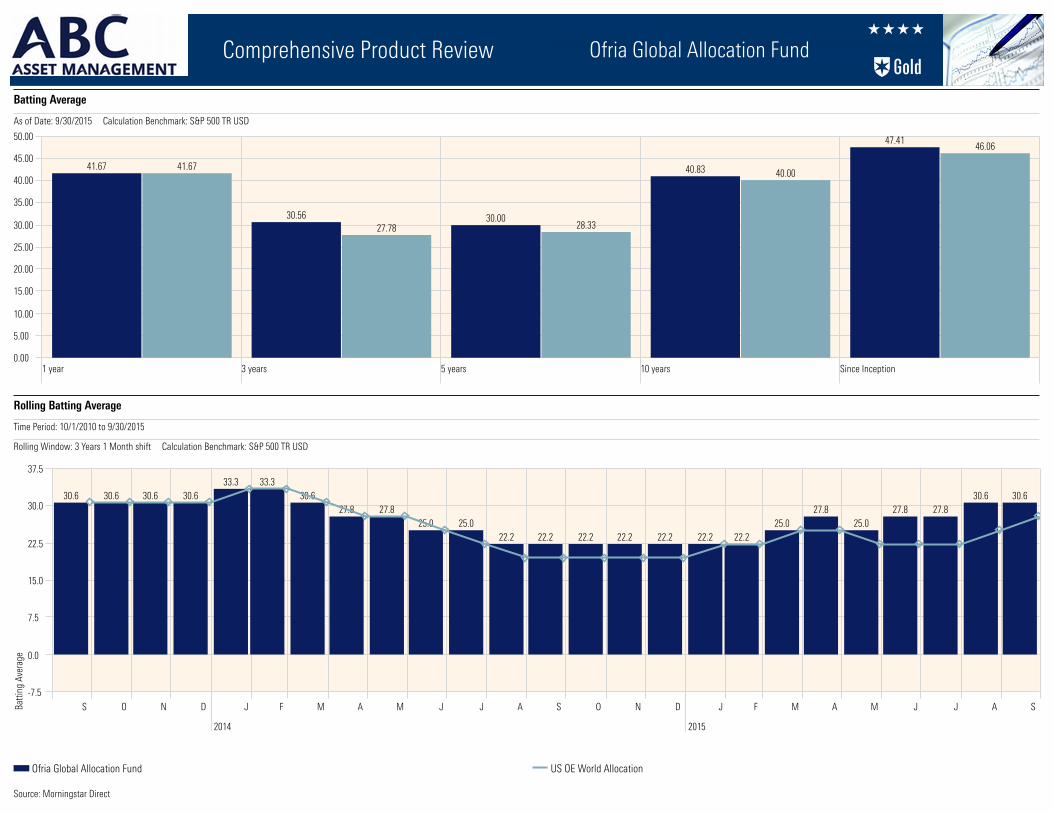
Rolling Batting Average
Time Period: 10/1/2010 to 9/30/2015
Rolling Window: 3 Years 1 Month shift Calculation Benchmark: S&P 500 TR USD
Batti
ng A
vera
ge
S O N D
2014
J F M A M J J A S O N D
2015
J F M A M J J A S-7.5
0.0
7.5
15.0
22.5
30.0
37.5
30.6 30.6 30.6 30.633.3 33.3
30.627.8 27.8
25.0 25.022.2 22.2 22.2 22.2 22.2 22.2 22.2
25.027.8
25.027.8 27.8
30.6 30.6
Ofria Global Allocation Fund US OE World Allocation
Batting Average
As of Date: 9/30/2015 Calculation Benchmark: S&P 500 TR USD
1 year 3 years 5 years 10 years Since Inception0.00
5.00
10.00
15.00
20.00
25.00
30.00
35.00
40.00
45.00
50.00
41.67
30.56 30.00
40.83
47.41
41.67
27.78 28.33
40.00
46.06
Source: Morningstar Direct

Comprehensive Product Review Ofria Global Allocation FundŒ
ÙÙÙÙ
Rolling Upside Capture
Time Period: 10/1/2010 to 9/30/2015
Rolling Window: 3 Years 1 Month shift
Up C
aptu
re R
atio
09 10 11 12
2014
01 02 03 04 05 06 07 08 09 10 11 12
2015
01 02 03 04 05 06 07 08 09
-20.0
0.0
20.0
40.0
60.0
80.0
61.5 60.6 61.8 60.7 61.5 61.4 60.0 57.6 57.8 57.9 57.9 57.4 57.453.7 53.5 56.2 53.0 52.5 54.8 56.7 56.1 55.5 53.3 52.5 51.4
Ofria Global Allocation Fund US OE World Allocation
Upside Capture
As of Date: 9/30/2015 Calculation Benchmark: S&P 500 TR USD
1 year 3 years 5 years 10 years Since Inception0.00
5.00
10.00
15.00
20.00
25.00
30.00
35.00
40.00
45.00
50.00
55.00
60.00
65.00
70.00
41.18
51.42
56.44
65.85 67.09
34.14
45.54
51.25
64.7468.14
Source: Morningstar Direct

Comprehensive Product Review Ofria Global Allocation FundŒ
ÙÙÙÙ
Rolling Downside Capture
Time Period: 10/1/2010 to 9/30/2015
Rolling Window: 3 Years 1 Month shift
Dow
n Ca
ptur
e Ra
tio
09 10 11 12
2014
01 02 03 04 05 06 07 08 09 10 11 12
2015
01 02 03 04 05 06 07 08 09-20.0
0.0
20.0
40.0
60.0
80.0
100.0
120.0
87.8 87.8 87.8 87.8 84.8 84.8 84.8 84.8 82.5 82.288.4
92.9 88.6 88.683.7
90.6
78.1 78.1 76.0 72.865.4 68.6 68.6 66.2
70.9
Ofria Global Allocation Fund US OE World Allocation
Upside Capture
As of Date: 9/30/2015 Calculation Benchmark: S&P 500 TR USD
1 year 3 years 5 years 10 years Since Inception0.00
7.50
15.00
22.50
30.00
37.50
45.00
52.50
60.00
67.50
75.00
82.50
90.00
68.9770.85
81.05
59.32
51.79
76.18
84.52 84.39
71.24
55.22
Source: Morningstar Direct

Comprehensive Product Review Ofria Global Allocation FundŒ
ÙÙÙÙ
Selection Effect
Time Period: 10/1/2014 to 9/30/2015
-2.00 -1.00 0.00 1.00 2.00
-0.36
-0.01
-0.42
-0.01
-0.12
1.28
-0.19
-0.04
-0.61
0.17
-0.86
Active Return
Time Period: 10/1/2014 to 9/30/2015
-2.00 -1.00 0.00 1.00 2.00
-0.34
-0.10
-0.27
-0.01
0.13
1.19
-0.49
-0.37
-0.69
0.17
-1.29
Attribution Total
Time Period: 10/1/2014 to 9/30/2015
Allocation Effect
Selection Effect
Active Return
Portfolio Return
Benchmark Return
Relative Return
-0.90
-1.17
-2.07
-7.89
-5.81
-2.07
Relative Weights
Time Period: 10/1/2014 to 9/30/2015
Utilities
Technology
Real Estate
Industrials
Healthcare
Financial Services
Energy
Consumer Defensive
Consumer Cyclical
Communication Services
Basic Materials
-10.00 -5.00 0.00 5.00
-1.06
-6.78
-0.83
-4.17
-3.97
-8.83
-2.42
-6.72
-5.52
-2.13
-1.25
Allocation Effect
Time Period: 10/1/2014 to 9/30/2015
-1.00 -0.50 0.00 0.50
0.02
-0.10
0.15
0.00
0.25
-0.09
-0.30
-0.33
-0.08
0.00
-0.43
Time Period: 1/1/2013 to 12/31/2013
-2.00 -1.00 0.00 1.00 2.00
-0.01
-0.43
-0.14
0.78
1.19
0.98
0.24
0.44
-0.39
-0.04
-0.79
Time Period: 1/1/2012 to 12/31/2012
-1.50 -0.75 0.00 0.75
0.31
-0.69
0.28
-0.11
0.22
-0.18
-0.76
-0.06
-0.18
-0.18
-1.08
Time Period: 1/1/2014 to 12/31/2014
-2.00 -1.00 0.00 1.00
-0.07
-1.49
-0.04
-0.48
0.57
-0.05
-0.10
-0.05
-0.07
0.12
-0.94
Time Period: 1/1/2013 to 12/31/2013
Allocation Effect
Selection Effect
Active Return
Portfolio Return
Benchmark Return
Relative Return
0.39
1.30
1.69
26.48
24.79
1.69
Time Period: 1/1/2012 to 12/31/2012
Allocation Effect
Selection Effect
Active Return
Portfolio Return
Benchmark Return
Relative Return
-1.48
-0.94
-2.43
14.77
17.19
-2.43
Time Period: 1/1/2014 to 12/31/2014
Allocation Effect
Selection Effect
Active Return
Portfolio Return
Benchmark Return
Relative Return
-0.34
-2.20
-2.54
2.26
4.80
-2.54
Time Period: 1/1/2013 to 12/31/2013
-1.50 -0.75 0.00 0.75 1.50
0.04
-0.20
-0.29
0.78
0.68
1.06
0.39
0.22
-0.22
-0.15
-0.59
Time Period: 1/1/2012 to 12/31/2012
-1.50 -0.75 0.00 0.75
0.39
-0.59
0.36
-0.13
0.11
0.38
-0.17
-0.16
0.09
-0.12
-1.12
Time Period: 1/1/2014 to 12/31/2014
-1.50 -1.00 -0.50 0.00 0.50
-0.09
-1.26
-0.03
-0.41
0.14
-0.06
0.03
0.05
-0.16
0.10
-0.64
Time Period: 1/1/2013 to 12/31/2013
Utilities
Technology
Real Estate
Industrials
Healthcare
Financial Services
Energy
Consumer Defensive
Consumer Cyclical
Communication Services
Basic Materials
-10.00 -5.00 0.00 5.00
-1.07
-5.34
-1.53
-4.74
-2.01
-8.21
-2.91
-6.84
-5.59
-0.82
-2.29
Time Period: 1/1/2012 to 12/31/2012
Utilities
Technology
Real Estate
Industrials
Healthcare
Financial Services
Energy
Consumer Defensive
Consumer Cyclical
Communication Services
Basic Materials
-15.00 -10.00 -5.00 0.00 5.00
-1.19
-3.10
-1.46
-5.57
-1.71
-9.80
-1.78
-7.51
-6.14
-0.20
-2.62
Time Period: 1/1/2014 to 12/31/2014
Utilities
Technology
Real Estate
Industrials
Healthcare
Financial Services
Energy
Consumer Defensive
Consumer Cyclical
Communication Services
Basic Materials
-10.00 -5.00 0.00 5.00
-1.03
-5.77
-0.81
-2.97
-2.27
-7.61
-3.16
-6.12
-4.86
-1.85
-0.81
Time Period: 1/1/2013 to 12/31/2013
-0.50 0.00 0.50 1.00
-0.05
-0.23
0.16
0.01
0.51
-0.07
-0.15
0.22
-0.17
0.11
-0.20
Time Period: 1/1/2012 to 12/31/2012
-0.75 -0.50 -0.25 0.00 0.25
-0.08
-0.10
-0.08
0.02
0.11
-0.56
-0.59
0.10
-0.26
-0.06
0.03
Time Period: 1/1/2014 to 12/31/2014
-0.50 0.00 0.50 1.00
0.02
-0.24
-0.01
-0.07
0.43
0.01
-0.13
-0.10
0.09
0.02
-0.30
Source: Morningstar Direct
Comprehensive Product Review Ofria Global Allocation FundŒ
ÙÙÙÙ
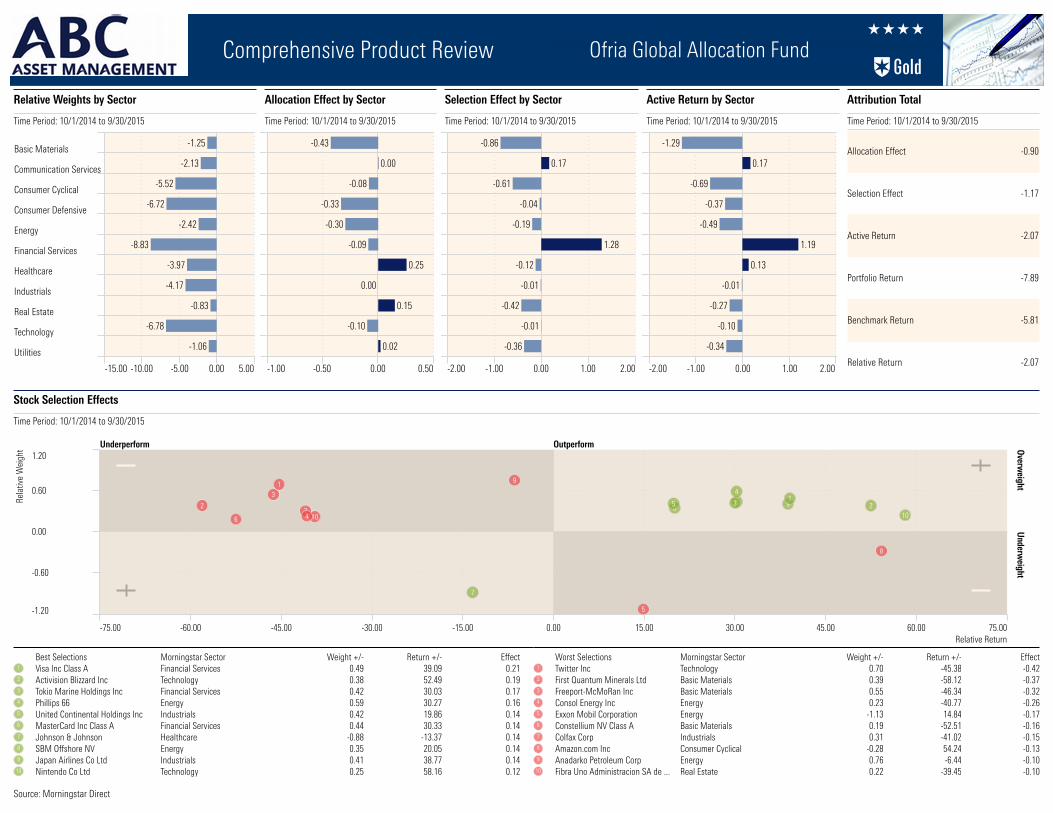
Selection Effect by Sector
Time Period: 10/1/2014 to 9/30/2015
-2.00 -1.00 0.00 1.00 2.00
-0.86
0.17
-0.61
-0.04
-0.19
1.28
-0.12
-0.01
-0.42
-0.01
-0.36
Active Return by Sector
Time Period: 10/1/2014 to 9/30/2015
-2.00 -1.00 0.00 1.00 2.00
-1.29
0.17
-0.69
-0.37
-0.49
1.19
0.13
-0.01
-0.27
-0.10
-0.34
Attribution Total
Time Period: 10/1/2014 to 9/30/2015
Allocation Effect
Selection Effect
Active Return
Portfolio Return
Benchmark Return
Relative Return
-0.90
-1.17
-2.07
-7.89
-5.81
-2.07
Relative Weights by Sector
Time Period: 10/1/2014 to 9/30/2015
Basic Materials
Communication Services
Consumer Cyclical
Consumer Defensive
Energy
Financial Services
Healthcare
Industrials
Real Estate
Technology
Utilities
-15.00 -10.00 -5.00 0.00 5.00
-1.25
-2.13
-5.52
-6.72
-2.42
-8.83
-3.97
-4.17
-0.83
-6.78
-1.06
Allocation Effect by Sector
Time Period: 10/1/2014 to 9/30/2015
-1.00 -0.50 0.00 0.50
-0.43
0.00
-0.08
-0.33
-0.30
-0.09
0.25
0.00
0.15
-0.10
0.02
Stock Selection Effects
Time Period: 10/1/2014 to 9/30/2015
Underperform Outperform Overweight
Underw
eightRe
lativ
e W
eigh
t
Relative Return
1.20
0.60
0.00
-0.60
-1.20
-75.00 -60.00 -45.00 -30.00 -15.00 0.00 15.00 30.00 45.00 60.00 75.00
10
9
8
76
5
4
3
2
1
10
98
7
65
4
3 21
Best Selections Morningstar Sector Weight +/- Return +/- Effect1 Visa Inc Class A Financial Services 0.49 39.09 0.212 Activision Blizzard Inc Technology 0.38 52.49 0.193 Tokio Marine Holdings Inc Financial Services 0.42 30.03 0.174 Phillips 66 Energy 0.59 30.27 0.165 United Continental Holdings Inc Industrials 0.42 19.86 0.146 MasterCard Inc Class A Financial Services 0.44 30.33 0.147 Johnson & Johnson Healthcare -0.88 -13.37 0.148 SBM Offshore NV Energy 0.35 20.05 0.149 Japan Airlines Co Ltd Industrials 0.41 38.77 0.1410 Nintendo Co Ltd Technology 0.25 58.16 0.12
Worst Selections Morningstar Sector Weight +/- Return +/- Effect1 Twitter Inc Technology 0.70 -45.38 -0.422 First Quantum Minerals Ltd Basic Materials 0.39 -58.12 -0.373 Freeport-McMoRan Inc Basic Materials 0.55 -46.34 -0.324 Consol Energy Inc Energy 0.23 -40.77 -0.265 Exxon Mobil Corporation Energy -1.13 14.84 -0.176 Constellium NV Class A Basic Materials 0.19 -52.51 -0.167 Colfax Corp Industrials 0.31 -41.02 -0.158 Amazon.com Inc Consumer Cyclical -0.28 54.24 -0.139 Anadarko Petroleum Corp Energy 0.76 -6.44 -0.1010 Fibra Uno Administracion SA de ... Real Estate 0.22 -39.45 -0.10
Source: Morningstar Direct

Comprehensive Product Review Ofria Global Allocation FundŒ
ÙÙÙÙ
Selection Effect by Country
Time Period: 10/1/2014 to 9/30/2015
Australia
Austria
Belgium
Brazil
Canada
Chile
China
Cyprus
Czech Republic
Denmark
Finland
France
Germany
Greece
Hong Kong
Hungary
India
Ireland
Israel
Italy
Japan
Kazakhstan
Luxembourg
Macao
Malaysia
Malta
Mexico
Netherlands
New Zealand
Norway
Poland
Portugal
Russian Federation
Singapore
South Africa
South Korea
Spain
Sri Lanka
Sweden
Switzerland
Taiwan
Thailand
Turkey
United Arab Emirates
United Kingdom
United States
-2.25 -1.50 -0.75 0.00 0.75
-0.01
0.01
0.10
-0.81
-0.35
-0.02
-0.07
-0.27
-0.02
-0.01
0.11
-0.43
0.01
-0.04
0.01
0.01
0.06
0.01
-0.06
-0.02
-0.01
-0.03
-0.03
0.13
0.01
0.11
-0.36
-1.54
Active Return by Country
Time Period: 10/1/2014 to 9/30/2015
-2.25 -1.50 -0.75 0.00 0.75
0.34
0.00
0.00
0.14
-0.68
0.00
-0.29
-0.03
0.00
-0.09
0.01
-0.14
-0.18
0.03
-0.02
0.00
0.02
-0.02
0.00
0.11
-0.03
-0.07
0.00
0.01
0.07
0.00
-0.02
0.01
0.01
-0.01
0.04
0.05
0.01
-0.15
0.06
0.09
0.15
0.01
-0.02
0.13
0.05
0.11
0.03
0.08
-0.28
-1.58
Relative Weights by Country
Time Period: 10/1/2014 to 9/30/2015
Australia
Austria
Belgium
Brazil
Canada
Chile
China
Cyprus
Czech Republic
Denmark
Finland
France
Germany
Greece
Hong Kong
Hungary
India
Ireland
Israel
Italy
Japan
Kazakhstan
Luxembourg
Macao
Malaysia
Malta
Mexico
Netherlands
New Zealand
Norway
Poland
Portugal
Russian Federation
Singapore
South Africa
South Korea
Spain
Sri Lanka
Sweden
Switzerland
Taiwan
Thailand
Turkey
United Arab Emirates
United Kingdom
United States
-40.00 -20.00 0.00 20.00
-2.52
-0.08
-0.42
-0.40
-1.80
0.00
0.39
0.01
-0.02
-0.57
-0.32
-0.75
-1.86
-0.03
-0.48
-0.02
0.35
-0.10
-0.09
-0.39
0.81
0.05
-0.03
-0.03
-0.30
-0.01
-0.27
-0.47
-0.07
0.09
-0.17
0.00
-0.02
0.07
-0.84
-1.04
-1.12
-0.02
-0.83
-1.68
-1.14
-0.13
-0.17
0.08
-4.04
-23.39
Allocation Effect by Country
Time Period: 10/1/2014 to 9/30/2015
-0.20 0.00 0.20 0.40 0.60
0.35
0.00
-0.02
0.03
0.13
0.00
0.06
-0.03
0.00
-0.08
0.01
-0.07
0.09
0.03
0.00
0.00
0.02
-0.02
0.01
0.00
0.40
-0.07
0.00
0.01
0.07
0.00
0.02
-0.01
0.01
-0.03
0.04
0.00
0.00
-0.09
0.08
0.10
0.18
0.01
0.01
-0.01
0.04
0.00
0.03
0.08
0.08
-0.04
Source: Morningstar Direct

Comprehensive Product Review Ofria Global Allocation FundŒ
ÙÙÙÙ
Selection Effect by Stock Rating
Time Period: 10/1/2014 to 9/30/2015
Ù
ÙÙ
ÙÙÙ
ÙÙÙÙ
ÙÙÙÙÙ
-1.00 -0.50 0.00 0.50
0.02
0.24
-0.64
0.20
0.04
Selection Effect by Economic Moat
Time Period: 10/1/2014 to 9/30/2015
Narrow
None
Wide
-1.50 -0.75 0.00 0.75 1.50
-0.73
-0.55
0.62
Active Return by Stock Rating
Time Period: 10/1/2014 to 9/30/2015
-1.00 -0.50 0.00 0.50
-0.03
-0.10
-0.73
0.37
-0.26
Active Return by Economic Moat
Time Period: 10/1/2014 to 9/30/2015
-1.00 -0.50 0.00 0.50
-0.77
-0.81
0.27
Relative Weights by Morningstar Stock Rating
Time Period: 10/1/2014 to 9/30/2015
Ù
ÙÙ
ÙÙÙ
ÙÙÙÙ
ÙÙÙÙÙ
-30.00 -20.00 -10.00 0.00 10.00
-0.31
-5.11
-18.89
-14.26
0.21
Relative Weights by Economic Moat
Time Period: 10/1/2014 to 9/30/2015
Narrow
None
Wide
-22.50 -15.00 -7.50 0.00 7.50
-15.36
-5.10
-18.45
Allocation Effect by Stock Rating
Time Period: 10/1/2014 to 9/30/2015
-0.40 -0.20 0.00 0.20 0.40
-0.05
-0.34
-0.09
0.16
-0.31
Allocation Effect by Economic Moat
Time Period: 10/1/2014 to 9/30/2015
-0.40 -0.20 0.00 0.20
-0.03
-0.27
-0.36
Source: Morningstar Direct

Comprehensive Product Review Ofria Global Allocation FundŒ
ÙÙÙÙ
Double Dip
Time Period: 5/1/2011 to 9/30/2011
5/2011 6/2011 7/2011 8/2011 9/201177.5
80.0
82.5
85.0
87.5
90.0
92.5
95.0
97.5
100.0
102.5
Ofria Global Allocation Fund FTSE World TR USD US OE World Allocation
Time Period: 5/1/2011 to 10/31/2011 Calculation Benchmark: FTSE World TR USD
Return Std DevExcessReturn
Ofria Global Allocation Fund
FTSE World TR USD
US OE World Allocation -7.36 15.50
-7.44
-11.73
17.30
24.00
4.28
0.00
4.37
Recovery
Time Period: 3/1/2009 to 4/30/2011
4/2009 7/2009 10/2009 1/2010 4/2010 7/2010 10/2010 1/2011 4/2011100.0
120.0
140.0
160.0
180.0
200.0
220.0
Ofria Global Allocation Fund FTSE World TR USD US OE World Allocation
Time Period: 3/1/2009 to 4/30/2011 Calculation Benchmark: FTSE World TR USD
Return Std DevExcessReturn
Ofria Global Allocation Fund
FTSE World TR USD
US OE World Allocation 25.97 10.98
23.67
38.07
10.69
18.13
-14.41
0.00
-12.10
Credit Crunch
Time Period: 8/1/2007 to 2/28/2009
11/2007 2/2008 5/2008 8/2008 11/2008 2/200947.5
55.0
62.5
70.0
77.5
85.0
92.5
100.0
107.5
115.0
Ofria Global Allocation Fund FTSE World TR USD US OE World Allocation
Time Period: 8/1/2007 to 2/28/2009 Calculation Benchmark: FTSE World TR USD
Return Std DevExcessReturn
Ofria Global Allocation Fund
FTSE World TR USD
US OE World Allocation -24.03 16.46
-15.31
-35.46
14.22
22.68
20.15
0.00
11.43
Easy Money Recovery
Time Period: 4/1/2003 to 7/31/2007
7/2003 1/2004 7/2004 1/2005 7/2005 1/2006 7/2006 1/2007 7/2007100.0
120.0
140.0
160.0
180.0
200.0
220.0
240.0
260.0
Ofria Global Allocation Fund FTSE World TR USD US OE World Allocation
Time Period: 4/1/2003 to 7/31/2007 Calculation Benchmark: FTSE World TR USD
Return Std DevExcessReturn
Ofria Global Allocation Fund
FTSE World TR USD
US OE World Allocation 16.41 6.12
19.99
22.34
7.31
8.88
-2.35
0.00
-5.93
Time Period: 4/1/2000 to 3/31/2003 Calculation Benchmark: FTSE World TR USD
Return Std DevExcessReturn
Ofria Global Allocation Fund
FTSE World TR USD
US OE World Allocation -4.13 9.07
-0.48
-17.27
12.33
16.40
16.79
0.00
13.14
Dot-Com Bust
Time Period: 4/1/2000 to 3/31/2003
6/2000 9/2000 12/2000 3/2001 6/2001 9/2001 12/2001 3/2002 6/2002 9/2002 12/2002 3/200355.0
62.5
70.0
77.5
85.0
92.5
100.0
107.5
115.0
Ofria Global Allocation Fund FTSE World TR USD US OE World Allocation
Irrational Exuberance
Time Period: 9/1/1998 to 3/31/2000
12/1998 3/1999 6/1999 9/1999 12/1999 3/2000100.0
107.5
115.0
122.5
130.0
137.5
145.0
152.5
160.0
Ofria Global Allocation Fund FTSE World TR USD US OE World Allocation
Time Period: 9/1/1998 to 3/31/2000 Calculation Benchmark: FTSE World TR USD
Return Std DevExcessReturn
Ofria Global Allocation Fund
FTSE World TR USD
US OE World Allocation 22.62 8.97
25.31
33.56
10.44
13.82
-8.25
0.00
-10.94
Source: Morningstar Direct