COMBUSTION OF SOLID FUEL SLABS WITH GASEOUS OXYGEN … · NASA-CR-201116 // COMBUSTION OF SOLID...
14
NASA-CR-201116 // COMBUSTION OF SOLID FUEL SLABS WITH GASEOUS OXYGEN IN A HYBRID MOTOR ANALOG Martin J. Chiaverini, George C. Haning, Yeu-Cherng Lu. Kenneth K. Kuo Nadir Serin, and David K. Johnson Department of Mechanical Engineenng, The Pennsyivama State University University Park, PA 16802 ABSTRACT Using a high-pressure, two-dimensional hybrid motor, an experimental invesugation was conducted on fundamental processes involved in hybrid rocket combustion. HTPB (Hydroxyl--terminated Polybutadiene) fuel moss-linked with diisocyanate was burned with GOX under various operating conditions. Large-amplitude pressure oscillations were encountered in earlier test runs. After identifying the soerce of instability and decoupling the COX feed-line system and combustion chamber, the pressure oscillations were drastically reduced from +90% of the localized mean pressure to an acceptable range of +1.5%. Embedded fine-wire thermocouples indicated that the surface temperature of the burning fuel was around 1000 K depending upon axial locations and operating conditions. Also, except near the leading--edge region, the subsurface thermal wave profiles in the upstream locations are thicker than those in the downstream locations since the solid-fuel regression rate, in general, increases with distance along the fuel slab. The recovered solid fuel slabs in the laminar portion of the boundary layer exhibited smooth surfaces, indicating the existence of a liquid melt layer on the burning fuel surface in the upstream region. After the transition section, which displayed distinct transverse striations, the surface roughness pattern became quite random and very pronounced in the downstream turbulent boundary-layer region. Both real-time X-ray radiography and ultrasonic pulse--ecbo techniques were used to determine the instantaneous web thicknesses and instantaneous solid-fuel regression rates over certain portions of the fuel slabs. Globally averaged and axially dependent but time-averaged regression rates were also obtained and presented. Several tests were conducted using, simultaneously, one translucent fuel slab and one fuel slab processed with carbon black powder. The addition of carbon black did not affect the measured regression rates or surface temperatures in comparison to the translucent fuel slabs. INTRODUCTION Hybrid rocket systems offer several advantages over their liquid and solid rocket counterparts that make them attractive alternatives for commercial and military applications. First, hybrid rockets reqmre only half as much feed- system hardware as liquid propellant rockets, and therefore display improved reliability. Second, since they are much less sensitive to cracks and imperfections in solid fuel grains, hybrid rockets have safety advantages over solid propellant rockets. Third, hybrid rockets can be throttled for thrust control, maneuvering, and motor shutdown and restart. In addition, solid fuels are safer than solid propellants for manufacture, transportation, and storage. From a performance standpoint, hybrid rockets, in general, have specific impulse greater than solid rockets and density impulse greater than liquid bi-propeilant rockets 1. The key parameter in the study of hybrid rocket propulsion is the solid fuel regression rate and its dependence on various operating conditions. Many different regression rate models have been developed in order to explain the dependence of regression rate on operating conditions and flow parameters. In the early 1960's, Marxman and Gilbert 2 developed a regression rate model under the assumption that hybrid combustion is controlled by heat transfer from the flame zone to the solid fuel surface. Applying a two-zone boundary-layer model and utilizing a flame sheet to bridge the two zones, they found that the diffusion flame should be situated between 10-20% of the boundary-layer thickness above the fuel surface. Their regression rate equation was able to predict the axial dependence of a Plexiglas/GOX system when compared to experimental data which showed a minimum regression rate at a certain axial position in a circular port combustor. This minimum was attributed to the axial variations of total mass flux and Reynolds number based upon axial length. The review article by Muzzy 3 also presents a heat- transfer dominated regression behavior. Smoot and Price 4 studied the behavior of several polymer fuels in a laboratory-scale slab burner using combined fluorine and oxygen as an oxidizer. At low mass fluxes (G~I0 Kg/m 2- s), the regression rates were found to be independent of pressure but dependent on G to the 0.8 power. The 0.8 power dependency was explained by turbulent flow relationships in circular ducts. At high mass fluxes (G-120 Kg/m2-s) and/or low pressures, the regression rates were found to be nearly independent of mass flux but strongly Approved for public release; distribution unlirmted. https://ntrs.nasa.gov/search.jsp?R=19960033268 2018-07-16T18:27:04+00:00Z
Transcript of COMBUSTION OF SOLID FUEL SLABS WITH GASEOUS OXYGEN … · NASA-CR-201116 // COMBUSTION OF SOLID...
NASA-CR-201116 //
COMBUSTION OF SOLID FUEL SLABS WITH GASEOUS OXYGEN
IN A HYBRID MOTOR ANALOG
Martin J. Chiaverini, George C. Haning, Yeu-Cherng Lu. Kenneth K. KuoNadir Serin, and David K. Johnson
Department of Mechanical Engineenng, The Pennsyivama State UniversityUniversity Park, PA 16802
ABSTRACT
Using a high-pressure, two-dimensional hybrid motor, an experimental invesugation was conducted onfundamental processes involved in hybrid rocket combustion. HTPB (Hydroxyl--terminated Polybutadiene) fuelmoss-linked with diisocyanate was burned with GOX under various operating conditions. Large-amplitude pressureoscillations were encountered in earlier test runs. After identifying the soerce of instability and decoupling the COXfeed-line system and combustion chamber, the pressure oscillations were drastically reduced from +90% of thelocalized mean pressure to an acceptable range of +1.5%. Embedded fine-wire thermocouples indicated that thesurface temperature of the burning fuel was around 1000 K depending upon axial locations and operating conditions.Also, except near the leading--edge region, the subsurface thermal wave profiles in the upstream locations are thickerthan those in the downstream locations since the solid-fuel regression rate, in general, increases with distance alongthe fuel slab. The recovered solid fuel slabs in the laminar portion of the boundary layer exhibited smooth surfaces,indicating the existence of a liquid melt layer on the burning fuel surface in the upstream region. After the transitionsection, which displayed distinct transverse striations, the surface roughness pattern became quite random and very
pronounced in the downstream turbulent boundary-layer region. Both real-time X-ray radiography and ultrasonicpulse--ecbo techniques were used to determine the instantaneous web thicknesses and instantaneous solid-fuel
regression rates over certain portions of the fuel slabs. Globally averaged and axially dependent but time-averagedregression rates were also obtained and presented. Several tests were conducted using, simultaneously, onetranslucent fuel slab and one fuel slab processed with carbon black powder. The addition of carbon black did notaffect the measured regression rates or surface temperatures in comparison to the translucent fuel slabs.
INTRODUCTION
Hybrid rocket systems offer several advantages over their liquid and solid rocket counterparts that make themattractive alternatives for commercial and military applications. First, hybrid rockets reqmre only half as much feed-system hardware as liquid propellant rockets, and therefore display improved reliability. Second, since they are muchless sensitive to cracks and imperfections in solid fuel grains, hybrid rockets have safety advantages over solidpropellant rockets. Third, hybrid rockets can be throttled for thrust control, maneuvering, and motor shutdown andrestart. In addition, solid fuels are safer than solid propellants for manufacture, transportation, and storage. From aperformance standpoint, hybrid rockets, in general, have specific impulse greater than solid rockets and density
impulse greater than liquid bi-propeilant rockets 1.
The key parameter in the study of hybrid rocket propulsion is the solid fuel regression rate and itsdependence on various operating conditions. Many different regression rate models have been developed in order toexplain the dependence of regression rate on operating conditions and flow parameters. In the early 1960's, Marxman
and Gilbert 2 developed a regression rate model under the assumption that hybrid combustion is controlled by heat
transfer from the flame zone to the solid fuel surface. Applying a two-zone boundary-layer model and utilizing aflame sheet to bridge the two zones, they found that the diffusion flame should be situated between 10-20% of theboundary-layer thickness above the fuel surface. Their regression rate equation was able to predict the axialdependence of a Plexiglas/GOX system when compared to experimental data which showed a minimum regressionrate at a certain axial position in a circular port combustor. This minimum was attributed to the axial variations of
total mass flux and Reynolds number based upon axial length. The review article by Muzzy 3 also presents a heat-
transfer dominated regression behavior. Smoot and Price 4 studied the behavior of several polymer fuels in a
laboratory-scale slab burner using combined fluorine and oxygen as an oxidizer. At low mass fluxes (G~I0 Kg/m 2-
s), the regression rates were found to be independent of pressure but dependent on G to the 0.8 power. The 0.8
power dependency was explained by turbulent flow relationships in circular ducts. At high mass fluxes (G-120
Kg/m2-s) and/or low pressures, the regression rates were found to be nearly independent of mass flux but strongly
Approved for public release; distribution unlirmted.
https://ntrs.nasa.gov/search.jsp?R=19960033268 2018-07-16T18:27:04+00:00Z
dependent on pressure. They attributed this pressure dependence to the rate-limiting chemical kinetic processes.Experimental data indicates that the regression rate may exhibit a dependence on pressure at either very high or verylow mass fluxes. In the very low mass-flux regime, radiative heat transfer may account for the pressure dependence;however, at the very high mass-flux regime, reaction kinetics may become the rate-limiting mechanism. Some
researchers 5 believed that the gas-phase reactions represent the rate-limiting step, while others 6 attributed the rate-
limiting step to heterogeneous reactions at the fuel surface.
The presence of so many different types of models and correlations gives strong justification for obtainingmore detailed experimental data for model validation. A more fundamental understanding of the complex processesinvolved in hybrid combustion is definitely needed in order to resolve the differences among various approaches andto develop a comprehensive theory. Furthermore, development of more reliable and accurate regression-ratecorrelations with applicability to broad ranges of operating conditions is needed for assisting the design of large-scalehybrid motors. Despite numerous investigations, very limited information exists concerning several pertinentphenomena, such as detailed reaction mechanisms between the gaseous oxidizers and decomposed fuel species, effectof ambient chemical species on solid-fuel pyrolysis processes, burning solid-fuel surface characteristics as functionsof flow conditions, dependency of subsurface thermal wave profile on thermal properties of solid fuels, andinfluence of chamber operating conditions on instantaneous solid-fuel regression rates.
In an attempt to achieve fundamental understanding of some of these important issues, an experimentalstudy on the fuel decomposition and boundary-layer combustion processes in hybrid rocket motors has beenconducted at PSU. A high-pressure slab motor was designed and manufactured for conducting experimentalinvestigations. Oxidizer (GOX) is injected through the head-end of the test chamber. In this paper, all reported dataoriginates from experiments conducted using Hydroxyl--terminated Polybutadiene (HTPB) fuel consisting of R---45Msupplied by Elf Atochem North America, and a cross-linking agent, Isonate 143L, supplied by Dow Chemical. Inaddition, several tests were conducted with fuel slabs processed with carbon black (0.25% weight) having a meanparticle size of 75 nm. The carbon black acts as an opacifier to prevent in-depth radiation absorption. Fuel slabswere processed at PSU with fine-wire thermocouples embedded at various locations before curing. The study focuseson the following objectives: non-intrusive measurement of instantaneous and average solid fuel regression rateunder various operating conditions including GOX flux level, motor pressure, and fuel formulation, determination ofthe solid-fuel surface temperatures and subsurface temperature profiles as a function of both operating conditions andaxial location, and characterization of surface structure of the recovered solid fuel samples. The influence of carbonblack powder as an opecifying agent on solid fuel regression rate and surface temperature was also examined. Theproblem of severe pressure oscillations in the motor was encountered early in the study and is addressed in thisarticle.
EXPERIMENTAL FACILITY
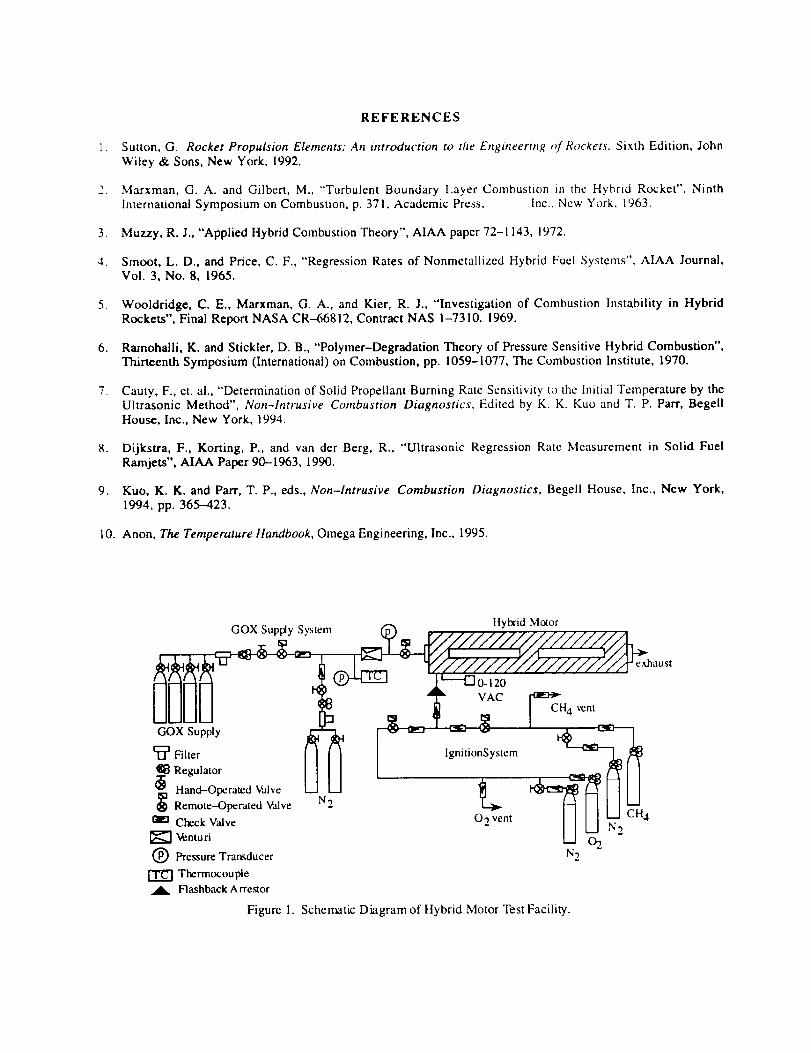
Figure I shows a schematic diagram of the overall hybrid test rig, including a 2-D stab motor, a GOXsupply system, and an ignition system. A computer code was developed to assist the design of the test motor. Thecode utilized a time--dependent continuity equation coupled with a chemical equilibrium code (CET-86) to determinefuel regression rate, oxidizer-to-fuel mass ratio, chamber pressure, and gas temperature. In order to meet the properrange of test conditions, parametric studies were conducted to determine the effect of oxidizer flow rate, nozzlediameter, test time, and fuel composition on motor operating characteristics. Based upon the results of theparametric study, a windowed 2-D hybrid motor was designed. The main body of the motor was constructed ofstainless steel and weighed approximately 315.5 kg (700 Ibs). It was designed to operate at up to 1300 psi.
Gaseous oxygen can be injected at realistic flux levels of about 1.0 Ib/in2-s. The motor has an overall length of
1,067 mm, width of 178 mm, and height of 254 mm. The motor can be operated with either two opposing fuelslabs or one fuel slab with an opposing inert slab. The fuel slabs are 584 mm (23 in) long and 76 mm (3 in) wide.HTPB slabs processed at PSU can have a maximum usable web thickness of 20.5 mm (0.81 in), allowing an initialgap of 6.4 mm (0.25 in) between the slabs. For all tests conducted in this study, an initial gap of 12.7 mm (0.5 in)was used. The operating chamber pressure of the motor was partially controlled using interchangeable graphite exitnozzles.
The gaseous oxygen supply system consisted of a main feed line and a nitrogen purge line. Remotelyoperated ball valves were used to initiate and terminate the flow of oxygen, while a critical flow venturi was used tomaintain a steady mass flow of GOX through the main line. The GOX flow rate was determined using the measureddata from an upstream thermocouple and two pressure transducers located on either side of the venturi. For a giventest, the flow rate was preset by adjusting the throat area of the venturi and the regulator setting of GOX supply line.
Filtersin theGOXandnitrogensupplylineswereemployedtopreventanycontaminationof the system.
The ignition system consisted of a pair of high-pressure gaseous oxygen/methane pre-mixed torches and apair of solid-propellant sticks to produce pilot flames in the upstream region of the solid fuel slabs. Flashbackarrestors were used to prevent the occurrence of flame flashback in the pre-mixed sections of the igniter lines. The,otid-propellant sticks were ignited electrically using nichrome wires connected to an AC transformer. Remotelyoperated solenoid valves were used to control the flow of oxygen and methane. Check valves and vents wereinstalled in order to prevent the contamination of the gas bottles and any over pressurization of the system. Gaseousnitrogen was used to purge the ignition system after each test. After the initial system check-out tests, it wasdetermined that successful ignition could be achieved using only the pilot flames generated by the solid-propellantsticks without activating the CH4/O2 torches. Thereafter, the ignition gas-supply lines were used primarily as an
auxiliary nitrogen purge system, which was activated at the end of each test.
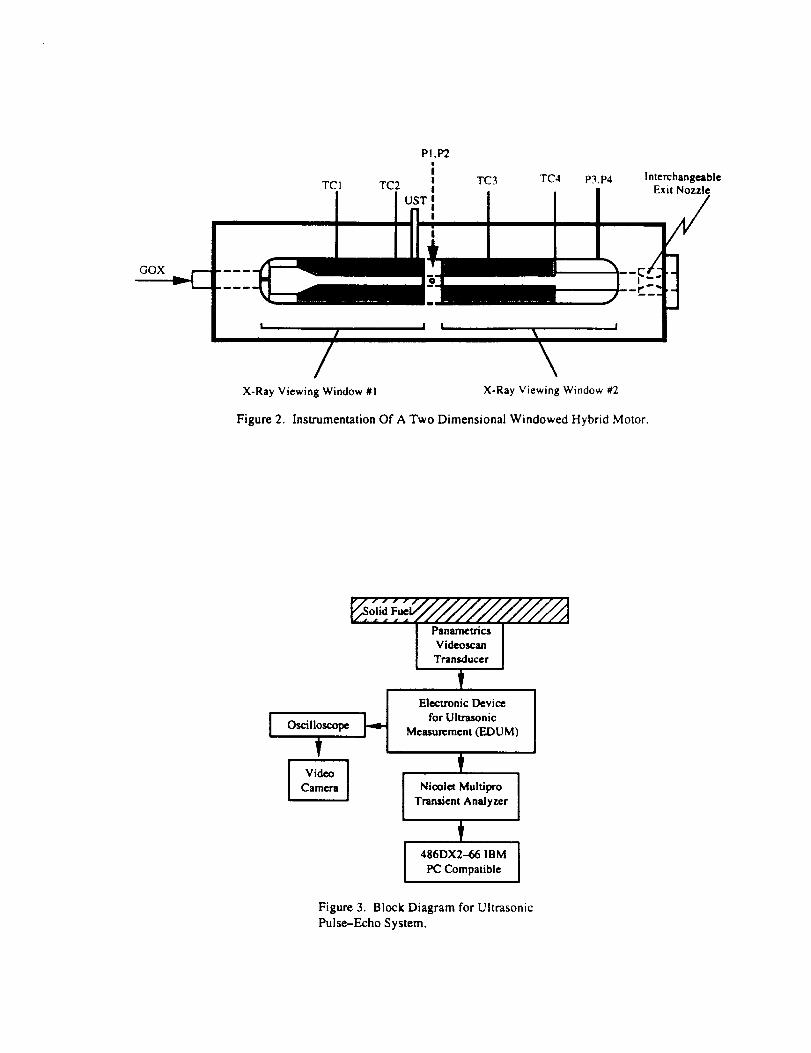
The motor (part of which is shown in Figure 2) has two sets of opposing windows. Each window is 280mm (I 1 in) long by 44.5 mm (1.75 in) wide for real time X-ray radiography of the solid fuel regression phenomena.The motor was instrumented with a variety of diagnostic devices for determination of chamber pressure variations,subsurface thermal profile at various axial locations, burning fuel surface temperature distribution, and instantaneousweb thickness of solid fuel slabs. Figure 2 shows the approximate locations of four of the seven thermocouples(TC), the pressure transducers (P) and the ultrasonic transducer (UST) in the instrumented motor. Other diagnostictools, not included in this paper, can be utilized for measurement of gas velocity, flame temperature, and speciesconcentrations at desired axial locations along the motor.
Static motor pressures were measured using 205 and 206 Setra pressure transducers, while several high-frequency Kistler 601B ! transducers measured dynamic motor pressures. An array of 25 lam fine-wire thermocouples(Pt/Pt-lO%Rh) was embedded in the top fuel slab in order to measure solid-fuel subsurface temperature profiles andsurface temperatures. The thermocouples were placed at pre-determined depths at several axial locations along thecenterline of the fuel slab. The globally averaged solid-fuel regression rate was determined by weighing the fuelslabs before and after each test. In addition, the time-averaged, axially--dependent regression rate was deduced bymeasuring the pre- and post-firing fuel slab web thickness with a caliper at many axial stations.
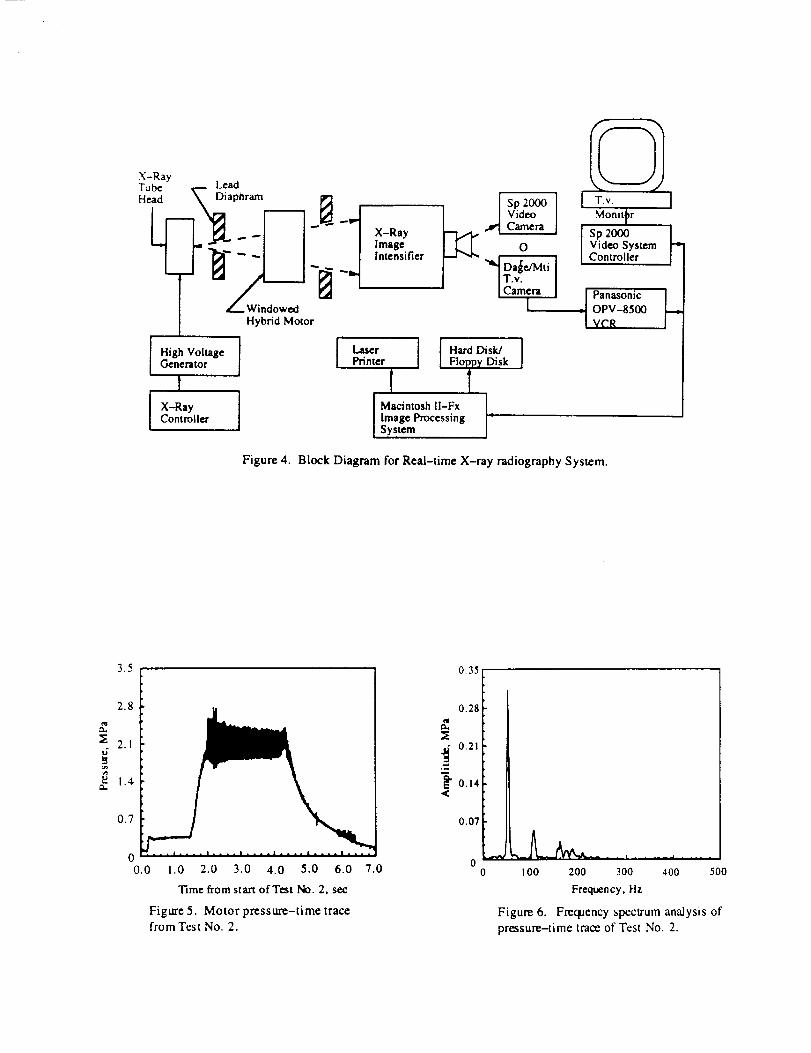
The instantaneous solid fuel regression rate was obtained using two independent techniques: ultrasonicpulse--echo analysis and real-time X-ray radiography. Figure 3 is a block diagram showing major components ofthe ultrasonic pulse-echo system. A I Mhz-3/4" Panametfics Videoscan ultrasonic transducer (V114-RM) wasplaced behind the fuel slab within a fuel sample holder. The axial position of the transducer was selected from one offour locations. The transducer emits and receives ultrasound signals, and was connected directly to the ElectronicDevice for Ultrasonic Measurement (EDUM), supplied by ONERA, France. An oscilloscope was connected to theEDUM to provide a real-time visual record of the ultrasonic transducer signal, which was recorded on a video cameraduring each test run. At the same time, the ultrasonic signal was recorded by the data acquisition unit (NicoletMultipro Transient Analyzer). Through a pre-test calibration procedure, the ultrasonic voltage signal was convertedto the propagation time of the ultrasound pulse. The propagation time represents the time required for the pulse totravel from the transducer, through the fuel slab to the burning solid-fuel surface, and back to the transducer. As thefuel regressed, the propagation time of the ultrasound pulse decreased continuously due to the reduction of fuel webthickness. References 7 and 8 present in detail the operating principles of the ultrasonic pulse-echo method.
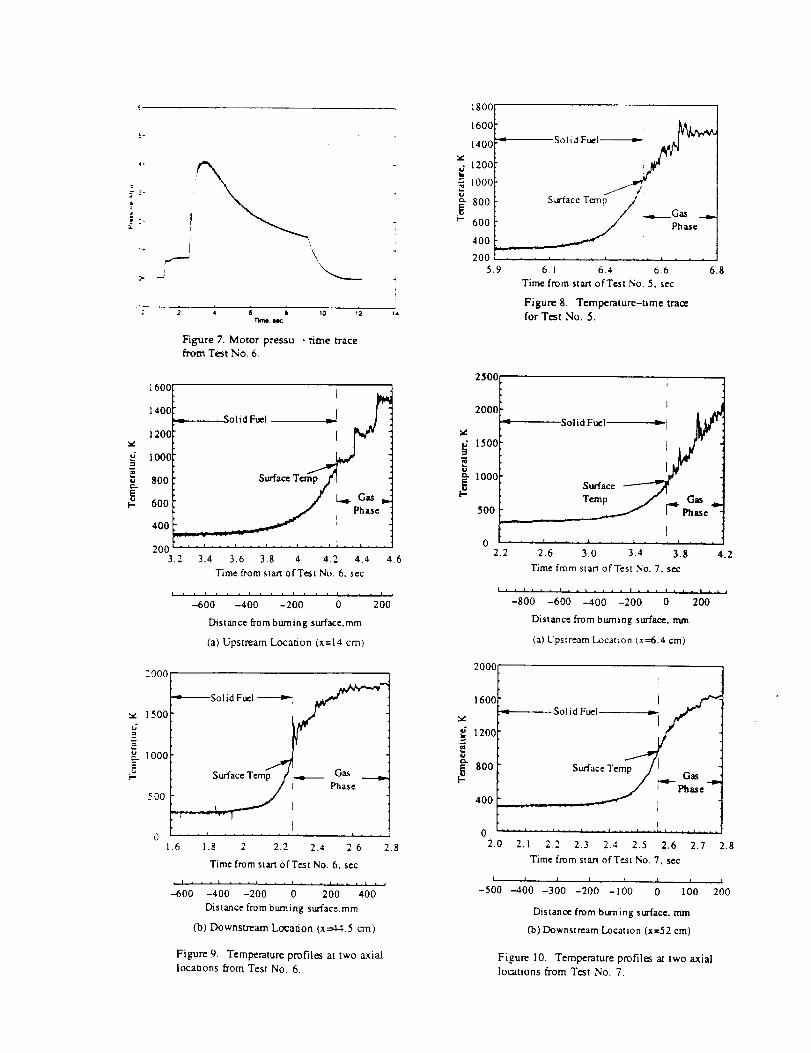
Figure 4 shows the schematic diagram of the real-time X-ray radiography system. During the test, an X-ray tube head emitted high--energy photons which passed through the LEXAN/MXB-360 window assemblies of themotor and then impinged on an image intensifier. Inside the motor, a portion of the X-ray photon energy wasabsorbed by the solid fuel when X-ray photons passed through the fuel slab region; however, the photons whichpassed through the port area experience little absorption. Because of this difference in the attenuation of the X-rayphotons, the X-ray images displayed contrasting bright and dark regions, which showed the port area and fuel slabs,respectively. The instantaneous fuel web thickness was then deduced from these images. The principles of X-raydiagnostics of condensed phase combustion processes are given in Ref. 9.
DISCUSSION OF RESULTS
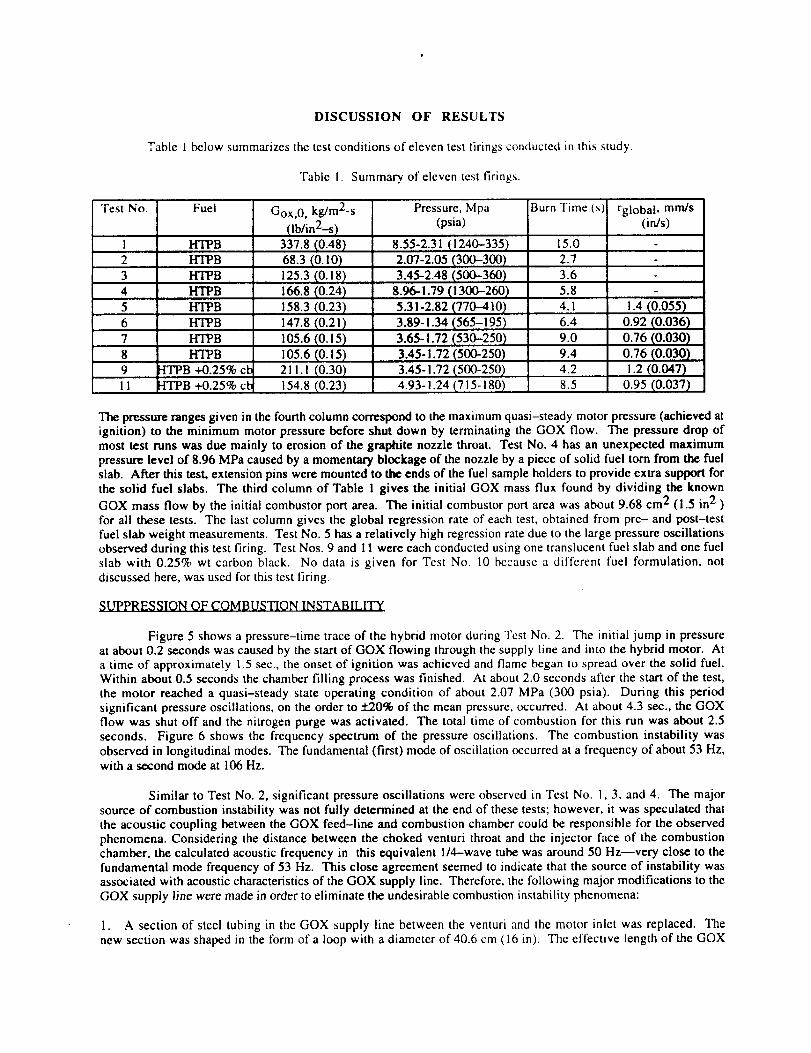
Table 1 below summarizes the test conditions of eleven test firings conducted in this study.
"Fable I. Summary of eleven test firings.
Test No.
1 HTPB
2 HTPB
3 HTPB
4 l-rrPB5 HTPB
11
H'I_B
HTPB
HTPB
Fuel
166.8
158.3
147.8
105.6
105.6
-ITPB +0.25% cb 211. !HTPB +0.25% cb 154.8
Gox,0, kg/m2-s
Qb/in2--s)
337.8 (0.48)
68.3 (0.10)
125.3(0.18)(0.24)(0.23)(o.21)(o.15)(o.15)(0.30)(0.23)
Pressure, Mpa(psia)
8.55-2.31 (I 240-335)
2.07-2.05 (31XI-300)3.45-2.48 (500-360)
8.96-1.79 (1300-260)
5.31-2.82 (770-410)
3.89-1.34 (565-195)
3.65-1.72 (530-250)
3.45-1.72 (500-250)3.45-1.72 (500-250)
4.93- ! .24 (715-180)
Burn Time (s)
15.02.7
3.6
5.8
4.1
6.49.0
9.4
4.2
8.5
rgloba 1, mrrds(in/s)
1.4 (0.055)
0.92 (0.036)0.76 (0.030)0.76 (0.030)
!.2 (0.047)0.95 (0.037)
The pressure ranges given in the fourth column correspond to the maximum quasi-steady motor pressure (achieved atignition) to the minimum motor pressure before shut down by terminating the GOX flow. The pressure drop ofmost test runs was due mainly to erosion of the graphite nozzle throat. Test No. 4 has an unexpected maximumpressure level of 8.96 MPa caused by a momentary blockage of the nozzle by a piece of solid fuel torn from the fuelslab. After this test, extension pins were mounted to the ends of the fuel sample holders to provide extra support forthe solid fuel slabs. The third column of Table 1 gives the initial GOX mass flux found by dividing the known
GOX mass flow by the initial combustor port area. The initial combustor port area was about 9.68 cm 2 (i.5 in 2 )for all these tests. The last column gives the global regression rate of each test, obtained from pre- and post-testfuel slab weight measurements. Test No. 5 has a relatively high regression rate due to the large pressure oscillationsobserved during this test firing. Test Nos. 9 and 11 were each conducted using one translucent fuel slab and one fuelslab with 0.25% wt carbon black. No data is given for Test No. 10 because a different fuel formulation, not
discussed here, was used for this test firing.
SUPPRESSION OF COMBUSTION INSTABILITY
Figure 5 shows a pressure-time trace of the hybrid motor during Test No. 2. The initial jump in pressureat about 0.2 seconds was caused by the start of GOX flowing through the supply line and into the hybrid motor. Ata time of approximately 1.5 see., the onset of ignition was achieved and flame began to spread over the solid fuel.Within about 0.5 seconds the chamber filling process was finished. At about 2.0 seconds after the start of the test,the motor reached a quasi-steady state operating condition of about 2.07 MPa (300 psia). During this periodsignificant pressure oscillations, on the order to +90% of the mean pressure, occurred. At about 4.3 see., the GOXflow was shut off and the nitrogen purge was activated. The total time of combustion for this run was about 2.5seconds. Figure 6 shows the frequency spectrum of the pressure oscillations. The combustion instability wasobserved in longitudinal modes. The fundamental (first) mode of oscillation occurred at a frequency of about 53 Hz,with a second mode at 106 Hz.
Similar to Test No. 2, significant pressure oscillations were observed in Test No. 1, 3, and 4. The majorsource of combustion instability was not fully determined at the end of these tests; however, it was speculated thatthe acoustic coupling between the GOX feed-line and combustion chamber could be responsible for the observedphenomena. Considering the distance between the choked venturi throat and the injector face of the combustionchamber, the calculated acoustic frequency in this equivalent l/4--wave tube was around 50 Hz--very close to thefundamental mode frequency of 53 Hz. This close agreement seemed to indicate that the source of instability wasassociated with acoustic characteristics of the GOX supply line. Therefore, the following major modifications to the
GOX supply line were made in order to eliminate the undesirable combustion instability phenomena:
1. A section of steel tubing in the GOX supply line between the venturi and the motor inlet was replaced. Thenew section was shaped in the form of a loop with a diameter of 40.6 cm (16 in). The effective length of the GOX
_upplylinewasincreasedto verify the dependence of the oscillation frequencies on GOX supply line tube length. Itwas seen in Test No. 5 that the frequencies of the first and second longitudinal modes of oscillation were reduced to_t0 and 86 Hz by the increase of GOX supply line length. The amplitude of oscillations for this run was also reduced_.o less than +!0%. This finding verified that the pressure oscillations in the motor were closely linked to the GOX
,upply line.
2. To further decouple the pressure wave transmissions between the motor and GOX supply line, and to damp outmajor pressure oscillations, a 6.35 cm (2.5") long orifice with inner diameter of 0.94 cm was added to the GOXsupply line just upstream of the motor inlet. Since the GOX supply line had an inner diameter of 1.57 cm, the longorifice provided an area blockage ratio of about 65%.
Results from Test No. 6 and 7 showed that these two modifications successfully eliminated the combustion
instability problems encountered in earlier tests of the hybrid motor system. Figure 7 shows the p-t trace of TestNo. 6, which was conducted after both the loop and long orifice were installed. The pressure oscillations dropped toonly about +1% and :1:1.5% of the mean pressure during Test No. 6 and 7, respectively. The chamber pressureshowed significant decay after the attainment of the peak pressure in Fig. 7. This decay was caused by erosion of the
graphite nozzle throat.
THERMAL PROFILES AND SURFACE CHARACTERISTICS OF BURNING SOLID FUELS
Figure 8 shows a temperature-time trace obtained using a 25 lam fine-wire Pt/Pt-10%Rh thermocoupleembedded at 292 mm (11.5 in) from the leading edge of the upper fuel slab in Test No. 5. The thermocoupleregistered the ambient temperature for the first 0.6 second of the test run then began to register higher temperaturesas the fuel surface regressed toward the thermocouple junction. The temperature profile increased smoothly until atemperature of around 1000 K was reached. Beyond the burning surface, the temperature profile undertook a rough,jagged shape in the gas-phase region, where the thermocouple bead location can be affected by cross flow ofpartially burned gases. The thermocouple was destroyed when it reached a temperature of around 1700 K atapproximately 1.35 s. According to Ref. 10, the maximum temperature sustainable by the S-type thermocouples isaround 1750 K.
Figures 9a and 9b show a pair of temperature-time traces recorded at two different axial locations (x = 14.0and 44.5 cm measured from the front edge of the sample) during Test No. 6. In Fig. 9a, the upstream thermocoupledisplayed several temperature plateaus between 4.25 and 4.5 seconds. The first plateau corresponds to a temperatureof about 900 K, which is believed to be the temperature of the melt layer covering the regressing solid fuel surface.This temperature plateau is associated with the passage of the thermocouple junction through the surface melt layer
beneath the boundary layer. The local Reynolds number based upon axial distance is around 5. lxl05, indicating the
beginning of transition to turbulent boundary layer.
Comparing the temperature-time trace in Fig 9b with the upstream one (shown in Fig. 9a), it is apparentthat the surface heat feedback from the gas phase is much stronger for the turbulent boundary-layer zone due to theincreased mass flux in the axial direction and transverse motion of turbulent eddies. Thus, the surface temperature is
higher, about 950 K, and the thermal profile in the subsurface region is steeper. The thermal wave thickness deducedfor the upstream thermocouple was approximately 400 }.tm, while that at the downstream is about 250 I.tm.Corresponding to the higher energy feedback, the surface regression rate toward the rear end of the fuel slab washigher than that of the front section.
Similarly, Figs. 10a and 10b compare two fine-wire thermocouple traces recorded at upstream (x = 6.4 cm)and downstream (x = 52 cm) locations of the top fuel slab from Test No. 7. Again, the temperature profile recordedby the upstream thermocouple (definitely located in a laminar boundary layer covered station) shows a much thickerthermal wave (about 400 I.tm) than that of the downstream thermocouple (about 200 }.tm). The surface temperature
in the upstream location, about 950 K, is lower than that of the downstream location, around 1000 K. Incorrespondence, the fuel slab at the upstream location has a lower regression rate than that of the downstream.
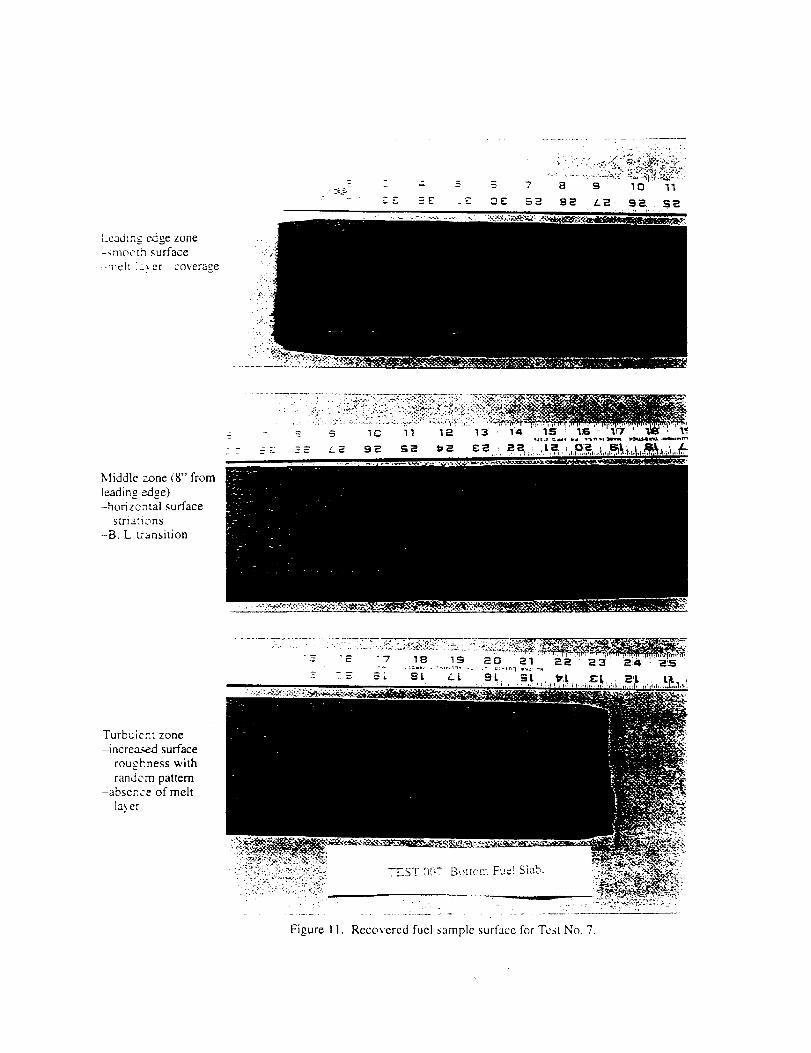
The recovered fuel surfaces also exhibit the transition from laminar to turbulent boundary layer with very
distinct roughness patterns shown in Figs. l la through l lc. In the upstream region, the solid fuel has a verysmooth surface due to melt layer coverage. In the transition region surface striations (ripples) running in thetransverse direction are clearly visible. In the downstream turbulent region, the surface roughness is greater in
magnitude with a highly random pattern. Due to the high rates of heat feedback, the melt layer may or may not
existin the turbulent boundary-layer region. The solid fuel could readily pyrolyze into gas-phase products withoutgoing through a liquefaction process.
SQLID FUEL REGRESSION RATE MEASUREMENTS
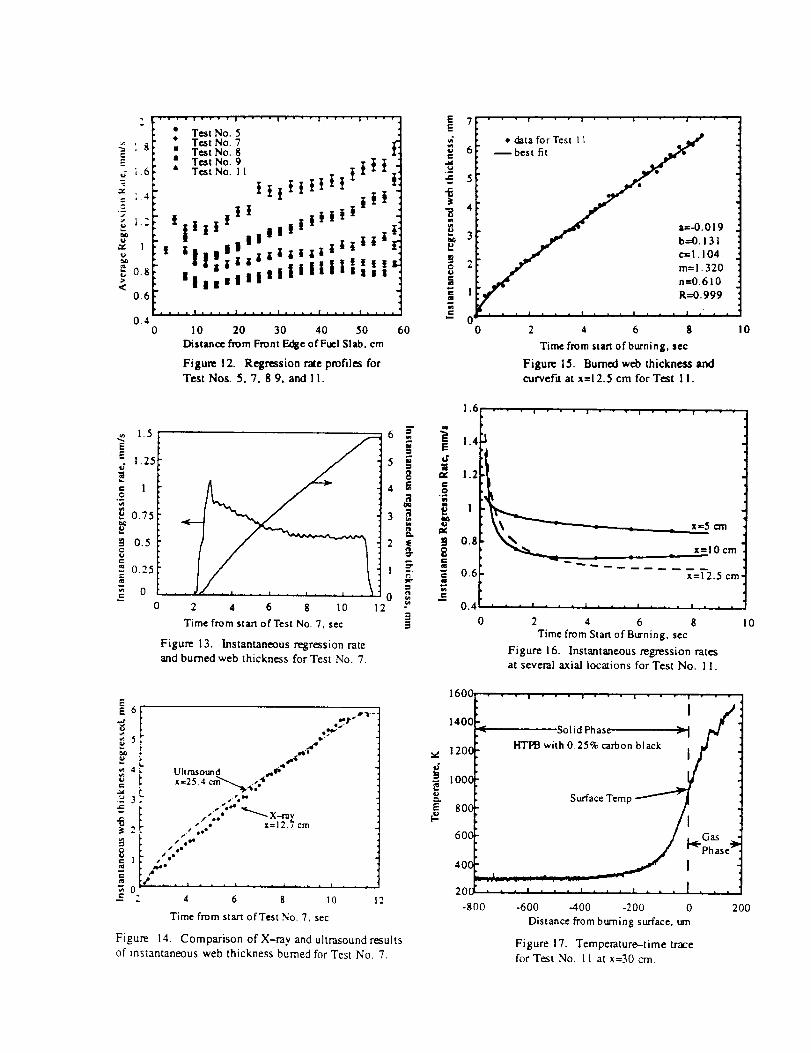
Figure 12 shows the axial variation of the time-averaged regression rates obtained from Test Nos. 5, 7, 8,9, and 1 i. These results were obtained by measuring the fuel web thickness at many axial locations before and afterthese tests. Each set of data on the graph shows a relatively high regression rate near the front edge of the fuel slaband a minimum regression rate neat the 13 to 15 cm location. After this minimum, the time-averaged regressionrate increases along the fuel slab in the axial direction. This result is consistent with the fact that the total mass fluxincreases with distance along the slab. Following the increase in mass flux, the rate of heat feedback to the burning
solid-fuel surface increases in the axial direction, resulting in higher regression rate. The front edge of the fuel slabhas a relatively high regression rate because the flame zone in the boundary layer is close to the fuel surface in thevery upstream region, where the boundary layer is quite thin. The initial decrease in regression rate leading to theminimum rate in the 13 to 15 cm region may be due to the competing effects of total mass flux, G, and Reynoldsnumber based on axial distance, Rex, as suggested in Ref 1. Theoretically, the regression rate of the fuel should
increase with G, which increases with x, but decrease with Rex --0"2, which decreases with x. The minimum point
of regression should correspond to the crossover of these two effects. The high regression rate at the trailing edge isbelieved to be caused by the recirculating flow before the entrance of the aft mixing chamber. It is interesting tonote that Test No. 5 shows a jump in regression rate at the 230 mm (9 in) location. This jump is believed to becaused by a rapid increase in heat flux to the fuel surface due to the onset of the turbulent boundary layer.
Figure 13 shows the deduced instantaneous regression rate and measured instantaneous regressed webthickness obtained from the ultrasonic pulse-echo system for Test No. 7. The ultrasonic transducer was located at254 mm (10 in) downstream of the front edge of the fuel slab. The regression rate was relatively high in the
beginning of test, but decreased continuously with time after attaining its peak value. The time variation of theinstantaneous regression rate at a particular axial location is quite consistent with the time variation of the massflux, which is relatively high in the beginning of the test since the combustor port area is relatively small. Theinstantaneous web thickness regressed as recorded by the EDUM increased smoothly and monotonically during thetest. The slope variation of the instantaneous web burned also indicates a faster regression rate in the beginning ofthe test. For this test, the ultrasonic pulse-echo method gives a total regressed web thickness of about 5.8 mm atthe transducer location, while direct measurements at the same location using a caliper gave a value of 6 mm. These
values represents a difference of 3.4%.
The real-time X-ray radiography system was also utilized to determine the instantaneous regressed webthickness. Figure 14 compares the X-ray and ultrasound results obtained from Test No. 7. The X-ray resultscorrespond to a location 12.7 cm (5 in.) downstream from the front edge of the fuel slab. The ultrasonic transducerwas located 25.4 mm (10 in.) downstream of the front edge of the fuel slab. Although these measurement were madeat different locations, the distance between them is not too large. As shown in Fig, 14, these results agree fairlywell. The instantaneous regressed web thickness obtained from X-ray data shows the same trend as that of thecorresponding ultrasonic data, but exhibited a slightly lower value. This difference is expected due to the upstreamlocation of the X-ray data station. The total web thickness regressed at this location was found to be 5.8 mm fromthe X-ray system, while measuring the fuel slab thickness before and after the test with a caliper gave a value of 5.6ram. The difference in these measurements is 3.5%.
Figure 15 shows the instantaneous regressed web thickness at a location 12.5 cm from the front edge of thefuel slab obtained from X-ray radiography data of Test No. 11. In order to obtain the corresponding instantaneousregression rate at this location, the data is fit with an equation of the form
w = a + bt m + ct n (1)
where w is the instantaneous regressed web thickness, t is time, and a. b, c, m, and n represent the constants to bedetermined. The double power-law form of Eq. (1) fits the data very well, as shown in Fig. 15. Taking the timederivative of Eq. (1) yields the regression rate:
r = bmt m-I + cnt n-I (2)
Thisprocedurecanbeperformedat many individual stations along the fuel slabs. Figure 16 shows the instantaneous
regression rate results at several axial locations for Test No. 11. Each regression rate starts relatively high at the
beginning of the test, decreases rapidly, then decreases more slowly as the test continues.
EFFECT OF CARBON BLACK ADDITIVE
In order to determine the effect of in--depth radiation absorption on fuel regression rate and solid fuel surfacetemperature, one of the fuel slabs was fabricated with the addition of carbon black powder (0.25% by weight) duringthe fuel processing stage in order to make the HTPB fuel sample opaque for both Test No. 9 and 11. The carbonblack powder was obtained from Cabot Industries and had a mean particle size of 75 nm. Carbon black acted as anopacifier to prevent any in-depth radiation absorption in the fuel slab during combustion. Any radiative heattransferred from either the hot combustion gases or from soot particles to the fuel slab should then be absorbed at thefuel slab surface.
The global fuel regression rate was found by weighing each fuel slab before and after the tests. The resultsof both tests indicated no significant difference in the regression rates of the translucent and black fuel slabs. For
Test No. 9, with an initial GOX flux of 0.30 Ibm/in2-s, both slabs had an overall regression rate of 1.2 mm/s. In
addition, both slabs displayed very similar time-averaged regression rate profiles with respect to axial location. For
Test No. 11, which had an initial GOX flux of 0.23 Ibm/in2-s, both slabs had nearly the same regression rate of
0.96 mm/s. Again, the time-averaged regression rate profiles with respect to axial location were found to be quitesimilar. Taken together, the results of these test firings suggest that in-depth radiation absorption was not asignificant contributor to the regression rate of the HTPB fuels slabs. One possible explanation for thisobservations is that a black char layer was formed immediately on the surface of the translucent fuel slab shortly afterignition, so that the radiative heat flux was absorbed only at the surface rather than in the interior of the slab.
Several Pt/Pt-10%Rh 25 lam fine-wire thermocouples were used to obtain the fuel slab subsurfacetemperature profile and surface temperature of the fuel slab processed with carbon black for Test No. 11. One of thethermocouples indicated that the surface temperature was about 930 K at a location 30 cm downstream from the frontedge of the fuel slab. This result is consistent with previous surface temperature measurements, which indicate thatthe surface temperature of the HTPB fuel slabs is around 900 to 1050 K, depending on operating conditions and axiallocation. The subsurface thermal wave profiles of Test No. 6 (translucent slab) and I I (black slab) may be compared
since both tests had similar GOX mass fluxes (0.21 and 0.23 lbm/in2-s, respectively) and global regression rates
(0.92 and 0.95 mm/s, respectively). As shown in Figure 17, the surface temperature and subsurface temperatureprofile is quite similar to the corresponding case from Test 6 (shown in Figs. 9a and 9b), giving further evidence thatthe addition of carbon black powder did not affect the performance of the HTPB fuel slabs.
SUMMARY AND CONCLUSIONS
A high-pressure, 2-D slab motor was designed and tested for conducting fundamental studies on hybridcombustion of solid fuels. The test motor was instrumented with various diagnostic devices. An oxidizer/fuelcombination of GOX/HTPB was used in all tests. Major findings are listed below.
Severe combustion instability phenomena were encountered in early tests. The source of instability wasidentified as the acoustic coupling between the GOX feed line and the combustion chamber. The instabilityproblem was eliminated by decoupling the two regions. The magnitude of chamber pressure oscillations wasreduced to less than +! .5%.
• The burning surface temperature of the HTPB varied between 900-1050 K, depending on both operatingconditions and axial locations.
The subsurface temperature profiles are steeper (thinner thermal waves) with higher surface temperatures at thedownstream locations; this is due to the increase in heat transfer rates in the turbulent portion of the boundary
layer.
• Regression rate increases with axial distance, except near the leading edge portion of the solid fuel; this is causedby the increase in total mass flux and convective heat flux.
• Both ultrasound and x-ray results indicate that the regression rate varies substantially with both time and axiallocauon; generally decreasing with time and increasing with axial location from the leading edge.
The addition of carbon black to HTPB fuels did not affect the fuel regression rate, surface temperature, andsubsurface thermal wave profile in comparison to the translucent fuel slabs. This implies that the in--depthradiation absorption was not important to the regression rate. Radiation flux was absorbed only at the surfacewhere a black char layer is formed.
The recovered fuel samples showed distinct surface structures at different axial regions. The surface covered by alaminar boundary layer is very smooth, indicating the existence of a liquid layer. The transition region showedtransverse striations and the turbulent boundary-layer zone exhibited very rough surface structure with highlyrandom patterns.
ACKNOWLEDGMENTS
The authors would like to thank NASA/MSFC for funding this work under Contract No. NAS 8-39945. Thesupport and encouragement of Mr. Roger Harwell of MSFC and Mr. Marion D. Kitchens of NASA Headquarters arehighly appreciated. We would like to thank Mr. Les Tepe of the Phillips Lab and Dr. David M. Mann of the ArmyResearch Office for supporting the purchase of the Ultrasonic Measurement System from ONERA, France. Underthe NATO/AGARD sponsorship, the help of Mr. Franck Cauty of ONERA in the technology transfer of theultrasonic pulse--echo technique to the research team is also greatly appreciated. The authors also wish to thankTUBITAK of Turkey for sponsoring the scholarship of Mr. Nadir Serin which made his participation in this studypossible. The efforts of Jon Foremsky are highly appreciated.
REFERENCES
1. Sutton, G. Rocket Propulsion Elements: An introduction to the Engineering of Rockets. Sixth Edition, John
Wiley & Sons, New York, 1992.
Marxman, G. A. and Gilbert, M., "Turbulent Boundary Layer Combustton in the Hybrid Rocket", Ninth
International Symposium on Combustion, p. 371, Academic Press, Inc., New York, 1963.
Muzzy, R. J., "Applied Hybrid Combustion Theory", AIAA paper 72-1143, 1972.
Smoot, L. D., and Price, C. F., "Regression Rates of Nonmetallized Hybrid Fuel Systems", AIAA Journal,
Vol. 3, No. 8, 1965.
Wooldridge, C. E., Marxman, G. A., and Kier, R. J., "Investigation of Combustion Instability in Hybrid
Rockets", Final Report NASA CR-66812, Contract NAS 1-7310, 1969.
Ramohalli, K. and Stickler, D. B., "Polymer-Degradation Theory of Pressure Sensitive Hybrid Combustion",
Thirteenth Symposium (International) on Combustion, pp. 1059-1077, The Combustion Institute, 1970.
Cauty, F., et. al., "Determination of Solid Propellant Burning Rate Sensitivity tt) the Initial Temperature by the
Ultrasonic Method", Non-Intrusive Combustion Diagnostics, Edited by K. K. Kuo and T. P. Parr, Begell
House, Inc., New York, 1994.
Dijkstra, F., Korting, P., and van der Berg, R., "Ultrasonic Regression Rate Measurement in Solid Fuel
Ramjets", AIAA Paper 90-1963, 1990.
Kuo, K. K. and Parr, T. P., eds., Non-Intrusive Combustion Diagnostics, Begell House, Inc., New York,
1994, pp. 365---423.
10. Anon, The Temperature Handbook, Omega Engineering, Inc., 1995.
3.
4.
5.
.
7.
8°
9,
+FerylgnitionSystem
IIII I,o Hand-Operated Valve I I U_ Remote--Operated Valve N2 L
Check Valve 0 2 vent
[_ Ventu ri
(_) Pressure Transducer
Thermocou pie
A Flashback Arre_or
Figure 1. Schematic Diagram of Hybrid Motor Test Facility.
Hybrid Motor
aust
E_'_H 4 vent
__ CH4N2
N2
TCI TC2
P1,F_
1!!!!!
TC3 TC4 P3,P4 lntemhangcableExit Nozzle
GOX
X-Ray Viewing Window #1 X-Ray Viewing Window #2
Figure 2. Instrumentation Of A Two Dimensional Windowed Hybrid Motor.
Video_ean
Transducer
I Oscilloscopet
I Video ICamera
Electronic Devic_
for Ultrasonic
Measurement (EDUM)
I Nioolet Multipro ITransient Analyzer
I 486DX2--66 IBMPC Compatible
Figure 3. Block Diagram for Ultrasonic
Pulse-Echo System.
X-RayLead
aphr°-0:1Hybrid Motor
._Sp2000 ] ] T.v.Video MonitOrCamera
Sp 200(:)O Video System
Controller
T.v.
Camera Panasonic
[ --I vcROPV-g500
J High Voltage [Generator
T
[ x-Ray ]Commller
Laser ] [ Hard Disk/Printer Floppy Disk
[ 1I Macintosh ll-Fx ]
Image Processing --System
Figure 4. Block Diagram for Real-time X-ray radiography System.
I
3.5 0.35
2.8
2.1
1.4
0.7
00.0 1.0 2.0 3.0 4.0 5.0 6.0
Time from start of Test No. 2, sec
Figure 5. Motor pressure-time trace
fro m Test No. 2.
7.0
0.28
._ 0.21
_1- 0.14<
0.07
00 IO0 200 300 400 500
Frequency, Hz
Figure 6. Frequency spectrum analysis of
pressure-time trace of Test No. 2.
t.
\
2 4 E B 10 12
rime, 14¢
Figure 7. Motor pressu - time trace
from Test No. 6.
! 600_ I
14oof ,
Solid Fuel m_ _, d
_2oo I, _'¢"
I000
800 Surface Tcmp / I _
600 / _ o_ .J Phase
m400 - L- -::-.'_'-' =---_'_ I
b-
200 .................... i ......3.2 3.4 3.6 3.8 4 4.2 4.4 4.6
Time from startofTest No. 6, sec
-600 -.400 -200 0 200
Distance from burning surface,ram
(a) Upstream Locatmn (x=t4 cm)
: 000
v 1500
_=
1000
b-
__00
I
_So|id Fuel
Surface Temp //_ Gas
I Phase
I
1.6 1.8 2 2.2 2.4 2.6 2.8
Time from start of Test No. 6. sec
-600 -400 -200 0 200 400
Distance from burning surface.ram
(b) Downstream Location (x=_4.5 cm)
Figure 9. Temperature profiles at two axial
locations from Test No. 6.
1800
1600
1400
• 1200P,
1oooI0
'800
600
400
200
5.9
2500
2000
1500
/_I000
500
2O00
16001
120G
800
400
_, Sohd Fuel_
..____Gas, Phase
• • - - ' , . * A . , !* I J I
6. I 6,4 6,6 6.8
Time from start of Test No. 5, sec
Figure 8. Temperature-time trace
for Test No. 5.
J
• t
--'- Solid Fuel _i
Surface _
_ , _ I Phase "
I- - - I , . . I . . . t , , . a . . i
2.2 2.6 3.0 3.4 3.8 4.2
Time from start of Test No. 7, sec
i , . t . , , L . . 1 i , , , i . , . i . . , I , , ,
-800 -600 --400 -200 0 200
Distance from burning surface, nun
(a) Upstream Location (x--'6.4 cm)
Solid Fuet
Surface Temp /t Gas
f/ _- Phase -P
0 i ............................ I...........2.0 2.1 2.2 2.3 2.4 2.5 2.6 2.7
Time from start of Test No. 7. see
t I I I I I I
-500 --400 -300 -200 -I00 0 100
Distance from btn-ning st.rface, mm
Co) Downstream Location (x=52 cm)
Figure 10. Temperature profiles at two axial
locations from Test No. 7.
2.8
I
200
Leadm_ e_/ge zone
-smoo'& surface
n_eh i:.x er coverage
Middle zone (8" from
leading ee.clge)-horizcntal surface
striations
-B. L u-ansition
Turbu]e.nt zone
-increa.:_d surface
roughness with
random pattern
-abser.ce of melt
Ia_er
TEST O{K Bt_ttc, n: Fue', Siab.
............. = __2..... 7 "
Figure I 1. Recovered fuel sample surface for Test No. 7.
Test No. 75
i $ T_t No.T_t No. 89
T., o till.,., 1.6 TestNo. ll t_[ t _[ t t[t t_[
o _.2 it tt|t I |lli|i '
i fttl ll 'jill|-,, 11111tttttt_
ii I Ill l
.... l,''' I0.4
0 10 20 30 40 50 60
Distance from Front Edge of Fuel Slab, cm
Figure 12. Regression rate profiles forTest Nos. 5, 7, 8 9, and 11.
1,55
= 1.25
-g_ 0.75
Y 0.5g
0.25
0
2 4 6 8 l0
Time from start of Test No. 7, sec
Figur_ 13. Instantaneous regression rate
and burned web thickness for Test No. 7
m
6 =m
gg
4 6
3
2 _8-
1 N'
-1
0 _2
N
EE6
_5
4
-5"6
_oc
.,¢.
Ultrasound 4,,,f'x=25.4 cm"_a/_ ,
.-.#'" =t, _ ee _
/ i ee.*_ el
_e,a
4 6 g 10
Time from start of Test No. 7, sec
12
Figure 14. Comparison ofX-rayandultrasoundresultsof instantaneous web thickness burned for Test No. 7.
E 7E
6
" 5
Y
0
1.6
1.4
d
'_" 1.2
g"..
0.8
_ 0.6
• • • ! • • " i • i • • • 1 • " •
• data for Test 1l _,_
_best fit /
a=-0.019b=0.131
,_ _--1. 104
._ m=1.320
n=0.610R=0.999
2 4 6 8
Time from start of burning, sec
Figure 15. Burned web thickness and
curvefit at x=12.5 cm for Test I l.
• " • ! • • • i • • • $ - • • ! • • •
I
x=10cm
x=l 2.5 cm
0.4 , • • , . , . i , . . i . . . , . , ,
0 2 4 6 8Time from Start of Burning, sec
Figure 16. Instantaneous regression ratesat several axial locations for Test No. I I.
160(
I0
140l
,._ 120C
-_ 100C
e_
E 80C
60C
I0
40C
20(
-800
• • • i • • • i • • • i • • • i • • •
'/
Surface Temp I- /
X/ XC, e"I
_.:,_.- - : ;_-,= ,
-600 -400 -200 0 200
Distance from burning surface, tan
Figure 17. Temperature-time trace
for Test No. I 1 at x=30 cm.