ˆˇ˘ ˜˚˛˝ - cervusequipment.com€¦ · Cervus Annual Report 2017 2 ... agriculture...
98
2017 Annual Rept CERVUS EQUIPMENT CORPORATION
Transcript of ˆˇ˘ ˜˚˛˝ - cervusequipment.com€¦ · Cervus Annual Report 2017 2 ... agriculture...
2017Annual Rep�t
CERVUS EQUIPMENT CORPORATION

Cervus Annual Report 2017 2
MESSAGE TO THE SHAREHOLDERS
I would like to start by recognizing and thanking our employees: they are the heart of Cervus and their hard work enables us to achieve the results we are presenting to you today. On behalf of our employees, I would like to acknowledge the support our customers, original equipment manufacturers (“OEMs”), and shareholders have given us this year.
The achievements of 2017, and the groundwork laid for 2018, have been achieved by our employees’ focus on being trusted advisors to our customers, with the support of our OEMs’ best in class equipment solutions. As a result of our employees’ diligent efforts, I am pleased to deliver the 57% increase in 2017 adjusted earnings to our shareholders.
Looking back at 2017, we achieved some significant milestones. Cervus set a company record for new equipment sales in our Agriculture segment, which was accomplished by understanding customers’ requirements and positioning our solutions to meet their needs. The segment’s results also encapsulate the accelerated performance of the six agriculture dealerships acquired in 2014. I am particularly pleased with the contribution of parts and service revenue and profitability growth within Agriculture. Our financial results reflect the tangible impact of our service optimization focus, enabling us to serve our customers and the substantial machine population more efficiently.
The performance of our Commercial and Industrial segment was another significant achievement in 2017. The segment concluded 2016 with a loss from operating activities following two difficult years for the western Canadian economy. The benefit of the actions we took in 2015 and 2016 became evident in 2017: internal cost discipline and moderate revenue growth resulted in the segment generating income from operating activities of $3.4 million.
We remain growth focused, and it is for this reason we chose to exit our four light construction dealerships. While these dealerships have been strong performers in their markets since we acquired them in 2006, we have concluded that our ability to increase our scale within the light construction market is limited. The purchaser shares our commitment to the customer, OEM and employees, and will maintain a strong local presence in the market. Ultimately, the transaction better aligns Cervus to focus on scalable growth opportunities.
An area of growth for us in recent years has been the Transportation segment. Starting with our Saskatchewan Peterbilt acquisition in 2012, we have grown to a scope and scale of 19 locations and more than 500 employees in less than five years. As a comparison, our Canadian Agriculture operations achieved this scale over a period of 17 years. While the growth has been challenging and our 2017 results reflect this, much work has been done to structure the business for success. I believe we have a strong foundation for business performance and profitability in 2018 and beyond. We have also applied the learnings from this rapid growth to more effectively deliver on operational processes and integrate acquisitions into the Cervus way.
Our focus in 2018 continues to be on delivering solutions and services to help our customers in their business, particularly in our product support offerings. We have seen returns on our service optimization process initiatives, and are continuing this approach across our operations. Ultimately, this translates to improving our customers’ experience, which is reflected in our financial performance. A lot has been learned and developed during 2017, and I am confident that our accomplishments have put Cervus in a strong position for performance in 2018 and beyond.
Sincerely,
Graham DrakePresident & Chief Executive OfficerCervus Equipment Corporation This page contains certain forward-looking statements. Please read the “Note Regarding Forward-Looking Information” contained in the Management Discussion and Analysis of Cervus for the year ended December 31, 2017 available on SEDAR at www.sedar.com under Cervus’ issuer profile.

Cervus Annual Report 2017 3
What specific changes were made in the Transportation segment to achieve profitability?
The profitability of the Transportation segment depends on our ability to service customers efficiently, manage costs and increase market share. Ontario is Canada’s largest truck market, and since acquisition we have increased the number of service bays and invested in new locations to extend our customer reach. Delivering on the potential opportunity in the Ontario market is dependent on our ability to align our actions, processes, and people. We see opportunities to engrain process in our service departments to set and deliver on customer expectations and enable accurate quoting and delivery of equipment. We have made changes in our leadership team to facilitate these improvements as well as optimize our cost structure to operate more efficiently.
Having sold the construction business, is Cervus also planning to sell its material handling business?
Our decision to sell our construction dealerships was based on their more limited expansion opportunities, compared to our other businesses. A key component of our growth strategy is to achieve scale in our dealership footprint over time, as a business to business, full service solution provider for our customers. These attributes are evident in our material handling dealerships, where we offer a full suite of equipment, parts, and service, along with industry specific safety and operator training. Like our Agriculture and Transportation segments, the material handling business is scalable and we see opportunities for expansion over time.
It has been a number of years since Cervus expanded as a John Deere dealer in Australia and New Zealand. How is this progressing?
Our Australasia team has developed significantly since we entered this geography. I am pleased to report that the 2017 financial performance for both Australia and New Zealand is in line with our expectations of what was possible when we first entered the market, and we delivered a 2017 pre-tax return on sales of 2.6% . I am most proud of our team’s approach: they demonstrated a commitment to personal and professional growth, sought opportunities to deepen customer relationships, and developed and implemented processes reflective of a unified group. I look forward to the continued success and performance of our Australia and New Zealand dealerships, which is backed by a committed and capable Cervus team.
What are Cervus’ growth opportunities in the next few years?
Over time, Cervus aims to generate approximately half of its growth organically and half of its growth from acquisitions. Organic growth is achievable via our marketing, expense management and company-wide service optimization initiatives, which will support revenue growth and profitability. We have strategically chosen to operate scalable businesses whose footprint can be expanded, and we see opportunities to do so in all of our segments. Cervus’ focus on the performance of our business is what makes us the dealer of choice for acquisitions, while our strong balance sheet positions us to expand when the right opportunity arises.
with Graham Drake, President & Chief Executive OfficerQ & A
This page contains certain forward-looking statements. Please read the “Note Regarding Forward-Looking Information” contained in the Management Discussion and Analysis of Cervus for the year ended December 31, 2017 available on SEDAR at www.sedar.com under Cervus’ issuer profile.

Cervus Annual Report 2017 4
Cervus Equipment Corporation Management’s Discussion + Analysis For the period from January 1, 2017 to December 31, 2017
[1] - Refer to Non-IFRS Measures herein
The following Management’s Discussion & Analysis (“MD&A”) was prepared as of March 13, 2018 and is provided to assist readers in understanding Cervus Equipment Corporation’s (“Cervus” or the “Company”) �nancial performance for the three and twelve-month periods ended December 31, 2017, and signi�cant trends that may a�ect the future performance of Cervus. This MD&A should be read in conjunction with the accompanying Audited Consolidated Financial Statements for the year ended December 31, 2017, and notes contained therein. The accompanying Audited Consolidated Financial Statements have been prepared in accordance with International Financial Reporting Standards (“IFRSs”) and Cervus’ functional and reporting currency is the Canadian dollar. Cervus’ common shares trade on the Toronto Stock Exchange under the symbol “CERV”.
Additional information relating to Cervus, including Cervus’ current annual information form, is available on the System for Electronic Document Analysis and Retrieval (“SEDAR”) web site at www.sedar.com.
This MD&A contains forward-looking statements. Please see the section “Note Regarding Forward-Looking Statements” for a discussion of the risks, uncertainties and assumptions relating to those statements. This MD&A also makes reference to certain non-IFRS �nancial measures to assist users in assessing Cervus’ performance. Non-IFRS �nancial measures do not have any standard meaning prescribed by IFRS and are therefore unlikely to be comparable to similar measures presented by other issuers. These measures are identi�ed and described under the section “Non-IFRS Financial Measures.”
Overview of Cervus For the year ended December 31, 2017, Cervus operated under three segments: Agriculture, Transportation, and Commercial and Industrial, based on the industries which they serve. These segments are managed separately, and strategic decisions are made on the basis of their respective operating results. On February 26, 2018, the Company announced it had entered into a de�nitive agreement to sell its Commercial operations, composed of four dealership locations in Calgary, Red Deer, Edmonton and Fort McMurray, Alberta. The dealerships represent the construction brands Bobcat, CMI and JCB. In 2018, Cervus will continue to report under three operating segments: Agriculture, Transportation, and Industrial. The Agricultural equipment segment consists of interests in 35 John Deere dealership locations with 14 in Alberta, 5 in Saskatchewan, 1 in British Columbia, 9 in New Zealand and 6 in Australia. The Transportation segment consists of 19 dealership locations with 4 Peterbilt truck dealerships and 1 Collision Centre operating in Saskatchewan, 12 Peterbilt truck dealerships operating in Ontario, and 2 parts and service locations operating in Ontario.
Cervus Annual Report 2017 5
For the year ended December 31, 2017, the Commercial and Industrial (“C&I”) equipment segment consisted of 11
dealership locations with 8 Bobcat/ JCB, Clark, Sellick, and Doosan material handling and forklift equipment
dealerships operating in Alberta, 2 Clark, Sellick, and Doosan material handling and forklift equipment dealerships
operating in Saskatchewan and 1 in Manitoba. Subsequent to the closing of the construction dealership group
transaction in the first quarter of 2018, Cervus’ Industrial segment will operate 8 Clark, Sellick, and Doosan material
handling and forklift equipment dealerships.

Cervus Annual Report 2017 6
Revenue by Segment
Revenue by Geography
Note Regarding Forward-Looking Statements Certain statements contained in this MD&A constitute “forward-looking statements”. These forward-looking statements may include words such as “anticipate”, “believe”, “could”, “expect”, “may”, “objective”, “outlook”, “plan”, “should”, “target” and “will”. All statements, other than statements of historical fact, that address activities, events, or developments that Cervus or a third party expects or anticipates will or may occur in the future, including our future growth, results of operations, performance and business prospects and opportunities, and the assumptions underlying any of the foregoing, are forward-looking statements. These forward-looking statements reflect our current beliefs and are based on information currently available to us and on assumptions we believe are reasonable. Actual results and developments may differ materially from the results and developments discussed in the forward-looking statements as they are subject to a number of significant risks and uncertainties, including those discussed under “Business Risks and Uncertainties” and elsewhere in this MD&A. Certain of these risks and uncertainties are beyond our control. Consequently, all of the forward-looking statements made in this MD&A are qualified by these cautionary statements and other cautionary statements or factors contained herein, and there can be no assurance that the actual results or developments will be realized or, even if substantially realized, that they will have the expected consequences to, or effects on, Cervus. These forward-looking statements are made as of the date of this MD&A, and we assume no obligation to update or revise them to reflect subsequent information, events, or circumstances unless otherwise required by applicable securities legislation.
The most recent quarterly dividend payment of $0.07 per share was made to the shareholders of record as of December 31, 2017, on January 15, 2018. See “Capital Resources - Cautionary note regarding dividends” for a cautionary note regarding future dividends.

Cervus Annual Report 2017 7
[1] - Refer to Non-IFRS Measures herein
Highlights of the Year
• The Company generated adjusted income1 of $19.0 million for the year ended December 31, 2017 and adjusted basic earnings per share1 of $1.21. For the comparable period in 2016, the Company generated adjusted income of $12.1 million and adjusted basic earnings per share of $0.77.
• The Company generated income of $19.9 million in 2017, compared to income of $23.5 million in 2016.
• The Company generated $1.2 billion of revenue in 2017, a 10% increase over 2016, while reducing selling, general and administrative (“SG&A”) expenses as a percentage of revenue.
• The Company achieved record new equipment sales in our Agriculture segment, increasing 20% over prior year.
• Parts and service revenue increased across the Company compared to the prior year.
• Interest and depreciation savings facilitated by the sale and leaseback conducted in the fourth quarter of 2016, more than o�set incremental lease costs and generated $1.7 million of the increase in income before income tax expense in 2017.
• Dividends of $0.28 per share were declared to shareholders during 2017.
• Since commencement of the Company’s Normal Course Issuer Bid (“NCIB”), Cervus has repurchased 240 thousand common shares under the NCIB.
• The Company rose to #33 from #49 on the Alberta Venture’s 2017 Venture 250 ranking.
• The Alberta John Deere dealerships were awarded John Deere’s Leaders Club status for the fourth consecutive year, an award recognizing the top John Deere dealers in Canada.

Cervus Annual Report 2017 8
ANNUAL CONSOLIDATED RESULTS
For the years ended December 31, 2017 and 2016, overall results are equivalent to same store results.
($ thousands, except per share amounts)($ thousands, except per share amounts)($ thousands, except per share amounts)($ thousands, except per share amounts) 2017
% Change
Compared
to 2016 2016
Revenue 1,221,285 10% 1,109,939
Cost of sales (1,011,857) 10% (918,874)
Gross profit 209,428 10% 191,065
Other income 222 (98%) 10,437
Unrealized foreign exchange gain 890 (75%) 3,501
Total other income 1,112 (92%) 13,938
Selling, general and administrative expense (176,199) 7% (164,431)
Income from operating activities 34,341 (15%) 40,572
Finance income 484 186% 169
Finance costs (5,863) (45%) (10,664)
Share of (loss) profit of equity accounted investees, net of income tax (4) (101%) 489
Income before income tax expense 28,958 (5%) 30,566
Income tax (expense) (9,046) 28% (7,042)
Income for the year 19,912 (15%) 23,524
Income attributable to shareholders 19,917 (16%) 23,712
EBITDA(1)53,840 (12%) 61,025
EBITDA margin(1)4.4% 5.5%
Ratios as a percentage of revenue:
Gross profit margin 17.1% 17.2%
Selling, general and administrative 14.4% 14.8%
Income per share
Basic - adjusted(1)1.21 57% 0.77
Basic 1.27 (16%) 1.51
Diluted 1.20 (17%) 1.44
Reconciliation of adjusted income before income tax expense:
Income before income tax expense 28,958 (5%) 30,566
Adjustments:
Unrealized foreign currency (gain) (890) (75%) (3,501)
(Gain) on sale of minority interests - (100%) (4,146)
(Gain) on sale of land and building (417) (92%) (5,262)
Adjusted income before income tax expense(1) 27,651 57% 17,657
[1] - Refer to Non-IFRS Measures herein

Cervus Annual Report 2017 9
Operating Summary – Year Ended December 31, 2017 Adjusted income before income tax expense1 increased $10.0 million to $27.7 million compared to $17.7 million in 2016. This was achieved due to an $8.2 million increase in our Agriculture segment, a $5.4 million increase in our C&I segment, and a $3.6 million decrease in our Transportation segment. Income before income tax expense decreased $1.6 million compared to 2016, comprised of a $1.1 million increase in our Agriculture segment, a $4.1 million increase in our C&I segment, o�set by a $6.8 million decrease in our Transportation segment. In analyzing �nancial results, Cervus considers adjusted income before income tax expense as a relevant supplementary non-IFRS measure of �nancial performance, particularly when comparing the �nancial performance of 2017 to that of 2016. The �nancial results of 2016 included $9.4 million of gains on sale of real estate and equity accounted investees which did not recur in 2017, while unrealized foreign exchange gains decreased $2.6 million in 2017 compared to the year ended December 31, 2016. As adjusted income before income tax expense excludes gains and losses from the sale of real estate and minority interests, as well as unrealized gains and losses on foreign exchange, this non-IFRS measure is useful for comparing the period to period �nancial performance of our underlying dealership operations. Adjusted income before income tax expense increased by $10.0 million in 2017, compared to 2016. This was achieved through record equipment sales in the Agricultural segment, operational e�ciencies in our C&I segment, partially o�set by underperformance of our Ontario transportation dealerships. In the third and fourth quarters of 2017, actions were taken to reorganize our Ontario transportation operations towards the objective of pro�tability in 2018. The costs of these actions were incurred and included in the �nancial results of the third and fourth quarters of 2017. Income before income tax expense decreased $1.6 million in the year compared to 2016, comprised of a $1.1 million increase in our Agriculture segment, a $4.1 million increase in our C&I segment, o�set by a $6.8 million decrease in our Transportation segment. Within our Agricultural segment, adjusted income before income tax expense increased $8.2 million. This performance re�ects the record new agricultural equipment sales achieved in 2017, a 20% increase compared to 2016. The increase in new equipment sales had a positive impact on Original Equipment Manufacturer (“OEM”) incentives received in the fourth quarter of 2017. Organic growth in parts and service revenue, along with improved gross pro�t margins, also contributed to the �nancial performance for the year, re�ecting our continued focus on e�ciently servicing the growing equipment population of our customers. Income before income tax expense increased $1.1 million for the segment compared to 2016. Within our Transportation segment, adjusted loss before income tax expense increased $3.6 million. A signi�cant factor was the $3.5 million incurred in the year related to reorganization costs and valuation adjustments to the Ontario lease �eet. Loss before income tax expense increased $6.8 million, which also includes $3.5 million of reorganization costs and lease �eet valuation adjustments. The reorganization costs were a result of actions taken in Ontario to facilitate pro�tability in 2018. Within our C&I segment, adjusted income before income tax expense increased $5.4 million. An 11% increase in revenue re�ected improving market sentiment, while internal e�ciencies delivered increased gross pro�t margins. Further, a year over year reduction in SG&A expenses was achieved in the segment, demonstrating the bene�ts of cost structure decisions made in 2015 and 2016. Income before income tax expense increased $4.1 million for the segment compared to 2016.
1 Refer to Non-IFRS measures herein

Cervus Annual Report 2017 10
Post Implementation Financial Impact of Sale and Leaseback
Late in the fourth quarter of 2016, Cervus entered a sale and leaseback for the physical premises of 11 dealership
locations. For the year ended December 31, 2017, SG&A includes $4.3 million of third-party rents related to the
sale and leaseback, compared to $nil for the year ended December 31, 2016. Partially offsetting this increased
SG&A was the elimination of depreciation related to the buildings previously incurred when the properties were
owned by Cervus. For the year ended December 31, 2016, depreciation expense of $1.2 million was included in
SG&A related to the properties, while for the same period in 2017, depreciation was $nil under the sale and
leaseback. Proceeds generated from the sale and leaseback were used to reduce the Company’s outstanding debt.
The reduction in interest bearing debt was the primary factor in the $4.8 million reduction in finance costs for the
year ended December 31, 2017, compared to the same period in 2016.
The net result in 2017, of the sale and leaseback in 2016, is a $1.7 million increase in income before income tax
expense compared to 2016, as interest savings and reduced depreciation more than offset increased third party
lease costs.
Sale of Construction Dealership Group
On February 26, 2018, the Company announced it had entered into a definitive agreement to sell the Commercial
portion of its Commercial and Industrial segment, composed of four dealership locations in Calgary, Red Deer,
Edmonton, and Fort McMurray, Alberta. The dealerships represent the construction brands Bobcat, CMI and JCB.
The transaction price is in excess of Cervus’ carrying value and includes the land and building at the Fort McMurray
construction dealership. The assets and liabilities related to the dealership operations have been classified as held
for sale as disclosed in Note 7 of the Audited Consolidated Financial Statements for the year ended December 31,
2017. Closing of the transaction is subject to the receipt of all required regulatory and third party approvals and,
assuming that all conditions precedent can be satisfied, is currently expected to close in the first quarter of 2018.
Upon closing, Cervus’ C&I segment will be renamed the Industrial Segment, as the eight continuing material
handling dealerships serve the industrial warehouse and material handling industries.

Cervus Annual Report 2017 11
ANNUAL BUSINESS SEGMENT RESULTS
For the year ended December 31, 2017 the Company had three reportable segments: Agricultural, Transportation,
and Commercial and Industrial, each supported by a single shared resources function. The Company allocates the
expenditures of shared resources to each individual segment according to specific identification and metrics to
estimate use as outlined in Note 25 of the accompanying Audited Consolidated Annual Financial Statements.
Agricultural Segment Results
($ thousands, except per share amounts)($ thousands, except per share amounts)($ thousands, except per share amounts)($ thousands, except per share amounts) 2017
% Change
Compared
to 2016 2016
Equipment
New equipment 447,268 20% 371,218
Used equipment 246,784 5% 235,016
Total equipment revenue 694,052 14% 606,234
Parts 93,627 5% 89,022
Service 40,839 6% 38,631
Rental and other 5,159 0% 5,142
Total revenue 833,677 13% 739,029
Cost of sales (703,484) 13% (623,860)
Gross profit 130,193 13% 115,169
Other income 1,143 (88%) 9,693
Selling, general and administrative expense (98,915) 9% (90,798)
Income from operating activities 32,421 (5%) 34,064
Income before income tax expense 29,479 4% 28,414
EBITDA(1)40,106 (10%) 44,658
Ratios as a percentage of revenue:
Gross profit margin 15.6% 15.6%
Selling, general and administrative 11.9% 12.3%
Reconciliation of adjusted income before income tax expense:
Income before income tax expense 29,479 4% 28,414
Adjustments:
(Gain) on sale of minority interests - (100%) (4,146)
(Gain) on sale of land and building (417) (88%) (3,360)
Adjusted income before income tax expense(1) 29,062 39% 20,908
[1] - Refer to Non-IFRS Measures herein
Operating Summary – Year Ended December 31, 2017
Within our Agriculture segment, adjusted income before income tax expense increased $8.2 million in 2017, as
focused sales efforts combined with a positive harvest outlook and favorable exchange rates drove record new
equipment sales in the year. Income before income tax expense increased $1.1 million compared to 2016, as the
2016 results included a $4.2 million gain on sale of minority interest and $2.9 million of gains on sale of real estate,
which were both non-recurring in 2017.
Cervus Annual Report 2017 12
Our equipment sales were accelerated by a successful growing season in our geography, combined with windows
of favorable exchange rates during the year. This 20% increase in new equipment sales performance resulted in
additional OEM incentives received compared to 2016, which are included in gross profit. Used equipment sales
also increased 5%, while the 5% increase in parts and service was achieved at improved gross profit margins
through service optimization. The resulting $15.0 million increase in gross profit more than offset the $8.1 million
increase in SG&A expenses, the largest component of which was the $3.9 million of additional third-party
occupancy costs related to the sale and leaseback conducted in the fourth quarter of 2016.

Cervus Annual Report 2017 13
Transportation Segment Results
($ thousands, except per share amounts)($ thousands, except per share amounts)($ thousands, except per share amounts)($ thousands, except per share amounts) 2017
% Change
Compared
to 2016 2016
Equipment
New equipment 155,480 5% 148,056
Used equipment 9,005 37% 6,563
Total equipment revenue 164,485 6% 154,619
Parts 92,559 2% 90,364
Service 29,367 (1%) 29,785
Rental and other 6,958 (39%) 11,475
Total revenue 293,369 2% 286,243
Cost of sales (240,885) 3% (233,089)
Gross profit 52,484 (1%) 53,154
Other loss (1,604) 48% (1,085)
Unrealized foreign exchange gain 685 (80%) 3,501
Total other (loss) income (919) (138%) 2,416
Selling, general and administrative expense (53,065) 8% (48,942)
(Loss) income from operating activities (1,500) (123%) 6,628
(Loss) income before income tax expense (3,562) (209%) 3,256
EBITDA(1)7,442 (44%) 13,321
Ratios as a percentage of revenue:
Gross profit margin 17.9% 18.6%
Selling, general and administrative 18.1% 17.1%
Reconciliation of adjusted loss before income tax expense:
(Loss) income before income tax expense (3,562) (209%) 3,256
Adjustments:
Unrealized foreign currency (gain) (685) (80%) (3,501)
(Gain) on sale of land and building - (100%) (448)
Adjusted loss before income tax expense(1) (4,247) 513% (693)
[1] - Refer to Non-IFRS Measures herein
Operating Summary – Year Ended December 31, 2017
Within our Transportation segment, adjusted loss before income tax expense increased $3.6 million. A significant
factor was the $3.5 million incurred in the year related to reorganization costs and valuation adjustments to the
Ontario lease fleet. Loss before income tax expense increased $6.8 million, which also includes $3.5 million of
reorganization costs and lease fleet valuation adjustments. The reorganization costs were a result of actions taken
in Ontario to facilitate profitability in 2018.
Included in the $3.6 million increase in adjusted loss before income tax expense is SG&A expenses of $1.0 million
related to reorganization costs in our Ontario operations, and a $2.5 million valuation adjustment to the Ontario
lease fleet which is included in other loss. The $6.8 million increase in loss before income tax expense reflects the
non-recurrence of a $0.5 million gain on sale of real estate in 2016, $3.5 million of reorganization and lease fleet
revaluation expenses, and a $2.8 million decrease in unrealized foreign exchange gains in 2017 compared to 2016.

Cervus Annual Report 2017 14
Our Ontario dealerships have not performed to our expectation, and we have taken corrective action including
changes to the leadership of the Ontario group. We are focused on Ontario achieving profitability in 2018 as we
accelerate process efficiency, disciplined cost management, and revenue growth. The Ontario team has identified
and is executing tactical objectives tied to efficient operations and profitability in 2018. These objectives include
aligning new vehicle pre-delivery service work to those dealerships with excess service capacity, improving both
the cost efficiency and timely delivery of equipment, while also increasing shop availability for customer repairs
across our footprint. Our parts distribution approach has also been adjusted, reducing overlap of delivery routes
and vehicle costs while maintaining delivery timelines. The optimization of our service departments has been
refocused, where improved quoting and scheduling will impact both customer experience and profitability.
Within our two transportation geographies, our Saskatchewan dealerships generated $1.4 million of income
before income tax expense, while Ontario generated a $5.0 million loss before income tax expense, based on the
factors discussed above.

Cervus Annual Report 2017 15
Commercial and Industrial Segment Results
($ thousands, except per share amounts)($ thousands, except per share amounts)($ thousands, except per share amounts)($ thousands, except per share amounts) 2017
% Change
Compared
to 2016 2016
Equipment
New equipment 44,398 8% 41,033
Used equipment 8,846 31% 6,775
Total equipment revenue 53,244 11% 47,808
Parts 22,677 5% 21,567
Service 14,258 23% 11,557
Rental and other 4,060 9% 3,735
Total revenue 94,239 11% 84,667
Cost of sales (67,488) 9% (61,925)
Gross profit 26,751 18% 22,742
Other income 683 (63%) 1,829
Unrealized foreign exchange gain 205 100% -
Total other income 888 (51%) 1,829
Selling, general and administrative expense (24,219) (2%) (24,691)
Income (loss) from operating activities 3,420 2950% (120)
Income (loss) before income tax expense 3,041 375% (1,104)
EBITDA(1)6,292 107% 3,046
Ratios as a percentage of revenue:
Gross profit margin 28.4% 26.9%
Selling, general and administrative 25.7% 29.2%
Reconciliation of adjusted income (loss) before income tax
expense:
Income (loss) before income tax expense 3,041 375% (1,104)
Adjustments:
Unrealized foreign currency (gain) (205) 100% -
(Gain) on sale of land and building - (100%) (1,454)
Adjusted income (loss) before income tax expense(1) 2,836 (211%) (2,558)
[1] - Refer to Non-IFRS Measures herein
Operating Summary – Year Ended December 31, 2017
Adjusted income before income tax expense for the C&I segment increased $5.4 million. Income before income
tax expense increased $4.1 million for the year ended 2017, including the non-recurrence of a $1.5 million gain on
sale of real estate in 2016 and a $0.2 million increase in unrealized foreign exchange gains year over year. A 11%
increase in revenue, combined with SG&A expense discipline resulted in incremental gross profit directly
impacting income. The increase in total revenue resulted from modest new and used equipment revenue growth
combined with a 23% increase in service revenue.

Cervus Annual Report 2017 16
Within the C&I segment, equipment sales have accelerated slightly from 2016 levels, although customers remain
cautious absent a definitive western Canadian recovery. Within this environment, the C&I segment has performed
by meeting existing customer needs while operating efficiently. As customers extend equipment replacement
cycles, delivering uptime for existing equipment has contributed to a 23% increase in service revenue compared
to the prior year. The segment’s 2017 financial performance was achieved through overall gross profit margin
growth combined with an 11% increase in revenue, further amplified by a $0.5 million reduction in SG&A
expenses.
Annual Cash Flows
Cash and Cash Equivalents – Year Ended December 31, 2017
Cervus’ primary sources and uses of cash flow for the year ended December 31, 2017, are as follows: Operating Activities
Net cash provided from operating activities was $33.5 million for the year ended December 31, 2017, compared
to $16.2 million in 2016, an increase of $17.4 million. The increase in net cash from operating activities primarily
resulted from a $16.1 million decrease in net cash used in working capital items, a $4.6 million decrease in interest
paid, partly offset by a $5.6 million increase in cash taxes paid. The decrease in cash used in working capital items
was primarily driven by an increase in floor plan financing as a percentage of inventory. Investing Activities
During the year ended December 31, 2017, the Company’s net cash from investing activities was a source of cash
of $3.6 million, compared to a source of cash of $72.0 million in 2016, a decrease of $68.4 million. The source of
this variance are two significant events in 2016 which were non-recurring in 2017: the 2016 sale of real estate
which provided cash from investing activities of $62.6 million, and the 2016 sale of an equity accounted investee
which generated cash proceeds of $9.1 million in the prior period.
Financing Activities
During the year ended December 31, 2017, the Company used $37.5 million of cash related to financing activities
compared to $86.0 million in 2016, a net reduction in use of cash for financing activities of $48.4 million. This
decrease is primarily due to the significant 2016 cash outflow related to applying proceeds received from the sale
of real estate and equity investees to repay debt in 2016. The use of cash in 2017 related to the Company’s
repayment and extinguishment of the Company’s convertible debenture, funded by the Company’s syndicate
facility, which was partially repaid during the year from operating cash flows.

Cervus Annual Report 2017 17
Fourth Quarter Consolidated Performance
($ thousands, except per share amounts)($ thousands, except per share amounts)($ thousands, except per share amounts)($ thousands, except per share amounts) 2017
% Change
Compared
to 2016 2016
Revenue 272,726 0% 271,943
Cost of sales (218,996) (3%) (225,455)
Gross profit 53,730 16% 46,488
Other (loss) income (1,728) (122%) 7,832
Unrealized foreign exchange (loss) gain (188) (162%) 304
Total other (loss) income (1,916) (124%) 8,136
Selling, general and administrative expense (45,094) 8% (41,945)
Income from operating activities 6,720 (47%) 12,679
Finance income 63 (32%) 93
Finance costs (1,070) (55%) (2,375)
Share of (loss) profit of equity accounted investees, net of income tax (4) (101%) 407
Income before income tax expense 5,709 (47%) 10,804
Income tax expense (1,982) (3%) (2,042)
Income for the period 3,727 (57%) 8,762
Income attributable to shareholders 3,727 (57%) 8,753
EBITDA(1)13,622 (24%) 18,008
EBITDA margin(1)5.0% 6.6%
Ratios as a percentage of revenue:
Gross profit margin 19.7% 17.1%
Selling, general and administrative 16.5% 15.4%
Income per share
Basic - adjusted (1)0.25 0.03
Basic 0.24 0.55
Diluted 0.23 0.52
Reconciliation of adjusted income before income tax expense:
Income before income tax expense 5,709 (47%) 10,804
Adjustments:
Unrealized foreign currency loss (gain) 188 (162%) (304)
(Gain) on sale of minority interests - (100%) (4,146)
(Gain) on sale of land and building - (100%) (3,887)
Adjusted income before income tax expense(1) 5,897 139% 2,467
[1] - Refer to Non-IFRS Measures herein

Cervus Annual Report 2017 18
Operating Summary – Three Months Ended December 31, 2017
For the fourth quarter of 2017, adjusted income before income tax expense increased $3.4 million compared to
the same period in 2016. This was achieved through a $3.8 million increase in our Agriculture segment, a $1.1
million increase in our C&I segment, partially offset by a $1.5 million decrease in our Transportation segment.
Income before income tax expense decreased $5.1 million, due to non-recurrence of gains on sale realized in the
fourth quarter of 2016, specifically a $4.2 million gain on sale of a minority interest and a $3.9 million gain on sale
of real estate in 2016.
Within our Agriculture segment, adjusted income before income tax expense increased $3.8 million, principally
due to additional OEM incentives received in the fourth quarter, associated with record new equipment sales in
the year. Income before income tax expense decreased $3.8 million, reflecting the non-recurrence of $4.2 million
in gains on sale of real estate and a $3.4 million gain on sale of a minority interest, which both occurred in the
fourth quarter of 2016.
In our Transportation segment, adjusted loss before income tax expense increased $1.5 million compared to the
three months ended December 31, 2016. This includes SG&A expenses of $0.4 million related to reorganization
costs in our Ontario operations and a $2.5 million valuation adjustment to the Ontario lease fleet which is included
in other loss. Loss before income tax expense increased $2.4 million compared to the fourth quarter of 2016, and
also includes the reorganization and lease valuation adjustments noted above.
Our C&I segment generated a $1.1 million increase in income before income tax expense, based on consistent
revenue and SG&A expenses, combined with increased gross profit margin due to service optimization impacts
and sales mix shifting towards parts and service. The work done in the C&I segment to maintain SG&A expenses
while improving revenue and gross profit margins has been a key factor in increased profitability despite
persistent caution in the industry. For the C&I segment, fourth quarter adjusted income before income tax expense
and income before income tax expense are equivalent.
Cervus Annual Report 2017 19
Fourth Quarter Business Segment Performance
Agricultural Segment Results
($ thousands, except per share amounts)($ thousands, except per share amounts)($ thousands, except per share amounts)($ thousands, except per share amounts) 2017
% Change
Compared
to 2016 2016
Equipment
New equipment 98,393 (1%) 99,155
Used equipment 55,060 16% 47,455
Total equipment revenue 153,453 5% 146,610
Parts 19,511 (4%) 20,292
Service 10,520 4% 10,155
Rental and other 1,851 (21%) 2,331
Total revenue 185,335 3% 179,388
Cost of sales (151,018) (0%) (151,219)
Gross profit 34,317 22% 28,169
Other income 426 (95%) 8,028
Selling, general and administrative expense (25,541) 12% (22,902)
Income from operating activities 9,202 (31%) 13,295
Income before income tax expense 8,635 (30%) 12,394
EBITDA (1)11,131 (32%) 16,264
Ratios as a percentage of revenue:
Gross profit margin 18.5% 15.7%
Selling, general and administrative 13.8% 12.8%
Reconciliation of adjusted income before income tax expense:
Income before income tax expense 8,635 (30%) 12,394
Adjustments:
(Gain) on sale of minority interests - (100%) (4,146)
(Gain) on sale of land and building - (100%) (3,439)
Adjusted income before income tax expense(1) 8,635 80% 4,809
[1] - Refer to Non-IFRS Measures herein
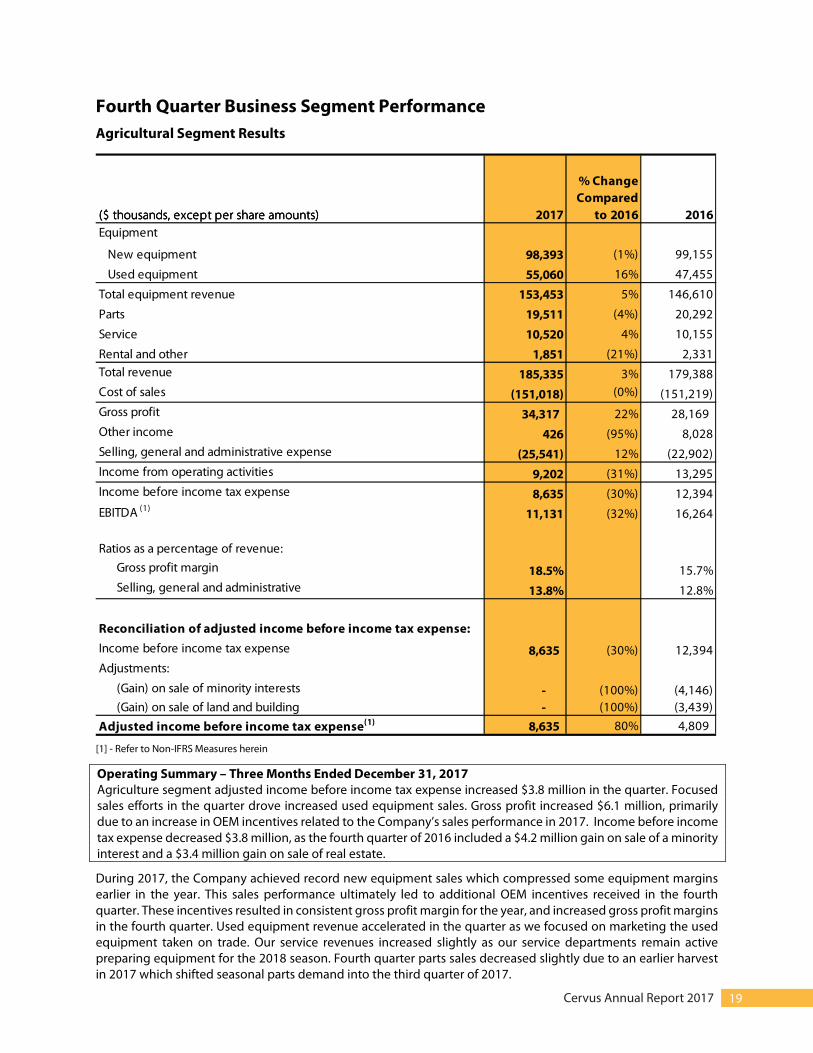
Operating Summary – Three Months Ended December 31, 2017
Agriculture segment adjusted income before income tax expense increased $3.8 million in the quarter. Focused
sales efforts in the quarter drove increased used equipment sales. Gross profit increased $6.1 million, primarily
due to an increase in OEM incentives related to the Company’s sales performance in 2017. Income before income
tax expense decreased $3.8 million, as the fourth quarter of 2016 included a $4.2 million gain on sale of a minority
interest and a $3.4 million gain on sale of real estate.
During 2017, the Company achieved record new equipment sales which compressed some equipment margins
earlier in the year. This sales performance ultimately led to additional OEM incentives received in the fourth
quarter. These incentives resulted in consistent gross profit margin for the year, and increased gross profit margins
in the fourth quarter. Used equipment revenue accelerated in the quarter as we focused on marketing the used
equipment taken on trade. Our service revenues increased slightly as our service departments remain active
preparing equipment for the 2018 season. Fourth quarter parts sales decreased slightly due to an earlier harvest
in 2017 which shifted seasonal parts demand into the third quarter of 2017.
Cervus Annual Report 2017 20
Transportation Segment Results
($ thousands, except per share amounts)($ thousands, except per share amounts)($ thousands, except per share amounts)($ thousands, except per share amounts) 2017
% Change
Compared
to 2016 2016
Equipment
New equipment 29,416 (12%) 33,461
Used equipment 2,533 26% 2,012
Total equipment revenue 31,949 (10%) 35,473
Parts 22,654 (1%) 22,835
Service 7,489 5% 7,148
Rental and other 1,446 (59%) 3,537
Total revenue 63,538 (8%) 68,993
Cost of sales (50,755) (11%) (56,778)
Gross profit 12,783 5% 12,215
Other loss (2,381) 1790% (126)
Unrealized foreign exchange (loss) gain (185) (161%) 304
Total other (loss) income (2,566) (1542%) 178
Selling, general and administrative expense (13,209) 4% (12,681)
Loss from operating activities (2,992) 939% (288)
Loss before income tax expense (3,418) 233% (1,025)
EBITDA (1)1,205 (9%) 1,325
Ratios as a percentage of revenue:
Gross profit margin 20.1% 17.7%
Selling, general and administrative 20.8% 18.4%
Reconciliation of adjusted loss before income tax expense:
Loss before income tax expense (3,418) 233% (1,025)
Adjustments:
Unrealized foreign currency loss (gain) 185 (161%) (304)
(Gain) on sale of land and building - (100%) (448)
Adjusted loss before income tax expense(1) (3,233) 82% (1,777) [1] - Refer to Non-IFRS Measures herein
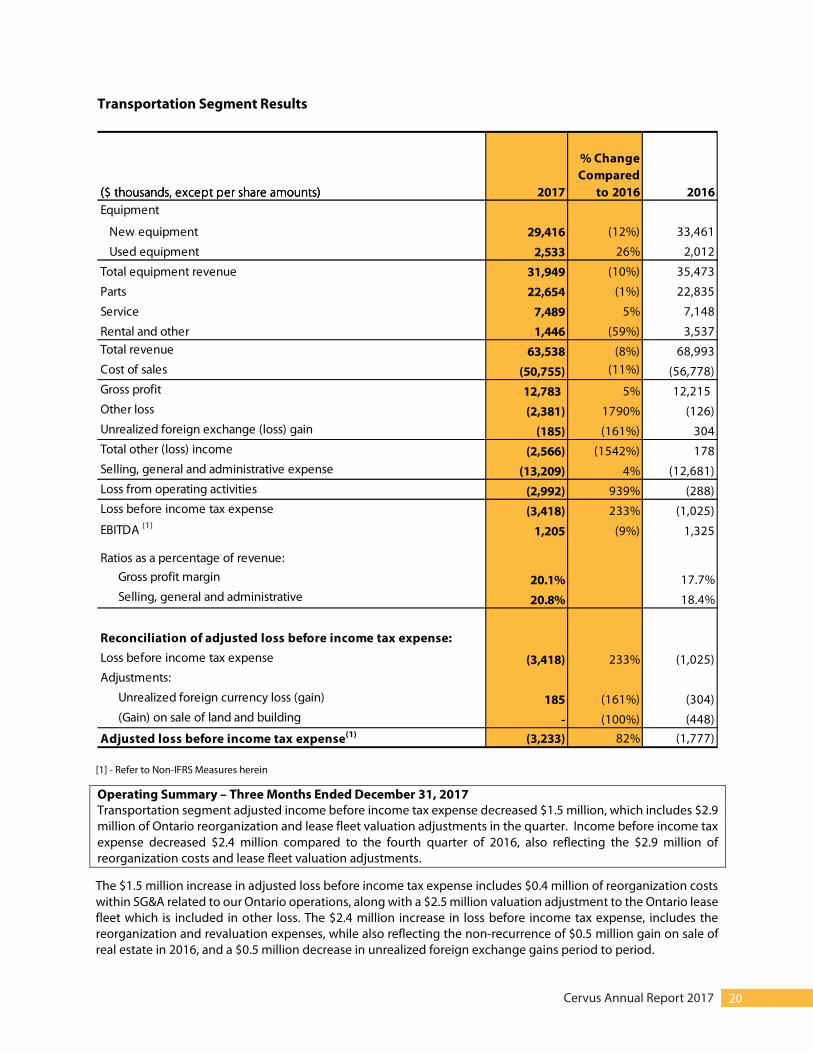
Operating Summary – Three Months Ended December 31, 2017
Transportation segment adjusted income before income tax expense decreased $1.5 million, which includes $2.9
million of Ontario reorganization and lease fleet valuation adjustments in the quarter. Income before income tax
expense decreased $2.4 million compared to the fourth quarter of 2016, also reflecting the $2.9 million of
reorganization costs and lease fleet valuation adjustments.
The $1.5 million increase in adjusted loss before income tax expense includes $0.4 million of reorganization costs
within SG&A related to our Ontario operations, along with a $2.5 million valuation adjustment to the Ontario lease
fleet which is included in other loss. The $2.4 million increase in loss before income tax expense, includes the
reorganization and revaluation expenses, while also reflecting the non-recurrence of $0.5 million gain on sale of
real estate in 2016, and a $0.5 million decrease in unrealized foreign exchange gains period to period.
Cervus Annual Report 2017 21
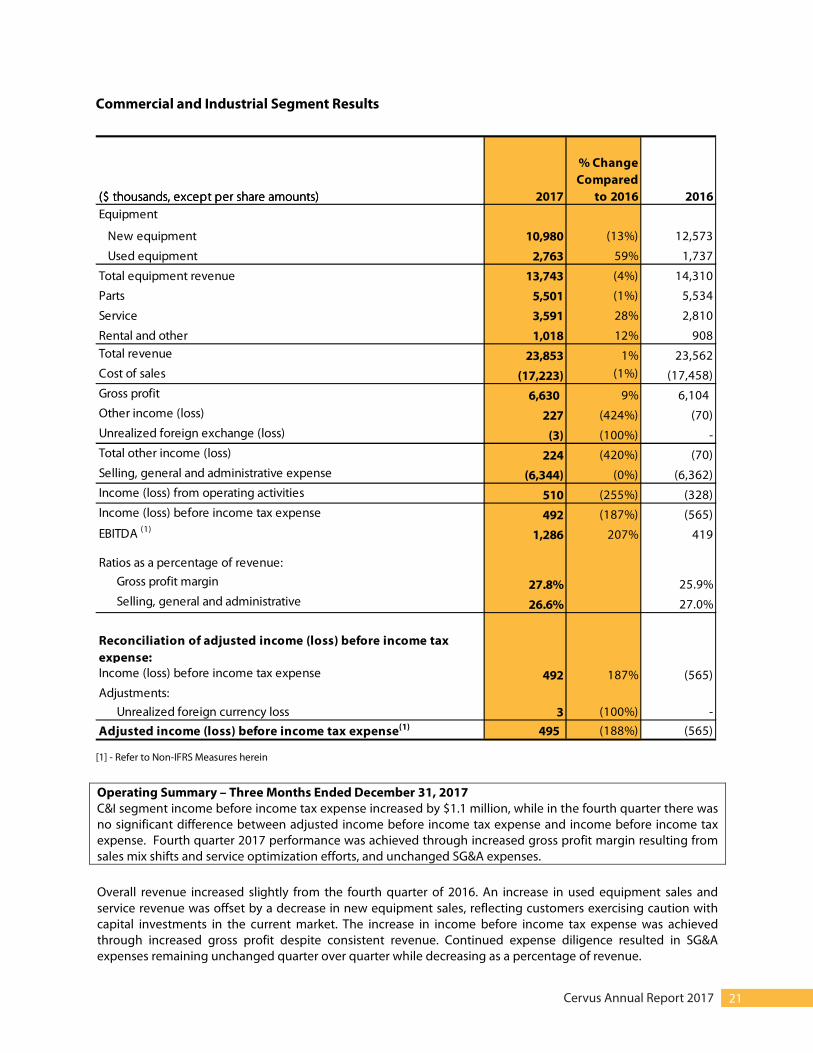
Commercial and Industrial Segment Results
($ thousands, except per share amounts)($ thousands, except per share amounts)($ thousands, except per share amounts)($ thousands, except per share amounts) 2017
% Change
Compared
to 2016 2016
Equipment
New equipment 10,980 (13%) 12,573
Used equipment 2,763 59% 1,737
Total equipment revenue 13,743 (4%) 14,310
Parts 5,501 (1%) 5,534
Service 3,591 28% 2,810
Rental and other 1,018 12% 908
Total revenue 23,853 1% 23,562
Cost of sales (17,223) (1%) (17,458)
Gross profit 6,630 9% 6,104
Other income (loss) 227 (424%) (70)
Unrealized foreign exchange (loss) (3) (100%) -
Total other income (loss) 224 (420%) (70)
Selling, general and administrative expense (6,344) (0%) (6,362)
Income (loss) from operating activities 510 (255%) (328)
Income (loss) before income tax expense 492 (187%) (565)
EBITDA (1)1,286 207% 419
Ratios as a percentage of revenue:
Gross profit margin 27.8% 25.9%
Selling, general and administrative 26.6% 27.0%
Reconciliation of adjusted income (loss) before income tax
expense:
Income (loss) before income tax expense 492 187% (565)
Adjustments:
Unrealized foreign currency loss 3 (100%) -
Adjusted income (loss) before income tax expense(1) 495 (188%) (565)
[1] - Refer to Non-IFRS Measures herein
Operating Summary – Three Months Ended December 31, 2017
C&I segment income before income tax expense increased by $1.1 million, while in the fourth quarter there was
no significant difference between adjusted income before income tax expense and income before income tax
expense. Fourth quarter 2017 performance was achieved through increased gross profit margin resulting from
sales mix shifts and service optimization efforts, and unchanged SG&A expenses.
Overall revenue increased slightly from the fourth quarter of 2016. An increase in used equipment sales and
service revenue was offset by a decrease in new equipment sales, reflecting customers exercising caution with
capital investments in the current market. The increase in income before income tax expense was achieved
through increased gross profit despite consistent revenue. Continued expense diligence resulted in SG&A
expenses remaining unchanged quarter over quarter while decreasing as a percentage of revenue.

Cervus Annual Report 2017 22
Fourth Quarter Cash Flows
Cash and Cash Equivalents – Three Months Ended December 31, 2017
Cervus’ primary sources and uses of cash flow for the three months ended December 31, 2017, are as follows:
Operating Activities
Net cash provided from operating activities was $21.6 million, compared to net cash used of $0.4 million for the
same period of 2016, an increase of $22.0 million. The primary reason for the increase is $8.7 million of net cash
provided from working capital items in the quarter, compared to $8.8 million of net cash used in 2016. This $17.4
million change in cash from working capital items primarily relates to an increase in floor plan payables in the
fourth quarter related to additional used equipment taken on trade as part of the record new equipment sales in
the year.
Investing Activities
The Company used $0.2 million of cash in investing activities in the quarter, compared to cash provided of $64.9
million in 2016, a change of $65.1 million. The net change relates primarily to $57.8 million of proceeds received
in the fourth quarter 2016 from the sale and leaseback of eleven properties, combined with proceeds from the
disposition of an equity held investee for $9.1 million in the fourth quarter of 2016.
Financing Activities
Financing activities used $10.1 million of cash in the period, compared to a use of $60.5 million in 2016. The
difference is principally due to the $57.7 million of debt repayments in the fourth quarter of 2016, as application
of proceeds from the sale and leaseback transaction.
Consolidated Financial Position & Liquidity
($ thousands, except ratio amounts)December 31,
2017
December 31,
2016
Current assets 384,835 324,759
Total assets 514,055 476,852
Current liabilities 236,262 220,050
Long-term financial liabilities 42,586 32,355
Shareholders’ equity 225,253 213,839
Working capital(1)148,573 104,709
Working capital ratio(1) 1.63 1.48
[1] - Refer to Non-IFRS Measures herein
Working Capital
Cervus’ working capital increased by $43.9 million to $148.6 million at December 31, 2017, when compared to
$104.7 million at December 31, 2016. As at the date of this report, the Company is in compliance with all of its
covenants.
Based on inventory levels at December 31, 2017, the Company had the ability to floor plan an additional $28.9
million of inventory and held $453.0 million of undrawn floor plan capacity.

Cervus Annual Report 2017 23
The Company’s ability to maintain sufficient liquidity is driven by revenue, gross profit, and judicious allocation of
resources. At this time, there are no known factors that management is aware of that would affect its short and
long-term objectives of meeting the Company’s obligations as they come due. Working capital may fluctuate from
time to time based on the use of cash and cash equivalents related to the seasonal nature of our business, and
funding potential future business acquisitions. Cash resources can typically be restored by accessing floor plan
monies from unencumbered equipment inventories or accessing undrawn credit facilities. Also, the seasonality of
our business requires greater use of cash resources in the first and fourth quarter of each year to fund general
operations caused by the seasonal nature of our sales activity.
Liquidity Risk
The Company's exposure to liquidity risk is dependent on the collection of accounts receivable and the ability to
raise funds to meet purchase commitments, financial obligations, and to sustain operations. The Company
controls its liquidity risk by managing its working capital, cash flows, and the availability of borrowing facilities.
The Company's contractual obligations and availability of borrowing facilities at December 31, 2017 are described
further in the sections below.
The Company has guaranteed the net residual value of certain customer leases, for leases between customers and
John Deere Financial (“JDF”) as set out in Note 26 to the Audited Consolidated Financial Statements for the year
ended December 31, 2017. The Company regularly assesses the residual value of the JDF lease portfolio relative
to wholesale values for comparable equipment. On the maturity of customer’s leases, the equipment can be
returned to the Company and if so, it is sold as used equipment. Upon the return of equipment, JDF will provide
the Company floor planning based on John Deere’s pricing guide. Of the lease portfolio at December 31, 2017,
leases with a residual value of $29.0 million are scheduled to mature in 2018.
Contractual Obligations
The Company has certain contractual obligations including payments under long-term debt agreements, finance
and operating lease commitments. A summary of the Company’s principal contractual obligations are as follows:
($ thousands)
Total Carrying
Value Due 2018
Due 2019
through 2020
Due 2020
through 2021 Due Thereafter
Term debt payable 45,217 11,122 27,239 5,708 1,148
Finance lease obligation 15,777 5,361 3,674 2,170 4,572
Operating leases - 11,775 11,992 9,090 96,493
Total 60,994 28,258 42,905 16,968 102,213

Cervus Annual Report 2017 24
Inventories
The nature of the business has a significant impact on the amount of equipment that is owned by our various
dealerships. The majority of our Agricultural equipment sales come with a trade-in, a limited portion of our
Transportation sales come with a trade-in, and our C&I equipment sales usually do not have trade-ins. This results
in a higher amount of used Agriculture equipment than used Transportation and C&I equipment. In addition, the
majority of our new John Deere equipment is on consignment from John Deere, whereas we purchase the new
equipment from our other manufacturers. These factors directly impact the amount of new and used equipment
in inventory. The majority of our product lines, in all segments, are manufactured in the US with pricing based in
US dollars, but invoiced in Canadian dollars. Inventory by segment for the year ended December 31, 2017
compared to December 31, 2016 is as follows:
($ thousands) December 31, 2017 December 31, 2016
Agricultural 226,664 176,719
Transportation 56,211 50,256
Commercial & Industrial 7,649 28,256
Total 290,524 255,231
As at December 31, 2017, inventories increased by $35.3 million when compared to $255.2 million at December
31, 2016. The $35.3 million increase is comprised of a $27.1 million increase in used equipment and a $11.6 million
increase in new inventory, partly offset by a $3.2 million decrease in parts.
Used inventory levels within the Agriculture segment increased $33.0 million as record new equipment sales in
the second and third quarter of 2017 came with used equipment taken on trade. The $20.6 million decrease in
inventory in the C&I segment is due to continued focus on reducing stock inventory and managing inventory
levels to the current Western Canadian equipment demand, partly offset by a $6.0 million increase in inventory in
our Transportation segment.
At December 31, 2017, the Company believes that the recoverable value of new and used equipment inventories
exceeds its respective carrying value. For the year ended December 31, 2017, the Company recognized inventory
valuation adjustments through cost of goods sold of $5.6 million (2016 - $6.2 million).
Accounts Receivable
For the year ended December 31, 2017 the average time to collect the Company’s outstanding accounts
receivable was approximately 13 days as compared to 18 days for the year ended December 31, 2016. At
December 31, 2017 no single outstanding customer balance, excluding sales contract financing receivables,
represented more than 10% of total accounts receivable. The Company closely monitors the amount and age of
balances outstanding on an on-going basis and establishes provisions for bad debts based on account aging,
combined with specific customers’ credit risk, historical trends, and other economic information.
The Company’s allowance for doubtful collections was $1.6 million at December 31, 2017 (2016 - $1.7 million),
which represents 5.1% (2016 – 4.5%) of outstanding trade accounts receivable and 0.1% (2016- 0.1%) of gross
revenue on an annual basis. Bad debt expense for the year ended December 31, 2017 amounted to a $0.9 million
expense (2016 - $0.3 million expense).

Cervus Annual Report 2017 25
Capital Resources
We use our capital to finance current operations and growth strategies. Our capital consists of both debt and
equity and we believe the best way to maximize shareholder value is to use a combination of equity and debt
financing to leverage our operations. A summary of the Company’s available credit facilities as at December 31,
2017 are as follows:
Total LimitsTotal LimitsTotal LimitsTotal Limits BorrowingsBorrowingsBorrowingsBorrowings
Letters of Letters of Letters of Letters of
CreditCreditCreditCredit
Amount Amount Amount Amount
AvailableAvailableAvailableAvailable Total LimitsTotal LimitsTotal LimitsTotal Limits BorrowingsBorrowingsBorrowingsBorrowings
Letters of Letters of Letters of Letters of
CreditCreditCreditCredit
Amount Amount Amount Amount
AvailableAvailableAvailableAvailable
Operating and other bank credit
facilities 101,925 25,589 2,400 73,936 100,000 11,100 2,556 86,344
Capital facilities (a) 12,082 15,543
Floor plan facilities and rental
equipment term loan financing (b) 133,119 97,220
Total borrowing 170,790 123,863
($ thousands)($ thousands)($ thousands)($ thousands)
December 31, 2017 December 31, 2016
(a) For capital facilities, the amount available under the facilities is limited to the lesser of the pre-approved
credit limit of $55.8 million (2016-$58.5 million) or the available unencumbered assets which is estimated
at $1.5 million as at December 31, 2017 (2016- $3.3 million).
(b) For floorplan facilities, the amount available under the facilities is limited to the lesser of the pre-approved
credit limit of $453.0 million (2016-$471.5 million) or the available unencumbered assets which is
estimated at $28.9 million as at December 31, 2017 (2016- $33.2 million).
Operating and Other Bank Credit Facilities
At December 31, 2017, the Company has a revolving credit facility with a syndicate of underwriters. The principal
amount available under this facility is $100 million. The facility was amended and extended on December 19, 2016.
The facility is committed for a three-year term, but may be extended on or before the anniversary date with the
consent of the lenders. The facility contains an $80.0 million accordion which the Company may request as an
increase to the total available facility, subject to lender approval. As at December 31, 2017 there was $25 million
drawn on the facility and $2.4 million had been utilized for outstanding letters of credit to John Deere.
We believe that the credit facilities available to the Company outlined above are sufficient to meet our sales targets
and working capital requirements for 2018.
The Company must meet certain financial covenants as part of its current credit facilities, as at the date of this
report, the Company is in compliance with all its covenants as follows:
2.55 1.99
1.69 1.43
10.01 21.03
December 31, 2016December 31, 2017
Total liabilities to net worth ratio(1) (not exceeding 4.0:1.0)
Fixed charge coverage ratio(2) (greater than or equal to 1.00:1 on
December 31, 2016, greater than or equal to 1.10:1.00)
Asset coverage ratio(3) (greater than 3.0:1.0)
1 – Calculated using an adjusted liability value over an adjusted equity value. Full definitions of adjusted liabilities and adjusted
equity are defined in the Syndicate Credit Agreement filed as a material document on Sedar.

Cervus Annual Report 2017 26
2 – Calculated as an adjusted EBITDA figure over the sum of interest expense, scheduled principal payments, operating lease
payments and distributions paid to shareholders in the twelve months prior to the calculation date. Full definitions of this
calculation are defined in the Syndicate Credit Agreement filed as a material document on Sedar.
3 – Calculated as net tangible total assets less consolidated debt excluding floorplan plan liabilities, plus debt due under the
credit facility over the amount due under the credit facility. Full definitions of this calculation are defined in the Syndicate Credit
Agreement filed as a material document on Sedar.
Capital Facilities
Capital facilities consist of capital asset financing primarily through credit facilities with Farm Credit Canada and
Affinity Credit Union. The Company’s financial covenants under its mortgages with Farm Credit Canada were
amended to align with certain of the Company’s financial covenants under its committed operating facility,
discussed above.
Floor Plan Facilities
Floor plan payables consist of financing arrangements for the Company’s inventories and rental equipment
financing with John Deere Canada ULC, Wells Fargo Equipment Finance Company, ECN Capital Corp., PACCAR
Financial Ltd., US Bank, and Canadian Imperial Bank of Commerce. At December 31, 2017, floor plan payables
related to inventories were $125.6 million.
Floor plan payables at December 31, 2017 represented approximately 43.2% of our inventories (December 31,
2016 – 33.7%). Floor plan payables fluctuate significantly from quarter to quarter based on the timing between
the receipt of equipment inventories and their actual repayment so that the Company may take advantage of any
programs made available to the Company by its key suppliers. Interest on floor plans at the contractual rate were largely offset by dealer rebates and interest free periods. Total
Agricultural segment interest otherwise payable on John Deere floor plans approximates $1.7 million for the year
ended December 31, 2017. This amount was offset by rebates applied during the year ended December 31, 2017,
of $1.5 million. At December 31, 2017, approximately 59% (2016 – 36%) of the C&I segment’s and 12% (2016 – 8%)
of the Transportation segment’s outstanding floor plan balances were non-interest bearing due to various
incentives and interest free periods in place.
Outstanding Share Data
As of the date of this MD&A, there are 15,688 thousand common shares and 687 thousand deferred shares
outstanding. On August 21, 2017, the Company announced a Normal Course Issuer Bid (the “Bid”), which
commenced on August 23, 2017, to purchase up to a maximum of 806 thousand common shares (the “Shares”)
for cancellation before August 22, 2018. All purchases are made in accordance with the Bid at the prevailing
market price of the Shares at the time of purchase. As at December 31, 2017, the Company had repurchased 240
thousand common shares under the NCIB.
As at December 31, 2017 and 2016, the Company had the following weighted average shares outstanding:
(thousands)
December 31,
2017
December 31,
2016
Basic weighted average number of shares outstanding 15,744 15,683
Dilutive impact of deferred share plan 696 745
Dilutive impact of convertible debenture 1,319 -
Diluted weighted average number of shares outstanding 17,759 16,428
The above table includes all dilutive instruments held by the Company. In 2016, the above per share amounts do
not include amounts associated with the Company’s convertible debenture as they are considered anti-dilutive.

Cervus Annual Report 2017 27
Dividends Paid and Declared to Shareholders
The Company, at the discretion of the Board of Directors, is entitled to make cash dividends to its shareholders.
The following table summarizes our dividends paid for the period ended December 31, 2017:
($ thousands, except
per share amounts)
Record Date
March 31, 2017 0.0700 1,104 195 909
June 30, 2017 0.0700 1,106 204 902
September 30, 2017 0.0700 1,092 184 907
December 31, 2017 0.0700 1,097 162 935
Total 0.2800 4,399 745 3,653
Dividend per Share
Dividends
Reinvested Net Dividend PaidDividend Payable
As of the date of this MD&A, all dividends as described above were paid (see “Capital Resources – Cautionary note
regarding dividends”).
Dividend Reinvestment Plan (“DRIP”)
The DRIP was implemented to allow shareholders to reinvest quarterly dividends and receive Cervus shares. For
shareholders who elect to participate, their periodic cash dividends are automatically reinvested in Cervus shares
at a price equal to 95% of the volume-weighted average price of all shares for the ten trading days preceding the
applicable record date. Eligible shareholders can participate in the DRIP by directing their broker, dealer, or
investment advisor holding their shares to notify the plan administrator, Computershare Trust Company of
Canada Ltd., through the Clearing and Depository Services Inc. (“CDS”), or directly where they hold the certificates
personally.
During the year ended December 31, 2017, 62 thousand common shares were issued through the Company’s
dividend reinvestment plan.
Taxation
Cervus’ 2017 dividends declared and paid through December 31, 2017 are considered to be eligible dividends for
tax purposes on the date paid.
Cautionary Note Regarding Dividends (see “Note Regarding Forward-Looking Statements”)
The payment of future dividends is not assured and may be reduced or suspended. Our ability to continue to
declare and pay dividends will depend on our financial performance, debt covenant obligations, and our ability
to meet our debt obligations and capital requirements. In addition, the market value of the Company’s common
shares may decline if we are unable to meet our cash dividend targets in the future, and that decline may be
significant. Under the terms of our credit facilities, we are restricted from declaring dividends or distributing cash
if the Company is in breach of its debt covenants. As at the date of this report, the Company is not in violation of
any of its covenants.

Cervus Annual Report 2017 28
SUMMARY OF RESULTS Annual Results Summary
($ thousands, except per share amounts)($ thousands, except per share amounts)($ thousands, except per share amounts)($ thousands, except per share amounts) 2017 2016 2015
Total revenues 1,221,285 1,109,939 1,133,878
Income (loss) for the year 19,912 23,524 (27,379)
Income (loss) for the year attributable to shareholders 19,917 23,712 (27,421)
Net income (loss) per share - basic 1.27 1.51 (1.77)
Net income (loss) per share - diluted 1.20 1.44 (1.77)
Cash provided by operating activities 33,593 16,164 23,674
EBITDA (1)53,840 61,025 46,330
Total assets 514,055 476,852 629,785
Total long-term liabilities 52,540 42,963 148,601
Total liabilities 288,802 263,013 436,492
Shareholders' equity 225,253 213,839 193,293
Net book value per share - diluted 12.68 13.02 12.49
Dividends declared to shareholders 4,399 4,394 13,202
Dividends declared per share 0.280 0.280 0.850
Weighted average shares outstanding
Basic 15,744 15,683 15,481
Diluted 17,759 16,428 15,481
Actual shares outstanding 15,675 15,750 15,606
[1] - Refer to Non-IFRS Measures herein

Cervus Annual Report 2017 29
Summary of Quarterly Results
($ thousands, except per share
amounts)
December 31,
2017
September 30,
2017
June 30,
2017
March 31,
2017
Revenues 272,726 360,087 357,361 231,110
Income (loss) attributable to the
shareholders 3,727 9,453 8,365 (1,628)
Gross profit 53,730 58,552 56,759 40,387
Gross profit margin 19.7% 16.3% 15.9% 17.5%
EBITDA 13,622 18,688 17,478 4,052
Income (loss) per share:
Basic 0.24 0.60 0.53 (0.10)
Diluted 0.23 0.57 0.50 (0.10)
Adjusted income (loss) per share(1)
Basic 0.25 0.58 0.46 (0.12)
Diluted 0.24 0.55 0.44 (0.12)
Weighted average shares outstanding
Basic 15,638 15,792 15,792 15,762
Diluted 16,335 16,614 16,619 15,762
($ thousands, except per share
amounts)
December 31,
2016
September 30,
2016
June 30,
2016
March 31,
2016
Revenues 271,943 334,682 294,772 208,542
Income attributable to the
shareholders8,753 10,741 2,485 1,733
Gross profit 46,488 57,571 47,788 39,218
Gross profit margin 17.1% 17.2% 16.2% 18.8%
EBITDA 18,008 21,981 10,997 10,039
Income per share:
Basic 0.55 0.67 0.16 0.11
Diluted 0.52 0.64 0.15 0.11
Adjusted income (loss) per share(1)
Basic 0.03 0.66 0.15 (0.16)
Diluted 0.02 0.63 0.14 (0.16)
Weighted average shares outstanding
Basic 15,996 15,991 15,994 15,622
Diluted 16,740 16,761 16,785 16,433
[1] - Refer to Non-IFRS Measures herein
Sales activity for the Agricultural segment is normally highest between April and September during growing
seasons in Canada and the impact on the growing seasons for New Zealand and Australia has not materially
impacted the above results. Activity in the Transportation sector generally increases in winter months, while the
Commercial and Industrial sector generally slows in the winter months. As a result, income or losses may not
accrue uniformly from quarter to quarter.

Cervus Annual Report 2017 30
MARKET OUTLOOK (see “Note Regarding Forward-Looking Statements”) The Company’s three operational segments are subject to broad market forces in addition to the underlying economic factors speci�c to the industries they serve. Further, the geographical diversity of the Company’s operations may temper or accelerate broader market forces in their signi�cance region to region. The following provides an overview of Management’s market outlook as it relates to the Company’s operations at time of writing. Alberta & Saskatchewan Agriculture remains the driving variable in the Company’s Western Canadian operations. The growing season in 2017 was marked by dry conditions in parts of Western Canada, however yields were generally better than expected and the overall quality of the crop was above that achieved in 2016.2 At the time of writing, accumulated snowfall across much of our growing area is positive for moisture levels, and the 2017 crop was ultimately favorable for producers. Agriculture and Agri-Food Canada is forecasting a marginal increase in crop production in 2018, while Canadian grain prices are expected to be supported by the Canadian dollar exchange rate. 3 Looking forward to 2018, farm �nancial health remains positive for Canadian producers, re�ected in early indicators of increased overall industry activity, along with customers equipment orders received for 2018 delivery. We continue to focus on equipment solutions which enhance our customer’s available equipment hours in production windows, accompanied by service support o�erings which deliver equipment uptime. In our Western Canadian Industrial segment, we have achieved accelerated pro�tability in 2017, due to internal e�ciencies enhanced by cautious market growth. Although TD Economics is forecasting Alberta to top provincial GDP growth in 2018 and into 2019,4 recovery has been slow for many of our industrial customers. In this environment we continue to focus on growing pro�t margins through e�cient delivery of our service o�erings, while continuing cost structure discipline. In our Saskatchewan Transportation dealerships, our focus is capturing oil�eld and ancillary demand growth, while leveraging parts and service opportunities both within and beyond our established Peterbilt equipment population.
Ontario The North American trucking market ended 2017 with total class 8 truck sales of 218,000 units, a small increase compared to the 216,000 class 8 trucks sold in 2016. For 2018, PACCAR is forecasting North American class 8 truck demand to increase considerably from 2017, with expected retail sales ranging between 235,000 and 265,000 trucks.5 This is a positive indicator for equipment demand, particularly as Ontario is Canada’s largest truck market. Our focus is to accelerate our �nancial performance in Ontario, and see both the actions we have taken in 2017 and overall industry sentiment as favorable.
New Zealand & Australia New Zealand Agriculture outlook is positive, with 2018 expected to be the second consecutive year of pro�tability for most New Zealand producers, building positive momentum in light of the tougher years experienced in recent history.6 World dairy prices have substantially recovered from the historical lows of 2015, while horticulture is supported by positive fruit and wine demand, and livestock demand from the United States and China for beef are positive for producers in 2018.7 Production is expected to be slightly down for producers in Cervus’ operating regions compared to previous years due to dry conditions early in the season, however, overall con�dence is high for New Zealand farmers. Cervus is focused on continuing the solid �nancial performance of 2017, supported by the capital equipment investment and maintenance implications of producers’ favorable outlook. The Australian agriculture outlook for 2018 is favorable as exchange rates have bene�ted commodity pricing for local producers, generally stable input costs, and positive weather conditions. Lamb and wool are experiencing
2 Agriculture and Agri-Food Canada, Outlook for Principal Field Crops, December 18, 2017, www.agr.gc.ca 3 Agriculture and Agri-Food Canada, Outlook for Principal Field Crops, February 16, 2018, www.agr.gc.ca 4 TD Economics, Provincial Economic Forecast, December 14, 2017, www.td.com/economics 5 PACCAR, 2017 Year end Press Release, January 30, 2018, www.paccar.com/news 6 Rabobank, Agribusiness Outlook 2018 New Zealand, www.rabobank.co.nz 7 Rabobank, Agribusiness Outlook 2018 New Zealand, www.rabobank.co.nz

Cervus Annual Report 2017 31
higher than average prices while beef and dairy remain �rm. Wine and wool are expected to be the standout commodities of 2018 with wine continuing the momentum on 15% growth in exports in the prior year and Asian demand for wool supporting the record high prices achieved last year.8 Crop yields for our geography in southern Victoria were impacted by late frosts that reduced yields across our key crop production area, however, the outlook for grain production remains positive. We anticipate opportunities to continue to meet customer needs pro�tably and e�ciently through 2018.
O�-Balance Sheet Arrangements In the normal course of business, we enter agreements that include indemnities in favor of third parties, such as engagement letters with advisors and consultants, and service agreements. We have also agreed to indemnify our directors, o�cers, and employees and those of our subsidiaries, in accordance with our governing legislation, our constating documents and other agreements. Certain agreements do not contain any limits on our liability and, therefore, it is not possible to estimate our potential liability under these indemnities. In certain cases, we have recourse against third parties with respect to these indemnities. Further, we also maintain insurance policies that may provide coverage against certain claims under these indemnities.
John Deere Credit Inc. (“Deere Credit”) provides �nancing to certain of the Company’s customers. A portion of this �nancing is with recourse to the Company if the amounts are uncollectible. At December 31, 2017, payments in arrears by such customers aggregated $226 thousand (2016 - $456 thousand). In addition, the Company is responsible for assuming the net residual value of all customer lease obligations held with Deere Credit, at the maturity of the contract, should the customer not elect to buy out the equipment at maturity. At December 31, 2017, the net residual value of such leases aggregated $269.1 million (2016 - $235.0 million) of which the Company believes all are recoverable. The Company is liable for a potential de�ciency in the event that the customer defaults on their lease obligation or retail �nance contract. Deere Credit retains 1% of the face amount of the �nance or lease contract for amounts that the Company may owe Deere Credit under this obligation. The deposits are capped at between 1% and 3% of the total dollar amount of the lease and �nance contracts outstanding. The maximum liability that can arise related to these arrangements is limited to the deposits of $2.2 million at December 31, 2017 (2016 - $2.7 million). Deere Credit reviews the deposit account balances quarterly and if the balances exceed the minimum requirements, Deere Credit refunds the di�erence to the Company. The Company has issued irrevocable standby Letters of Credit to Deere Credit and another supplier in the aggregate amount of $2.4 million. The Letters of Credit were issued in accordance with the dealership arrangements with the suppliers that would allow the supplier to draw upon the letter of credit if the Company was in default of any of its obligations.
8 ABC Rural, Agribusiness Outlook 2018, January 30, 2018, www.abc.net.au

Cervus Annual Report 2017 32
Transactions with Related Parties
Key Management Personnel Compensation
In addition to their salaries, the Company also provides non-cash benefits to its directors and executive officers.
The Company contributes to the deferred share plan on behalf of directors and executive officers, and to the
employee share purchase plan on behalf of executive officers, if enrolled, in accordance with the terms of the
plans. The Company has no retirement or post-employment benefits available to its directors and executive
officers, aside from permitting unvested deferred share units earned during employment to continue vesting
upon retirement.
Total remuneration of key management personnel and directors during the year ended December 31, 2017 and
2016 was:
($ thousands) 2017 2016
Short-term benefits 2,895 2,292
Share-based payments 694 529
Total 3,589 2,821
Other Related Party Transactions
Certain officers and dealer managers of the Company have provided guarantees to John Deere as required by
John Deere aggregating $5.4 million (2016 - $6.4 million). During the year ended December 31, 2017 and 2016,
the Company paid those individuals $170 thousand and $175 thousand, respectively, for providing these
guarantees which represents a similar amount to guarantee fees otherwise paid to financial institutions. These
transactions were recorded at the amount agreed to between the Company and the guarantors and are included
in selling, general and administrative expenses.

Cervus Annual Report 2017 33
Business Risks and Uncertainties
Risk Management Framework
The Board of Directors (“Board”) has overall responsibility for the establishment and oversight of the Company’s
risk management framework. The Board, together with the Audit Committee are responsible for monitoring and
oversight of the Company’s risk management policies. The Company’s risk management policies are established
to identify and analyze the risks faced by the Company, to set appropriate risk limits and controls, and to monitor
risks and adherence to limits. Risk management policies and systems are reviewed regularly to reflect changes in
market conditions and the Company’s activities. The Company, through its training and management standards
and procedures, aims to develop a disciplined and constructive control environment in which all employees
understand their roles and obligations.
The Company’s Audit Committee oversees how management monitors compliance with the Company’s risk
management policies and procedures, and reviews the adequacy of the risk management framework in relation
to the risks faced by the Company.
The Company’s objective is to manage operational risk so as to balance the avoidance of financial losses and
damage to the Company’s reputation with overall cost-effectiveness and to avoid control procedures that restrict
innovation and creativity. The primary responsibility for the development and implementation of controls to
address operational risk is assigned to senior management within each business unit. This responsibility is
supported by the development of overall Company standards for the management of operational risk.
The following are considered the primary categories of business risks and uncertainties faced by the business:
Market Risk Market risk is the risk that changes in the marketplace such as foreign exchange rates, interest rates and
commodity prices that will affect the Company’s income or the value of its holdings of financial instruments. The
objective of market risk management is to manage and control market risk exposures within acceptable
parameters while optimizing return. The Company’s primary approach to market risk is managing the quantity, type,
and applicability of its inventory, to facilitate regular inventory turnover in line with market demand.
Commodity Price The Company is primarily a business to business equipment retailer. Many of our customers’ businesses are very
capital intensive, and can be significantly affected by swift changes to external market factors beyond their
control. Commodity prices can be one of the most significant factors to our customers’ businesses, as rapid
changes in food input pricing, cattle pricing, or petroleum product pricing including carbon taxes can have a
material adverse effect on a large number of our customers. The Company’s financial success can be largely
impacted by changes in these business cycle factors in its customer base. These factors would potentially impact
the Company’s operating results through eroding margins on the products it sells, and valuation concerns over
the inventory it holds.
Monitoring inventory levels, periodic review of inventory valuation across segments, and increasing the
geographic distribution and industry alignments of our dealer network assist in reducing the impact of a
significant market downturn in one particular region or industry. However, the majority of sales continue to be
derived from the Agricultural sector. Consequently, market factors affecting the liquidity and outlook for our
Agriculture customers can significantly impact demand for equipment sales, parts & service. Ongoing focus on
internal efficiencies and excellence in after-market service to our customers assist in maintaining gross margin in
periods where our customers are not focused on capital investment.

Cervus Annual Report 2017 34
Foreign Currency Exposure Many of our products, including equipment and parts, are based on a U.S. dollar price as they are supplied
primarily by U.S. manufacturers but are settled in Canadian dollars as they are received. This may cause
fluctuations in the sales values assigned to equipment and parts inventories, as inventory is recorded based on
Canadian dollar cost at the time of receipt, but is sold to the customer based on market pricing prevailing at the
time of sale. Both sales revenues and gross profit margins may fluctuate based on differences in foreign exchange
rates between the purchase of inventory and sale of inventory. Certain of the Company’s manufacturers also have
programs in place to facilitate and/or reduce the effect of foreign currency fluctuations, primarily on the
Company’s new equipment inventory purchases.
Further, a portion of the Company’s owned inventory is floor planned in U.S. dollars. As such, U.S. dollar
denominated floor plan payables are exposed to fluctuations in the U.S. dollar exchange rate until the unit is sold
and the floorplan is repaid. At the time of sale, the Company determines a margin based on the replacement cost
of the inventory at the time of sale, not the initial cost of the inventory at the time of purchase. In so doing, the
Company’s objective is to obtain a target margin on the sale of inventory, by calculating the sale margin based on
the cost of repaying the U.S. dollar floorplan as at the sale date. If the Company was unable to recapture
fluctuations in the U.S./CAD dollar in the sales price for equipment floor planned in U.S. dollars, a $0.01 change in
the U.S. exchange rate would have increased (decreased) comprehensive income by $108 thousand (2016 - $80
thousand), based on the U.S. dollar floor plan balances at December 31, 2017. From time to time the Company
also enters into foreign exchange forward contracts to manage exposure on timing difference between the
payout of floorplan and receipt of funds from a customer.
In addition, the Company is exposed to foreign currency fluctuation related to translation adjustments upon
consolidation of its Australian and New Zealand operations. These foreign subsidiaries report operating results in
Australia and New Zealand dollars, respectively. Movements in these currencies relative to the Canadian dollar will
impact the consolidated results of these operations. Based on the Company’s results reported from its foreign
subsidiaries, a strengthening or weakening of the Canadian dollar by 5% against the New Zealand dollar at
December 31, 2017 would have increased (decreased) comprehensive income by $768 thousand (2016 - $612
thousand). A strengthening or weakening of the Canadian dollar by 5% against the Australian dollar at December
31, 2017 would have increased (decreased) comprehensive income by $302 thousand (2016 -$215 thousand).
Interest Rate Risk The Company’s cash flow is exposed to changes in interest rates on its floor plan arrangements and certain term
debt which bear interest at variable rates. The cash flows required to service these financial liabilities will fluctuate
as a result of changes in market interest rates. The Company mitigates its exposure to interest rate risk by utilizing
excess cash resources to buy-down or pay-off interest bearing contracts, and by managing its floor plan payables
and inventory levels (turnover) to maximize the benefit of interest-free periods, where available.
Based on the Company’s outstanding long-term debt at December 31, 2017, a one percent increase or decrease
in market interest rates would impact the Company’s annual interest expense by approximately $1.7 million (2016-
$1.2 million).

Cervus Annual Report 2017 35
Reliance on our Key Manufacturers and Dealership Arrangements
Cervus’ primary source of income is from the sale of agricultural, transportation, and commercial and industrial
equipment and products and services pursuant to agreements to act as an authorized dealer. The agreement with
John Deere Limited (“JDL”) provides a framework under which JDL can terminate a John Deere dealership if such
dealership fails to maintain certain performance and equity covenants. Each contract also provides a one-year
remedy period whereby the Company has one year to restore any deficiencies.
The dealership agreements with John Deere obligate the Company to assume leased equipment at residual value
upon the maturity of Customer’s leases with John Deere. This equipment is then sold by Cervus as used
equipment. In the unlikely event of a severe market shock, residual values set at the beginning of a 5-year lease
term may exceed market value of the equipment upon lease maturity. Cervus routinely reviews the residual values
and maturity of customers’ leases with John Deere, and is satisfied with the residual values reflected in the leases
and the Company’s ability to profitably market the equipment as leases mature. At December 31, 2017, customer
equipment leases with John Deere represented residual values of $269,146 thousand, maturing over the next five
years.
The Company also has dealership agreements in place with Peterbilt, Bobcat, JCB, CMI, Clark, Sellick, and
Doosan. These agreements are one to three-year agreements and are normally renewed annually, except for
unusual situations such as bankruptcy or fraud.
The success of our dealerships depends on the timely supply of equipment and parts from our manufacturers to
ensure the timely delivery of products and services to our customers. We also depend on our suppliers to provide
competitive prices and quality products. Currently, all of our dealership contracts are in good standing with our
suppliers. There can be no guarantee that: (i) circumstances will not arise which give these equipment
manufacturers the right to terminate their dealership agreements or (ii) one or more of the equipment
manufacturers will decide not to renew their dealership agreements with us upon expiry.
Inventory Risk
The Company’s inventory consists primarily of new and used equipment related to our Agriculture, Transportation
and C&I segments. We acquire new inventory from our OEMs for retail sale. Used inventory, particularly in our
Agriculture Segment, is primarily acquired in the form of trade-ins on the sale of existing inventory. While the
Company believes it has appropriate inventory management systems in place, variations in market demand for
the products we sell, as well as external market conditions beyond our control, can result in certain items in our
inventory becoming obsolete, or otherwise requiring a write-down of our inventory balance.
Industry Competitive Factors
Authorized John Deere agricultural dealerships sell John Deere agricultural, turf, and sport products and
equipment. The majority of sales are derived from the Agricultural sector. The retail agricultural equipment
industry is very competitive. The Company faces a number of competitors, including other “in-line” John Deere
dealerships and other competitors including authorized Agco, Case, Kubota and New Holland dealerships that
may be located in and around communities in which the Company’s dealerships are located. Deere & Company
has a reputation for the manufacture and delivery of high quality, competitively priced products. John Deere has
the largest market share of manufacturing and sales of farm equipment in North America. There can be no
assurance that John Deere will continue to maintain its market share in the future.
The Transportation equipment group primarily sells transport equipment through PACCAR, which manufacturers
Peterbilt and Kenworth trucks. The major competitors to Peterbilt are Kenworth, International, Freightliner, Volvo,
and Mack trucks. The segment is highly dependent on consumer and commercial transportation of goods, as well
as service-based industries including oil and gas in western Canada, and manufacturing in eastern Canada. This
diverse customer base does mitigate the risks inherent in any one of those customer segments.
Cervus Annual Report 2017 36
The Commercial and Industrial segment sells light and medium construction equipment and is comprised of
several lines of commercial equipment from major manufacturers, Bobcat and JCB. The major competitors are
Caterpillar, Komatsu, CNH (Case), John Deere Industrial, Volvo, Hitachi and Liebherr. The light and medium
commercial equipment market is very much dependent upon residential and commercial construction. The
segment also sells industrial equipment from several manufacturers, Clark, Sellick, and Doosan being the major
suppliers. Their major competitors are Toyota, Hyster, Crown, and Caterpillar. Industrial equipment is primarily
sold to building supply companies, warehousing, food processors, oilfield supply companies, and the grocery
industry. This customer diversity mitigates to some degree the risks inherent in any one of these customer
segments.
Presently the majority of the Transportation, and Commercial and Industrial equipment segment revenues are
derived from the sale of Peterbilt, Bobcat, JCB, Sellick, and Doosan equipment and products. All these equipment
manufacturers have established themselves as industry leaders in our markets for the manufacture and delivery
of on-highway, vocational and medium duty Transportation equipment and light Commercial and Industrial
equipment. There can be no assurance however that these suppliers will continue to manufacture high quality,
competitively priced products or maintain their market share in the future.
Seasonality and Cyclicality
Weather has a direct impact on our customers’ earnings, particularly in the Agricultural segment, which in turn
affects their need and ability to purchase equipment. The Transportation and Commercial and Industrial segments
are not as seasonal when compared to the agricultural business on an annual basis, but can fluctuate based on
equipment replacement cycles and market factors beyond our control.
Human Resources
The ability to provide high-quality services to our customers depends on our ability to attract and retain well-
trained, experienced employees. Certain of the geographic areas in which we operate are experiencing a very
high demand for and corresponding shortage of quality employees. We need to attract and retain quality
employees, or our long-term success and ability to take advantage of growth opportunities could be threatened.
We have established a number of human resource initiatives and compensation strategies to address this risk.
Legislative
The Company is subject to comply with a broad range of legislation, regulation and government policies. A change
in existing legislation could negatively impact operations.
Increased political pressure on carbon emissions has led to the institution of provincial and federal carbon taxes.
The impact to our immediate business is the cash flow implications for our customers. While the full impact of
carbon pricing cannot yet be determined, the Company is managing this risk by increased focus on emissions
control features in the products we sell and being knowledgeable regarding recent developments in new
techniques for reducing carbon emissions for our farm customers.
Political changes in the U.S. may have an impact on duties charged for goods sold to the U.S. At this point, the
Company is an importer of goods from the U.S. and does not anticipate significant risks relating to trade
negotiations between Canada and the U.S.
Environmental Risks
Our dealerships routinely handle hazardous and non-hazardous waste as part of their day-to-day operations and
though the Company believes it is in full compliance with applicable laws, from time-to-time, the Company may
be involved in, and subject to, incidents and conditions that render us in non-compliance with environmental laws
and regulations. The Company has established safety programs to help reduce these risks. The Company is not
aware of any material environmental liabilities at this time.
Cervus Annual Report 2017 37
Acquisition and Integration Risks
Strategic acquisitions have been an important element of Cervus’ business strategy, and Cervus expects to
continue to pursue such acquisitions in the future. Although Cervus engages in discussions with, and submits
proposals to acquisition candidates, suitable acquisitions may not be available in the future on reasonable terms.
If Cervus does identify an appropriate acquisition candidate, Cervus may not be able to successfully negotiate the
terms of the acquisition, finance the acquisition or, if the acquisition occurs, effectively integrate the acquired
business into Cervus’ existing business. In addition, the negotiation of a potential acquisition and the integration
of an acquired business may require a disproportionate amount of management's attention and resources.
Cervus’ inability to successfully identify, execute, or effectively integrate future or previous acquisitions may
negatively affect its results of operations. Even though Cervus performs a due diligence review of the businesses
it acquires that it believes is consistent with industry practices, such reviews are inherently incomplete. Even an
in-depth due diligence review of a business may not necessarily reveal existing or potential problems or permit
Cervus to become familiar enough with the business to fully assess its deficiencies and potential. Even when
problems are identified, Cervus may assume certain risks and liabilities in connection with the acquired business.
Credit Risk
By granting credit sales to customers, it is possible these customers may experience financial difficulty and be
unable to fulfill their repayment obligations. The Company’s revenue is generated from customers in the farming,
construction, industrial, and transportation industries, resulting in a concentration of credit risk from customers in
these industries. The strength of our Agricultural segment is influenced by the prices of crop inputs, commodity
prices, as well as local and global weather patterns in a growing season. Our Commercial and Industrial equipment
segment is influenced by general economic and construction activity, and due to location, oil prices for Western
Canadian crude oil. Our Transportation segment is influenced by regional, national, and North American
economic activity, particularly factors impacting oil and gas activity, manufacturing and the demand for, and
transportation of, consumer and industrial goods.
A significant decline in economic conditions within these industries would increase the risk that customers will
experience financial difficulty and be unable to fulfill their obligations to the Company. The Company’s exposure
to credit risk arises from granting credit sales and is limited to the carrying value of accounts receivable, and
deposits and guarantees with John Deere. The Company’s revenues are normally invoiced with payment terms
of net, 30 days. The average time to collect the Company’s outstanding accounts receivable was approximately
13 days for the year ended December 31, 2017 (18 days for the year ended December 31, 2016) and no single
outstanding customer balance, excluding sales contract financing receivables, represented more than 10% of total
accounts receivable. The Company mitigates its credit risk by assessing the credit worthiness of its customers on
an ongoing basis. The Company closely monitors the amount and age of balances outstanding on an on-going
basis and establishes provisions for bad debts based on specific customers’ credit risk, historical trends, and other
economic information.
Capital Risk Management
The Company’s objective when managing its capital is to safeguard its ability to continue as a going concern, so
that it generates returns for Shareholders, expands business relationships with stakeholders, and identifies risk
and allocates its capital accordingly. In the management of capital, the Company considers its capital to comprise
long- term debt, the current portion of long-term debt and all components of equity.
The Company sets the amount of capital in proportion to risk. The Company manages the capital structure and
makes adjustments to it in the light of changes in economic conditions and the risk characteristics of the
underlying assets. In order to maintain or adjust the capital structure, the Company may issue or repurchase
shares, raise or retire term debt, and/or adjust the amount of distributions paid to the Shareholders.
The Company uses the following ratios in determining its appropriate capital levels:
a) Debt to Total Capital ratio (long-term debt plus current portion of long term debt divided by long-term
debt plus current portion of long-term debt plus book value of equity);

Cervus Annual Report 2017 38
b) Return on Invested Capital ratio (income before income tax expense plus interest on long-term debt
divided by total capital);
c) Debt to Tangible Assets ratio (calculated as total debt divided by total assets less goodwill and
intangibles); and,
d) Fixed Charge Coverage ratio (calculated as adjusted earnings divided by contractual principle, interest,
shareholder distributions, and lease payments).
There were no changes in the Company’s approach to capital management in the period.
Debt Financing
The ability of the Company to pay dividends or make other payments or advances, will be subject to applicable
laws and contractual restrictions contained in the instruments governing the Company’s indebtedness. The
degree to which the Company is leveraged could have important consequences to the holders of the Common
Shares, including:
• The Company’s ability to obtain additional financing for working capital, capital expenditures or
acquisitions in the future may be limited;
• A significant portion of the Company’s cash flow from operations may be dedicated to the payment of
the principal and interest on its indebtedness, thereby reducing funds available for future operations and
distributions; and
• Certain of the Company’ borrowings may be at variable rates of interest, which exposes it to the risk of
increased interest rates; and that the Company may be vulnerable to economic downturns including the
Company’s ability to retain and attract customers.
Also, there can be no assurance that the Company will continue to generate sufficient cash flow from operations
to meet required interest and principal payments. Further, the Company is subject to the risk that any of its
existing indebtedness may not be able to be refinanced upon maturity or that the terms of such financing may
not be as favourable as the terms of its existing indebtedness. These factors may adversely affect the frequency or
amounts of dividends paid by the Company.
The Company’s various credit facilities provide first charge security interests on all of its assets to its various
lenders. These credit facilities contain numerous terms and covenants that limit the discretion of management
with respect to certain business matters. These covenants place restrictions on, among other things, the ability of
the Company to create liens or other encumbrances, to pay dividends on its securities or make certain other
payments, investments, loans and guarantees and to sell or otherwise dispose of assets and merge or consolidate
with another entity. In addition, the credit facilities contain a number of financial covenants that require the
Company to meet certain financial ratios and financial condition tests. A failure to comply with the obligations in
the credit facilities could result in a default which, if not cured or waived, could result in a reduction or termination
of the Company’s dividends, and may permit acceleration of the relevant indebtedness. If the indebtedness under
the credit facilities were to be accelerated, there can be no assurance that the assets of the Company would be
sufficient to repay in full that indebtedness.
Although the Company intends to pay quarterly dividends to the holders of the Company’s Common Shares, these
dividends are not assured and may be reduced or suspended in order to comply with the credit facilities of the
Company. The market value of the Common Shares may decline if the Company is unable to meet its dividend
targets in the future, and that decline may be significant.
Cyber Security and Terrorism
The Company may be threatened by problems such as cyber‐attacks, computer viruses, or terrorism that may
disrupt operations and harm operating results. The Company’s business requires the continued operation of
information technology systems and network infrastructure. Despite the implementation of security measures,
technology systems are vulnerable to disability or failures due to hacking, viruses, acts of war or terrorism, and
other causes. If the Company’s information technology systems were to fail and the Company was unable to
recover in a timely way, the Company might be unable to fulfill critical business functions, which could have a
material adverse effect on its business, financial condition, and results of operations.

Cervus Annual Report 2017 39
Critical Accounting Estimates and Judgments
Preparation of Unaudited and Audited Consolidated Financial Statements requires that we make assumptions
regarding accounting estimates for certain amounts contained within the unaudited and audited consolidated
financial statements. We believe that each of our assumptions and estimates is appropriate to the circumstances
and represents the most likely future outcome. However, because of the uncertainties inherent in making
assumptions and estimates regarding unknown future outcomes, future events may result in significant
differences between estimates and actual results.
Determination of Fair Values
A number of the Company’s accounting policies and disclosures require the determination of fair value, for both
financial and non-financial assets and liabilities. Fair values have been determined for measurement and/or
disclosure purposes based on the following methods.
Fair Value of Assets and Liabilities Acquired in Business Combinations
The value of acquired assets and liabilities on the acquisition date require the use of estimates to determine the
purchase price allocation. Estimates are made as to the valuations of property, plant, and equipment, intangible
assets, and goodwill, among other items. These estimates have been discussed further below.
Property, Plant and Equipment The fair value of property, plant and equipment recognized as a result of a business combination or when
determined in an impairment test is the estimated amount for which a property could be exchanged on the
measurement date between a willing buyer and a willing seller in an arm’s length transaction after proper
marketing wherein the parties had each acted knowledgeably. The fair value of items of plant, equipment, fixtures
and fittings is based on the market approach and cost approaches using quoted market prices for similar items
when available and depreciated replacement cost when appropriate. Depreciated replacement cost reflects
adjustments for physical deterioration as well as functional and economic obsolescence.
Intangible Assets The fair value of dealership distribution agreements and trade names acquired in a business combination is based
on the incremental discounted estimated cash flows realized post-acquisition, or expenditures avoided, as a result
of owning the intangible assets. The fair value of customer lists acquired in a business combination is determined
using income based approaches, whereby the subject asset is valued after deducting a fair return on all other
assets that are part of creating the related cash flows. The fair value of other intangible assets including non-
competition agreements is based on the discounted cash flows expected to be derived from the use and any
residual value of the assets.
Inventories The fair value of inventories acquired in a business combination is determined based on the estimated selling
price in the ordinary course of business less the estimated costs of completion and sale, and a reasonable profit
margin based on the effort required to complete and sell the inventories.
Trade and Other Receivables The fair value of trade and other receivables is estimated at the present value of the future cash flows, discounted
at the market rate of interest at the reporting date. The fair value is determined for disclosure purposes or when
such assets are acquired in a business combination.
Other Non-Derivative Financial Liabilities Fair value, which is determined for disclosure purposes, is calculated based on the present value of future principal
and interest cash flows, discounted at the market rate of interest at the reporting date. In respect of the liability
component of convertible debentures, the market rate of interest is determined by reference to similar liabilities
that do not have a conversion option.

Cervus Annual Report 2017 40
Derivative Financial Instruments The fair value of foreign currency derivative financial instruments is calculated based on a market comparison
technique. The fair value is based on similar contracts in an active market and based on quotes using the prevailing
foreign exchange translation rate from the Bank of Canada or similar sources.
Taxation Matters
Income tax provisions, including current and future income tax assets and liabilities, require estimates and
interpretations of federal and provincial income tax rules and regulations, and judgements as to their
interpretation and application to our specific situation. Estimates are also made as to the availability of future
taxable profit against which carryforward tax losses can be used.
Lease Arrangements
In determining classification of leases as an operating or finance lease, the Company applies judgement to
determine whether substantially all of the significant risks and rewards of ownership are transferred to the
customer or remain with the Company; or where the Company is the lessee, whether substantially all the
significant risks and rewards of ownership are transferred to the Company or remain with the lessor. These
judgements can be significant as to how the Company classifies amounts related to the arrangements as rental
equipment, net investment in finance lease, or lease obligation of these arrangements.
Net Realizable Value of Inventories
Inventories are recorded at the lower of cost and net realizable value. The most significant area of accounting
estimate involves our evaluation of used equipment inventory net realizable value. We perform ongoing quarterly
reviews of our used equipment inventories based upon local market conditions and the changes in the U.S.
currency exchange rates to determine whether any adjustments are required to our carrying cost of inventory
balances to ensure they are properly stated.
Asset Impairment
We assess the carrying value of long-lived assets, which include property, plant, and equipment and intangible
assets, for indications of impairment when events or circumstances indicate that the carrying amounts may not
be recoverable from estimated cash flows. Estimating future cash flows requires assumptions about future
business conditions and technological developments. Significant, unanticipated changes to these assumptions
could require a provision for impairment in the future.
Judgement is used in identifying impairment triggers and the cash generating unit or group of cash generating
units at which goodwill, intangible assets, and property and equipment are monitored for internal management
purposes and identifying an appropriate discount rate for these calculations.
Goodwill is assessed for impairment at least annually. This assessment includes a comparison of the carrying value
of the Cash Generating Unit (“CGU”) to its estimated recoverable amount to ensure that the recoverable amount
is greater than the carrying value. The recoverable amount of an asset or cash-generating unit is the greater of
its value in use and its fair value less costs to sell. In assessing value in use, the estimated future cash flows are
discounted to their present value using a pre-tax discount rate that reflects current market assessments of the
time value of money and the risks specific to the asset. These valuation methods employ a variety of assumptions,
including future revenue growth, expected profit, and profit multiples. Estimating the recoverable amount of a
CGU is a subjective process and requires the use of our best estimates. If our estimates or assumptions change
from those used in our current valuation, we may be required to recognize an impairment loss in future periods.

Cervus Annual Report 2017 41
Future Accounting Standards
Certain new or amended standards or interpretations have been issued by the IASB or IFRIC that are required to
be adopted in the future periods. The new standards and amendments to existing standards, which have not been
applied in preparing the Audited Consolidated Financial Statements as at December 31, 2017, are:
Revised Standard
Description Impact of Application Effective Date
IFRS 15 –
Revenue from
Contracts
with
Customers
Effective January 1, 2018, the
Company will be required to adopt
IFRS 15 related to revenue from
contracts with customers. Revenue
from Contracts with Customers, was
issued in May 2014 and replaces IAS
11 Construction Contracts, IAS 18
Revenue, IFRIC 13 Customer Loyalty
Programs, IFRIC 15 Agreements for
the Construction of Real Estate,
IFRIC 18 Transfers of Assets from
Customers and SIC-31 Revenue –
Barter Transactions Involving
Advertising
Services.
The Company has completed an
assessment to determine the
potential impact on its
consolidated financial statements.
Based on the analysis completed,
the Company concludes that there
is no significant impact on the
amounts reported in the financial
statements.
Annual periods
beginning on or
after January 1,
2018
IFRS 9 –
Financial
Instruments
The IASB has released IFRS 9, related
to the accounting and presentation
of financial instruments and applies
a principal-based approach to the
classification and measurement of
financial assets and financial
liabilities, including an expected
credit loss model for calculating
impairment, and includes new
requirements for hedge accounting.
The Company intends to adopt IFRS
9 in its financial statements for the
annual period beginning on
January 1, 2018. Based on the
analysis completed, the Company
concludes that there is no
significant impact on the amounts
reported in the financial
statements.
Annual periods
beginning on or
after January 1,
2018

Cervus Annual Report 2017 42
Revised Standard
Description impact of Application Effective Date
IFRS 16 -
Leases
On January 13, 2016 the IASB issued
IFRS 16 Leases. The new standard is
effective for annual periods
beginning on or after January 1,
2019. Earlier application is
permitted for entities that apply
IFRS 15 Revenue from Contracts
with Customers at or before the
date of initial adoption of IFRS 16.
IFRS 16 will replace IAS 17 Leases.
The Company intends
to adopt IFRS 16 in its financial
statements for the annual period
beginning on January 1, 2019 and
is completing an assessment
documenting the potential impact
on its consolidated financial
statements. Under the application
of this standard, the operating
lease commitments are expected
to be the primary source of
changes to the consolidated
statements of financial position
and the timing of expenses in the
consolidated statements of
comprehensive income.
Annual periods
beginning on or
after January 1,
2019.

Cervus Annual Report 2017 43
Responsibility of Management and Board Disclosure Controls
The CEO and the CFO are also responsible for establishing and maintaining adequate disclosure controls and
procedures (“DC&P”). Disclosure controls and procedures are controls and other procedures designed to provide
reasonable assurance that information required to be disclosed in documents filed or submitted under securities
legislation is recorded, processed, summarized and reported within the time periods specified in securities
legislation and includes controls and procedures designed to ensure that information required to be disclosed in
documents filed or submitted under securities legislation is accumulated and communicated to the Company’s
management, including the CEO and CFO, as appropriate to allow timely decisions regarding required disclosure.
The CEO and the CFO evaluated, or caused to be evaluated under their supervision, the effectiveness of our
disclosure controls and procedures and based on this evaluation, the CEO and the CFO concluded that, as of
December 31, 2017, Cervus’ disclosure controls and procedures are effective.
Internal Controls over Financial Reporting
The Chief Executive Officer (“CEO”) and the Chief Financial Officer (“CFO”) of Cervus are responsible for establishing
and maintaining adequate internal control over financial reporting (“ICFR”). Internal control over financial
reporting is a process designed by, or under the supervision of, the CEO and the CFO and effected by the Board of
Directors, management and other personnel to provide reasonable assurance regarding the reliability of financial
reporting and the preparation of financial statements for external purposes in accordance with IFRS.
The CEO and the CFO evaluated, or caused to be evaluated under their supervision, the effectiveness of the
Corporation’s internal control over financial reporting as of December 31, 2017, based on the criteria set forth in
Internal Control – Integrated Framework issued by the Committee of Sponsoring Organizations of the Treadway
Commission (“COSO”), (2013). Based on this assessment, the CEO and the CFO concluded that, as of December
31, 2017, Cervus’ internal control over financial reporting are effective. There was no change to the Company’s
ICFR that occurred during the most recent interim period that has materially affected, or is reasonably likely to
materially affect the Company’s ICFR.
It should be noted a control system, including the Company’s DC&P and ICFR, no matter how well conceived or
operated, can provide only reasonable, not absolute, assurance that the objective of the control system will be
met, and it should not be expected that DC&P and ICFR will prevent all errors or fraud.

Cervus Annual Report 2017 44
Additional IFRS Financial Measures
This MD&A contains certain financial measures that do not have any standardized meaning prescribed by IFRS.
Therefore, these financial measures may not be comparable to similar measures presented by other issuers. These
measures are identified and defined below:
Gross Profit
Gross profit refers to the Company’s total revenue less costs directly attributed to generating the related sales
revenue. This additional IFRS measure is identified in our Audited Consolidated Financial Statements on the
statement of comprehensive income. Gross profit provides a measure to assess the Company’s profitability and
efficiency of revenue generated, prior to considering selling, general and administrative expenses.
Gross profit margin is the percentage resulting from dividing Gross Profit from a transaction by the revenue
generated by the same transaction.
Income (Loss) from Operating Activities
Income from operating activities refers to income (loss) excluding: general interest expense recognized outside of
cost of goods sold, interest income, share of profit (loss) from equity investees, and income tax. This additional
IFRS measure is identified in our Audited Consolidated Financial Statements on the statement of comprehensive
income. Income from operating activities is a useful supplemental earnings measure as it provides an indication
of the financial results generated by our principal business activities prior to consideration of how these activities
are financed or how the results are taxed in various jurisdictions and the effects of earnings from equity investees.
Non-IFRS Financial Measures
This MD&A contains certain financial measures that do not have any standardized meaning prescribed by IFRS.
Therefore, these financial measures may not be comparable to similar measures presented by other issuers.
Investors are cautioned that these measures should not be construed as an alternative to profit or to cash flow
from operating, investing, and financing activities determined in accordance with IFRS as indicators of our
performance. These measures are provided to assist investors in determining our ability to generate profit and
cash flow from operations and to provide additional information on how these cash resources are used. These
financial measures are identified and defined below:
Adjusted Income
Adjusted income is provided to aid in the comparison of the Company’s results from one period, to the Company’s
results from another period. The Company calculates Adjusted Income as follows:

Cervus Annual Report 2017 45
Adjusted Income Attributed to Shareholders
($ thousands, except per share amounts) 2017 2016 2017 2016
Income attributed to shareholders 3,727 8,753 19,917 23,712
Adjustments:
Unrealized foreign currency loss (gain)(1)188 (304) (890) (3,501)
(Gain) on sale of equity accounted investees - (4,146) - (4,146)
(Gain) on sale of land and building - (3,887) (417) (5,262)
Tax impact of adjustments (50) 268 365 1,285
Adjusted income attributed to shareholders 3,865 684 18,975 12,088
Adjusted income per share:
Basic 0.25 0.04 1.21 0.77
Diluted 0.24 0.04 1.14 0.74
Three month periods
ended December 31Year ended December 31
Adjusted Income (Loss) Before Income Tax Expense
Three Months Ended December 31, 2017
Reconciliation of Adjusted Income (Loss) Before
Income Tax Expense ($ thousands)
Three months ended December 31, 2017 TotalTotalTotalTotal AgriculturalAgriculturalAgriculturalAgricultural TransportationTransportationTransportationTransportation
Commercial & Commercial & Commercial & Commercial &
IndustrialIndustrialIndustrialIndustrial
Income (loss) before income tax expense 5,709 8,635 (3,418) 492
Adjustments:
Unrealized foreign currency loss (1) 188 - 185 3
Adjusted income (loss) before income tax expense 5,897 8,635 (3,233) 495
Year Ended December 31, 2017
Reconciliation of Adjusted Income (Loss) Before
Income Tax Expense ($ thousands)
Year ended December 31, 2017 TotalTotalTotalTotal AgriculturalAgriculturalAgriculturalAgricultural TransportationTransportationTransportationTransportation
Commercial & Commercial & Commercial & Commercial &
IndustrialIndustrialIndustrialIndustrial
Income (loss) before income tax expense 28,958 29,479 (3,562) 3,041
Adjustments:
Unrealized foreign currency (gain) (1) (890) - (685) (205)
(Gain) on sale of land and building (417) (417) - -
Adjusted income (loss) before income tax expense 27,651 29,062 (4,247) 2,836

Cervus Annual Report 2017 46
Three Months Ended December 31, 2016
Reconciliation of Adjusted Income (Loss) Before
Income Tax Expense ($ thousands)
Three months ended December 31, 2016 TotalTotalTotalTotal AgriculturalAgriculturalAgriculturalAgricultural TransportationTransportationTransportationTransportation
Commercial & Commercial & Commercial & Commercial &
IndustrialIndustrialIndustrialIndustrial
Income (loss) before income tax expense 10,804 12,394 (1,025) (565)
Adjustments:
Unrealized foreign currency (gain) (1) (304) - (304) -
(Gain) on sale of equity accounted investees (4,146) (4,146) - -
(Gain) on sale of land and building (3,887) (3,439) (448) -
Adjusted income (loss) before income tax expense 2,467 4,809 (1,777) (565)
Year Ended December 31, 2016
Reconciliation of Adjusted Income (Loss) Before
Income Tax Expense ($ thousands)
Year ended December 31, 2016 TotalTotalTotalTotal AgriculturalAgriculturalAgriculturalAgricultural TransportationTransportationTransportationTransportation
Commercial & Commercial & Commercial & Commercial &
IndustrialIndustrialIndustrialIndustrial
Income (loss) before income tax expense 30,566 28,414 3,256 (1,104)
Adjustments:
Unrealized foreign currency (gain) (1) (3,501) - (3,501) -
(Gain) on sale of equity accounted investees (4,146) (4,146) - -
(Gain) on sale of land and building (5,262) (3,360) (448) (1,454)
Adjusted income (loss) before income tax expense 17,657 20,908 (693) (2,558)
[1] –Unrealized foreign exchange gains and losses are due to changes in fair value of our derivative financial asset and from
period close translation of floorplan payables and cash denominated in US dollars. The unrealized foreign currency gains and
losses are treated as an adjustment to the Company’s adjusted income calculation as these foreign currency gains and losses
are not realized until settlement. Until settlement occurs, there may be large fluctuations period to period on movement of the
foreign exchange rate, making comparison of operating performance period over period difficult.

Cervus Annual Report 2017 47
EBITDA
Throughout the MD&A, reference is made to EBITDA, which Cervus’ management defines as earnings before
interest, income taxes and depreciation and amortization. Management believes that EBITDA is a key performance
measure in evaluating the Company’s operations and is important in enhancing investors’ understanding of the
Company’s operating performance. As EBITDA does not have a standardized meaning prescribed by IFRS, it may
not be comparable to similar measures presented by other companies. As a result, we have reconciled profit as
determined in accordance with IFRS to EBITDA, as follows:
Three Months Ended December 31, 2017
EBITDA ($ thousands)
Three months ended December 31, 2017 Total Agricultural Transportation
Commercial &
Industrial
Net income (loss) attributable to shareholders 3,727 5,760 (2,349) 316
Add:
Interest 1,392 652 679 61
Income taxes 1,982 2,875 (1,070) 177
Depreciation and Amortization 6,521 1,844 3,945 732
EBITDA 13,622 11,131 1,205 1,286
Reconciliation of adjusted EBITDA:
EBITDA 13,622 11,131 1,205 1,286
Adjustments:
Unrealized foreign currency loss 188 - 185 3
Adjusted EBITDA 13,810 11,131 1,390 1,289
Year Ended December 31, 2017
EBITDA ($ thousands)
Year ended December 31, 2017 Total Agricultural Transportation
Commercial &
Industrial
Net income (loss) attributable to shareholders 19,917 20,276 (2,449) 2,090
Add:
Interest 7,289 3,593 3,152 544
Income taxes 9,046 9,208 (1,113) 951
Depreciation and Amortization 17,588 7,029 7,852 2,707
EBITDA 53,840 40,106 7,442 6,292
Reconciliation of adjusted EBITDA:
EBITDA 53,840 40,106 7,442 6,292
Adjustments:
Unrealized foreign currency (gain) (890) - (685) (205)
(Gain) on sale of land and building (417) (417) - -
Adjusted EBITDA 52,533 39,689 6,757 6,087
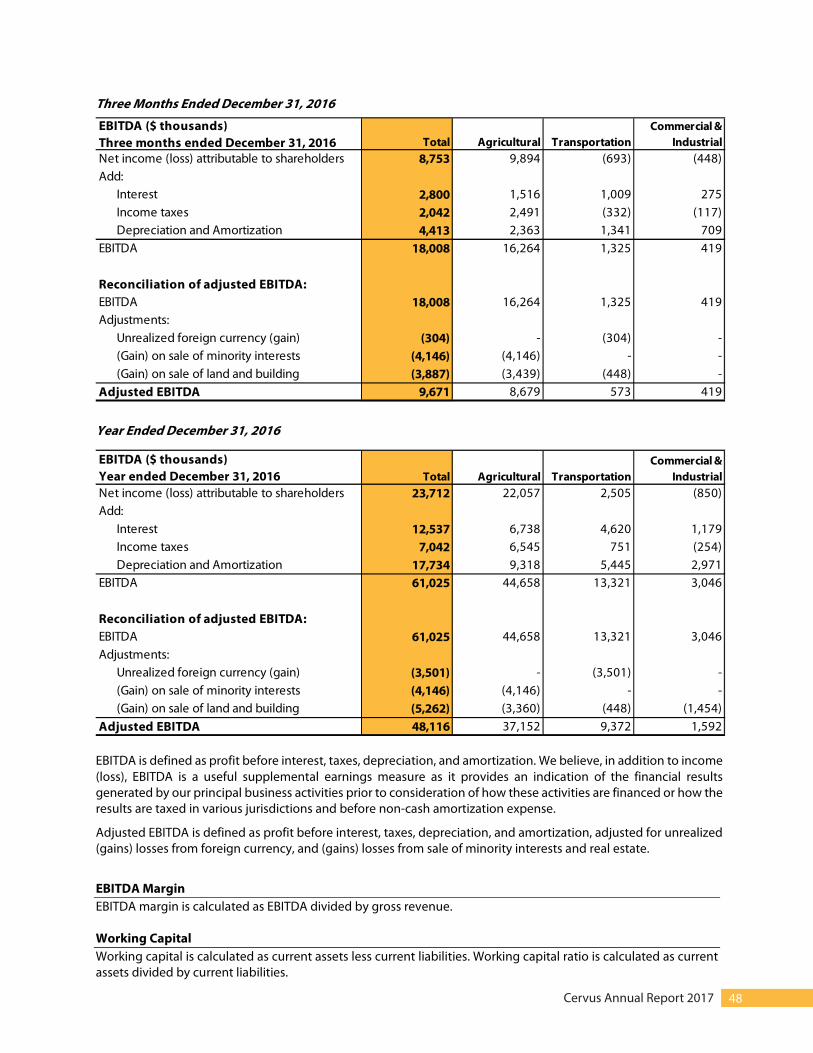
Cervus Annual Report 2017 48
Three Months Ended December 31, 2016
EBITDA ($ thousands)
Three months ended December 31, 2016 Total Agricultural Transportation
Commercial &
Industrial
Net income (loss) attributable to shareholders 8,753 9,894 (693) (448)
Add:
Interest 2,800 1,516 1,009 275
Income taxes 2,042 2,491 (332) (117)
Depreciation and Amortization 4,413 2,363 1,341 709
EBITDA 18,008 16,264 1,325 419
Reconciliation of adjusted EBITDA:
EBITDA 18,008 16,264 1,325 419
Adjustments:
Unrealized foreign currency (gain) (304) - (304) -
(Gain) on sale of minority interests (4,146) (4,146) - -
(Gain) on sale of land and building (3,887) (3,439) (448) -
Adjusted EBITDA 9,671 8,679 573 419
Year Ended December 31, 2016
EBITDA ($ thousands)
Year ended December 31, 2016 Total Agricultural Transportation
Commercial &
Industrial
Net income (loss) attributable to shareholders 23,712 22,057 2,505 (850)
Add:
Interest 12,537 6,738 4,620 1,179
Income taxes 7,042 6,545 751 (254)
Depreciation and Amortization 17,734 9,318 5,445 2,971
EBITDA 61,025 44,658 13,321 3,046
Reconciliation of adjusted EBITDA:
EBITDA 61,025 44,658 13,321 3,046
Adjustments:
Unrealized foreign currency (gain) (3,501) - (3,501) -
(Gain) on sale of minority interests (4,146) (4,146) - -
(Gain) on sale of land and building (5,262) (3,360) (448) (1,454)
Adjusted EBITDA 48,116 37,152 9,372 1,592
EBITDA is defined as profit before interest, taxes, depreciation, and amortization. We believe, in addition to income
(loss), EBITDA is a useful supplemental earnings measure as it provides an indication of the financial results
generated by our principal business activities prior to consideration of how these activities are financed or how the
results are taxed in various jurisdictions and before non-cash amortization expense.
Adjusted EBITDA is defined as profit before interest, taxes, depreciation, and amortization, adjusted for unrealized
(gains) losses from foreign currency, and (gains) losses from sale of minority interests and real estate.
EBITDA Margin
EBITDA margin is calculated as EBITDA divided by gross revenue.
Working Capital
Working capital is calculated as current assets less current liabilities. Working capital ratio is calculated as current
assets divided by current liabilities.

Cervus Annual Report 2017 49
Consolidated Financial Statements of
CERVUS EQUIPMENT CORPORATION For the years ended December 31, 2017 and 2016

Cervus Annual Report 2017 50
KPMG LLP205 5th Avenue SWSuite 3100Calgary AB T2P 4B9Tel (403) 691-8000Fax (403) 691-8008www.kpmg.ca
KPMG LLP is a Canadian limited liability partnership and a member firm of the KPMG network of independent member firms affiliated with KPMG International Cooperative (“KPMG International”), a Swiss entity. KPMG Canada provides services to KPMG LLP.
INDEPENDENT AUDITORS’ REPORT
To the Shareholders of Cervus Equipment Corporation
We have audited the accompanying consolidated financial statements of Cervus Equipment Corporation, which comprise the consolidated statements of financial position as at December 31, 2017 and December 31, 2016, the consolidated statements of comprehensive income, changes in shareholders’ equity and cash flows for the years then ended, and notes, comprising a summary of significant accounting policies and other explanatory information.
Management’s Responsibility for the Consolidated Financial Statements
Management is responsible for the preparation and fair presentation of these consolidated financial statements in accordance with International Financial Reporting Standards, and for such internal control as management determines is necessary to enable the preparation of consolidated financial statements that are free from material misstatement, whether due to fraud or error.
Auditors’ Responsibility
Our responsibility is to express an opinion on these consolidated financial statements based on our audits. We conducted our audits in accordance with Canadian generally accepted auditing standards. Those standards require that we comply with ethical requirements and plan and perform the audit to obtain reasonable assurance about whether the consolidated financial statements are free from material misstatement.
An audit involves performing procedures to obtain audit evidence about the amounts and disclosures in the consolidated financial statements. The procedures selected depend on our judgment, including the assessment of the risks of material misstatement of the consolidated financial statements, whether due to fraud or error. In making those risk assessments, we consider internal control relevant to the entity’s preparation and fair presentation of the consolidated financial statements in order to design audit procedures that are appropriate in the circumstances, but not for the purpose of expressing an opinion on the effectiveness of the entity’s internal control. An audit also includes evaluating the appropriateness of accounting policies used and the reasonableness of accounting estimates made by management, as well as evaluating the overall presentation of the consolidated financial statements.

Cervus Annual Report 2017 512
We believe that the audit evidence we have obtained in our audits is sufficient and appropriate to provide a basis for our audit opinion.
Opinion
In our opinion, the consolidated financial statements present fairly, in all material respects, the consolidated financial position of Cervus Equipment Corporation. as at December 31, 2017 and December 31, 2016, and its consolidated financial performance and its consolidated cash flows for the years then ended in accordance with International Financial Reporting Standards.
Chartered Professional Accountants
March 13, 2018Calgary, Canada

Cervus Annual Report 2017 52The accompanying notes are an integral part of these consolidated financial statements.
CERVUS EQUIPMENT CORPORATION Consolidated Statements of Financial Position
As at December 31, 2017 and 2016
($ thousands)($ thousands)($ thousands)($ thousands) Note
AssetsCurrent assets
Cash and cash equivalents $ 14,502 $ 14,542
Trade and other accounts receivable 5 53,529 54,986
Inventories 6 290,524 255,231
Assets held for sale 7 26,280 -
Total current assets 384,835 324,759
Non-current assetsOther long-term assets 8 8,423 9,537
Property and equipment 9 62,175 75,498
Intangible assets 10 39,742 46,514
Goodwill 10 18,880 20,544
Total non-current assets 129,220 152,093
Total assets $ 514,055 $ 476,852
Trade and other liabilities 11 $ 87,317 $ 84,340
Floor plan payables 12 125,573 86,091
Current portion of term debt 12 11,122 15,720
Debenture payable 12 - 33,899
Liabilities directly associated with assets held for sale 7 12,250 -
236,262 220,050
Term debt 12 32,170 21,660
Finance lease obligation 13 10,416 10,695
Deferred income tax liability 14 9,954 10,608
52,540 42,963
288,802 263,013
Shareholders’ capital 16 88,163 89,863
Deferred share plan 19 7,455 7,520
Other reserves 5,195 5,195
Accumulated other comprehensive income 191 1,219
Retained earnings 124,249 108,731
Total equity attributable to equity holders of the Company 225,253 212,528
2 - 1,311
225,253 213,839
$ 514,055 $ 476,852 Total equity
Total liabilities and equity
Total non-current liabilities
Total liabilitiesEquity
Non-controlling interest
December 31,
2016
LiabilitiesCurrent liabilities
Total current liabilitiesNon-current liabilities
December 31,
2017
Approved by the Board: “Peter Lacey” Director “Angela Lekatsas” Director
CERVUS EQUIPMENT CORPORATION Consolidated Statements of Comprehensive Income For the years ended December 31, 2017 and 2016
($ thousands)($ thousands)($ thousands)($ thousands) Note 2017 2016Revenue
Equipment sales $ 911,781 $ 808,661Parts 208,863 200,953Service 84,464 79,973Rentals 16,177 20,352
Total revenue 1,221,285 1,109,939Cost of sales (1,011,857) (918,874)Gross pro t 209,428 191,065Other income 17 1,112 13,938Selling, general and administrative expense 18 (176,199) (164,431)Income from operating activities 34,341 40,572Net nance costs 20 (5,379) (10,495)Share of (loss) pro t of equity accounted investees, net of income tax
(4) 489
Income before income tax expense 28,958 30,566Income tax expense 14 (9,046) (7,042)Income for the year 19,912 23,524Other comprehensive income:
(1,028) (612)18,884 22,912
Income attributable to:Shareholders of the Company 19,917 23,712Non-controlling interest (5) (188)Income for the year 19,912 23,524
Shareholders of the Company 18,889 23,100Non-controlling interest (5) (188)
$ 18,884 $ 22,912
Basic 21 $ 1.27 $ 1.51Diluted 21 $ 1.20 $ 1.44
Net income per share attributable to shareholders of the Company:
Total comprehensive income attributable to:
Total comprehensive income for the year
Total comprehensive income for the yearForeign currency translation di erences for foreign operations, net of tax
The accompanying notes are an integral part of these consolidated nancial statements.

Cervus Annual Report 2017 53
CERVUS EQUIPMENT CORPORATION Consolidated Statements of Comprehensive Income For the years ended December 31, 2017 and 2016
($ thousands)($ thousands)($ thousands)($ thousands) Note 2017 2016Revenue
Equipment sales $ 911,781 $ 808,661Parts 208,863 200,953Service 84,464 79,973Rentals 16,177 20,352
Total revenue 1,221,285 1,109,939Cost of sales (1,011,857) (918,874)Gross pro t 209,428 191,065Other income 17 1,112 13,938Selling, general and administrative expense 18 (176,199) (164,431)Income from operating activities 34,341 40,572Net nance costs 20 (5,379) (10,495)Share of (loss) pro t of equity accounted investees, net of income tax
(4) 489
Income before income tax expense 28,958 30,566Income tax expense 14 (9,046) (7,042)Income for the year 19,912 23,524Other comprehensive income:
(1,028) (612)18,884 22,912
Income attributable to:Shareholders of the Company 19,917 23,712Non-controlling interest (5) (188)Income for the year 19,912 23,524
Shareholders of the Company 18,889 23,100Non-controlling interest (5) (188)
$ 18,884 $ 22,912
Basic 21 $ 1.27 $ 1.51Diluted 21 $ 1.20 $ 1.44
Net income per share attributable to shareholders of the Company:
Total comprehensive income attributable to:
Total comprehensive income for the year
Total comprehensive income for the yearForeign currency translation di erences for foreign operations, net of tax
The accompanying notes are an integral part of these consolidated nancial statements.

Cervus Annual Report 2017 54
CE
RV
US
EQ
UIP
ME
NT
CO
RP
OR
AT
ION
C
on
solid
ate
d S
tate
me
nts
of
Ch
ang
es
in E
qu
ity
Fo
r th
e Y
ea
rs E
nd
ed
De
cem
be
r 3
1, 2
01
7 a
nd
20
16
Att
rib
uta
ble
to
Eq
uit
y H
old
ers
of
the
Co
mp
an
y
($ t
ho
us
an
ds
)N
ote
Sh
are
cap
ita
l
De
ferr
ed
sha
re
pla
n
Oth
er
rese
rve
s
Cu
mu
lati
ve
tra
nsl
ati
on
acc
ou
nt
Re
tain
ed
ea
rnin
gs
To
tal
No
n-
con
tro
llin
g
inte
rest
To
tal
eq
uit
y
Ba
lan
ce D
ece
mb
er
31
, 20
15
$8
8,2
70
$7
,09
8$
5,1
82
$1
,83
1$
89
,41
3$
19
1,7
94
$1
,49
9$
19
3,2
93
Co
mp
reh
en
siv
e in
com
e f
or
the
ye
ar
Pro
fit
--
--
23
,71
22
3,7
12
(18
8)
23
,52
4
Oth
er
com
pre
he
nsi
ve
inco
me
Fore
ign
cu
rre
ncy
tra
nsl
atio
n a
dju
stm
en
ts, n
et
of t
a x-
--
(61
2)
-(6
12
)-
(61
2)
Tota
l co
mp
reh
en
sive
inco
me
for
the
ye
ar-
--
(61
2)
23
,71
22
3,1
00
(18
8)
22
,91
2
Tra
nsa
ctio
ns
wit
h o
wn
ers
, re
cord
ed
dir
ect
ly in
eq
uit
y
Div
ide
nd
s to
eq
uit
y h
old
ers
--
--
(4,3
94
)(4
,39
4)
-(4
,39
4)
Shar
es
issu
ed
th
rou
gh
DR
IP8
83
--
--
88
3-
88
3
Shar
es
issu
ed
th
rou
gh
de
ferr
ed
sh
are
pla
n7
10
(71
0)
--
--
--
Shar
e-b
ase
d p
aym
en
t tr
ansa
ctio
ns
-1
,13
21
3-
-1
,14
5-
1,1
45
Tran
sact
ion
s w
ith
ow
ne
rs1
,59
34
22
13
-(4
,39
4)
(2,3
66
)-
(2,3
66
)
Ba
lan
ce D
ece
mb
er
31
, 20
16
$8
9,8
63
$7
,52
0$
5,1
95
$1
,21
9$
10
8,7
31
$2
12
,52
8$
1,3
11
$2
13
,83
9
Co
mp
reh
en
siv
e in
com
e f
or
the
ye
ar
Pro
fit
--
--
19
,91
71
9,9
17
(5)
19
,91
2
Oth
er
com
pre
he
nsi
ve
inco
me
Fore
ign
cu
rre
ncy
tra
nsl
atio
n a
dju
stm
en
ts, n
et
of t
ax-
--
(1,0
28
)-
(1,0
28
)-
(1,0
28
)
Tota
l co
mp
reh
en
sive
inco
me
for
the
ye
ar-
--
(1,0
28
)1
9,9
17
18
,88
9(5
)1
8,8
84
Tra
nsa
ctio
ns
wit
h o
wn
ers
, re
cord
ed
dir
ect
ly in
eq
uit
y
Div
ide
nd
s to
eq
uit
y h
old
ers
16
--
--
(4,3
99
)(4
,39
9)
(1,3
06
)(5
,70
5)
Shar
es
issu
ed
th
rou
gh
DR
IP1
67
78
--
--
77
8-
77
8
Shar
es
issu
ed
th
rou
gh
de
ferr
ed
sh
are
pla
n1
67
57
(75
7)
--
--
--
Shar
e-b
ase
d p
aym
en
t tr
ansa
ctio
ns
19
-6
92
--
-6
92
-6
92
Co
mm
on
sh
are
s re
pu
rch
ase
d
16
(3,2
35
)-
--
-(3
,23
5)
-(3
,23
5)
Tran
sact
ion
s w
ith
ow
ne
rs(1
,70
0)
(65
)-
-(4
,39
9)
(6,1
64
)(1
,30
6)
(7,4
70
)
Ba
lan
ce D
ece
mb
er
31
, 20
17
$8
8,1
63
$7
,45
5$
5,1
95
$1
91
$1
24
,24
9$
22
5,2
53
$-
$2
25
,25
3
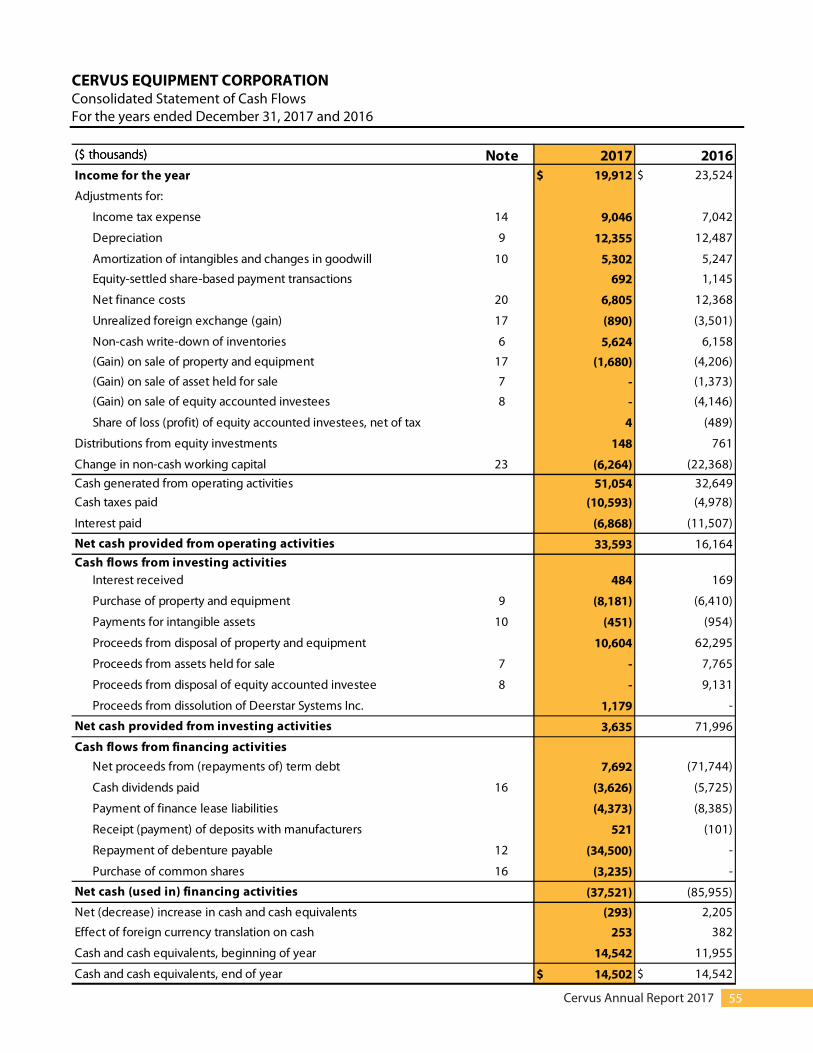
Cervus Annual Report 2017 55
CERVUS EQUIPMENT CORPORATION Consolidated Statement of Cash Flows
For the years ended December 31, 2017 and 2016
($ thousands)($ thousands)($ thousands)($ thousands) Note 2017 2016
Income for the year $ 19,912 $ 23,524
Adjustments for:
Income tax expense 14 9,046 7,042
Depreciation 9 12,355 12,487
Amortization of intangibles and changes in goodwill 10 5,302 5,247
Equity-settled share-based payment transactions 692 1,145
Net finance costs 20 6,805 12,368
Unrealized foreign exchange (gain) 17 (890) (3,501)
Non-cash write-down of inventories 6 5,624 6,158
(Gain) on sale of property and equipment 17 (1,680) (4,206)
(Gain) on sale of asset held for sale 7 - (1,373)
(Gain) on sale of equity accounted investees 8 - (4,146)
Share of loss (profit) of equity accounted investees, net of tax 4 (489)
Distributions from equity investments 148 761
Change in non-cash working capital 23 (6,264) (22,368)
Cash generated from operating activities 51,054 32,649
Cash taxes paid (10,593) (4,978)
Interest paid (6,868) (11,507)
33,593 16,164
Cash flows from investing activities
Interest received 484 169
Purchase of property and equipment 9 (8,181) (6,410)
Payments for intangible assets 10 (451) (954)
Proceeds from disposal of property and equipment 10,604 62,295
Proceeds from assets held for sale 7 - 7,765
Proceeds from disposal of equity accounted investee 8 - 9,131
Proceeds from dissolution of Deerstar Systems Inc. 1,179 -
3,635 71,996
Cash flows from financing activities
Net proceeds from (repayments of) term debt 7,692 (71,744)
Cash dividends paid 16 (3,626) (5,725)
Payment of finance lease liabilities (4,373) (8,385)
Receipt (payment) of deposits with manufacturers 521 (101)
Repayment of debenture payable 12 (34,500) -
Purchase of common shares 16 (3,235) -
(37,521) (85,955)
(293) 2,205
Effect of foreign currency translation on cash 253 382
Cash and cash equivalents, beginning of year 14,542 11,955
Cash and cash equivalents, end of year $ 14,502 $ 14,542
Net cash provided from operating activities
Net (decrease) increase in cash and cash equivalents
Net cash provided from investing activities
Net cash (used in) financing activities
Cervus Annual Report 2017 56
CERVUS EQUIPMENT CORPORATION Notes to the Consolidated Financial Statements
For the years ended December 31, 2017 and 2016
1. Reporting Entity
Cervus Equipment Corporation (“Cervus” or the “Company”) is an incorporated entity under the Canada Business
Corporations Act and is domiciled in Canada. The registered office of the Company is situated at 5201 – 333, 96th
Avenue N.E., Calgary, Alberta, Canada, T3K 0S3. The consolidated financial statements of the Company as at and for
the year ended December 31, 2017 comprise the Company and its subsidiaries (“the Group”). The Company is
primarily involved in the sale, after-sale service and maintenance of agricultural, transportation, construction and
industrial equipment. The Company also provides equipment rental, primarily in the transportation, construction and
industrial equipment segments. The Company wholly owns and operates 64 dealerships in Canada, New Zealand, and
Australia. The primary equipment brands represented by Cervus include John Deere agricultural equipment; Peterbilt
transportation equipment; Bobcat and JCB construction equipment; and Clark, Sellick and Doosan material handling
equipment. The common shares of Cervus are listed on the Toronto Stock Exchange and trade under the symbol
"CERV".
2. Basis of Preparation
Statement of Compliance
The consolidated financial statements have been prepared in accordance with International Financial Reporting
Standards (“IFRSs”) as issued by the International Accounting Standards Board (“IASB”).
The Board of Directors authorized the issue of these consolidated financial statements on March 13, 2018.
Basis of Measurement
The consolidated financial statements have been prepared under a going concern assumption on a historical cost
basis, with the exception of items that IFRS requires to be measured at fair value.
Presentation Currency
These consolidated financial statements are presented in Canadian dollars. All financial information has been
rounded to the nearest thousand except for per share amounts.
Basis of Consolidation
These consolidated financial statements include the accounts of the parent company Cervus Equipment Corporation
and its subsidiaries, all of which are wholly owned.
Control is achieved where the Company has the power to govern the financial and operating policies of an entity so
as to obtain benefits from its activities. The results of subsidiaries acquired or disposed of during the year are included
in the consolidated statements of comprehensive income from the effective date of acquisition and up to the effective
date of disposal, as appropriate. Non-controlling interests in subsidiaries are identified separately from the Company’s
equity therein. The interests of non-controlling shareholders may be initially measured either at fair value or at the
non-controlling interests’ proportionate share of the fair value of the acquirees’ identifiable net assets. The choice of
measurement basis is made on an acquisition-by-acquisition basis. Subsequent to acquisition, the carrying amount
of non-controlling interests is the amount of those interests at initial recognition plus the non-controlling interests’
share of subsequent changes in equity. Total comprehensive income is attributed to non-controlling interests even
if this results in the non-controlling interests having a deficit balance.

Cervus Annual Report 2017 57
CERVUS EQUIPMENT CORPORATION Notes to the Consolidated Financial Statements
For the years ended December 31, 2017 and 2016
2. Basis of Preparation (continued)
Details of the Company’s subsidiaries at December 31, 2017 and December 31, 2016 are as follows:
Proportion of Ownership Interest and Voting Power Held 2017 2016
Cervus AG Equipment LP 100% 100%
Cervus AG Equipment Ltd 100% 100%
Evergreen Equipment Ltd. 100% 100%
Cervus Collision Center LP 100% 100%
Cervus Contractors Equipment LP 100% 100%
Cervus Contractors Equipment Ltd 100% 100%
Cervus Equipment NZ Ltd. 100% 100%
DeerStar Systems Inc. (a) - 57.1%
101169185 Saskatchewan Ltd 100% 100%
520781 Alberta Ltd 100% 100%
Cervus Equipment Holdings Australia Pty Ltd. 100% 100%
100% 100%Cervus Equipment Australia Pty Ltd.
(a) During June 2017, Deerstar Systems Inc. was dissolved. As part of the dissolution Cervus received its pro-rata
share of net assets. Upon the dissolution of Deerstar System Inc., Cervus no longer has a non-controlling interest
balance.
Use of Judgements and Estimates
In preparing these consolidated financial statements, management has made judgements, estimates and
assumptions that affect the application of the Company’s accounting policies and the reported amounts of assets,
liabilities, revenues and expenses. By their very nature, estimates may differ from actual future results and the impact
of such changes could be material.
Estimates and underlying assumptions are reviewed on an ongoing basis, with revisions to accounting estimates
recognized prospectively.
Judgements
Information about judgements made in applying accounting policies that have the most significant effects on the
amounts recognized in these consolidated financial statements are:
Classification of a lease arrangement as an operating or finance lease; judgement is required to determine
whether substantially all of the significant risks and rewards of ownership are transferred to the customer or
remain with the Company; or where the Company is the lessee, whether substantially all the significant risks
and rewards of ownership are transferred to the Company or remain with the lessor. (Note 13 & 22)
Impairment tests; judgement is used in identifying impairment triggers and the cash generating unit or
group of cash generating units at which goodwill, intangible assets, and property and equipment are
monitored for internal management purposes and identifying an appropriate discount rate for these
calculations. (Note 10)
Assumptions and Estimation Uncertainties
Information about assumptions and estimation uncertainties which could have a significant effect on the carrying
amounts of assets and liabilities within the next fiscal year are included in the following notes:
Recoverability of inventories and key assumptions regarding the net realizable value of inventory. (Note 6)
Impairment tests (including intangible assets and goodwill); estimates on key assumptions related to the
future operating results and cash generating ability of the assets. (Note 10)

Cervus Annual Report 2017 58
CERVUS EQUIPMENT CORPORATION Notes to the Consolidated Financial Statements
For the years ended December 31, 2017 and 2016
2. Basis of Preparation (continued)
Depreciation and amortization expense; assumptions on the useful lives of property and equipment and
intangible assets. (Note 9 and 10)
Determination of Fair Values
A number of the group’s accounting policies and disclosures require the determination of fair value, for both
financial and non-financial assets and liabilities. Fair values have been determined for measurement and/or
disclosure purposes based on the methods outlined below. When applicable, further information about the
assumptions made in determining fair values is disclosed in the notes specific to that asset or liability.
Property, Plant and Equipment
The fair value of property, plant and equipment recognized as a result of a business combination or when
determined in an impairment test is the estimated amount for which a property could be exchanged on the
measurement date between a willing buyer and a willing seller in an arm’s length transaction after proper marketing
wherein the parties had each acted knowledgeably. The fair value of items of plant, equipment, fixtures and fittings
is based on the market approach and cost approaches using quoted market prices for similar items when available
and depreciated replacement cost when appropriate. Depreciated replacement cost reflects adjustments for
physical deterioration as well as functional and economic obsolescence.
Intangible Assets
The fair value of dealership distribution agreements and trade names acquired in a business combination is based
on the incremental discounted estimated cash flows realized post acquisition, or expenditures avoided, as a result
of owning the intangible assets. The fair value of customer lists acquired in a business combination is determined
using income based approaches, whereby the subject asset is valued after deducting a fair return on all other assets
that are part of creating the related cash flows. The fair value of other intangible assets including non-competition
agreements is based on the discounted cash flows expected to be derived from the use and any residual value of
the assets.
Inventories
The fair value of inventories acquired in a business combination is determined based on the estimated selling price
in the ordinary course of business less the estimated costs of completion and sale, and a reasonable profit margin
based on the effort required to complete and sell the inventories.
Trade and Other Receivables
The fair value of trade and other receivables is estimated at the present value of the future cash flows, discounted at
the market rate of interest at the reporting date. The fair value is determined for disclosure purposes or when such
assets are acquired in a business combination.
Other Non-Derivative Financial Liabilities
Fair value, which is determined for disclosure purposes, is calculated based on the present value of future principal
and interest cash flows, discounted at the market rate of interest at the reporting date.
Derivative Financial Instruments
The fair value of foreign currency derivative financial instruments is calculated based on a market comparison
technique. The fair value is based on similar contracts in an active market and based on quotes using the prevailing
foreign exchange translation rate from the Bank of Canada or similar sources.

Cervus Annual Report 2017 59
CERVUS EQUIPMENT CORPORATION Notes to the Consolidated Financial Statements
For the years ended December 31, 2017 and 2016
3. Significant Accounting Policies
The accounting policies set out below have been applied consistently by all the Group’s entities and to all years
presented in these consolidated financial statements.
Business Segments
The Company operates three distinct business segments, Agricultural, Transportation and Commercial and Industrial
segments based on the industry which they serve. These segments are managed separately and strategic decisions
are made on the basis of their respective operating results.
The Agricultural equipment segment consists of John Deere dealership locations in Alberta, Saskatchewan, British
Columbia, New Zealand, and Australia. The Transportation equipment segment consists of Peterbilt dealership
locations in Saskatchewan and Ontario. The Commercial and Industrial equipment segment consists of Bobcat, JCB,
Clark, Sellick, and Doosan dealership locations in Alberta, Saskatchewan, and Manitoba.
Each of these business segment operations are supported by a single corporate head office. Certain corporate head
office expenses are allocated to the business segments according to both specific identification and metrics to
estimate usage. The corporate head office also incurs certain costs which are not considered directly related to store
level operations, such as interest cost on general corporate borrowings, corporate personnel costs, and public
company costs. These corporate costs are allocated to the segments based on the gross profit of the segments.
Business Combinations
Acquisitions of subsidiaries are accounted for using the acquisition method. The cost of the acquisition is measured
at the aggregate of the fair values, at the date of exchange, of assets given, liabilities and contingent liabilities incurred
or assumed, and equity instruments issued by the Company in exchange for control of the acquiree. Transaction costs
are expensed as incurred. Goodwill arising on acquisitions is recognized as an asset and initially measured at cost,
being the excess of the consideration of the business combination over the Company's interest in the net fair value
of the identifiable assets, liabilities and contingent liabilities recognized.
Foreign Currency Translation
Foreign Currency Transactions
The individual financial statements of each subsidiary are stated in the currency of the primary economic environment
in which it operates (its functional currency). Transactions in currencies other than companies’ functional currency
are recorded at the rate of exchange at the date of the transaction. At the balance sheet date, monetary assets and
liabilities denominated in a currency other than subsidiaries’ functional currency, are translated into the subsidiaries’
functional currency at the rates of exchange prevailing at that date. Foreign currency differences are recognized in
profit or loss.
Foreign Operations
For the purpose of presenting consolidated financial statements, the results of entities denominated in currencies
other than Canadian dollars are translated at the average rate of exchange for the period and their assets and liabilities
at the rates in effect at the balance sheet date. Foreign exchange differences are recognized in other comprehensive
income and accumulated in the cumulative translation account.

Cervus Annual Report 2017 60
CERVUS EQUIPMENT CORPORATION Notes to the Consolidated Financial Statements
For the years ended December 31, 2017 and 2016
3. Significant Accounting Policies (continued)
Cash and Cash Equivalents
Cash and cash equivalents include cash on hand, balances with banks, and short-term deposits with original
maturities of three months or less.
Inventories
Inventories are stated at the lower of cost and net realizable value. Cost is determined using the specific identification
method for new and used equipment, average cost for parts and a specific job basis for work-in-progress. Net
realizable value approximates the estimated selling price less all estimated cost of completion and necessary cost to
complete the sale. Previous write-downs of inventory are reversed when economic changes support an increased
value. Where a previous write-down is reversed, the reversal is limited to the amount of the original write-down, so
that the new carrying amount is the lower of the cost and the revised net realizable value.
Property and Equipment
Items of property and equipment are recorded at cost, less any accumulated depreciation and accumulated
impairment losses. Properties under construction are measured at cost less any accumulated impairment. Assets are
moved from the construction phase and begin depreciation when the asset is available for use. Assets under finance
leases are measured initially at an amount equal to the lower of their fair value and the present value of minimum
lease payments.
Any gain or loss arising on the disposal or retirement of an item of property and equipment is recognized in profit or
loss.
Depreciation is provided for using both the declining balance and straight-line methods at annual rates intended to
depreciate the cost of each significant component of an asset, less its residual values over its estimated useful lives.
Assets under finance leases are depreciated on the same basis as owned assets, or where shorter, the term of the lease.
Land is not depreciated.
The estimated useful lives, residual values and depreciation methods are reviewed at each reporting period, with the
effect of any changes in estimate accounted for on a prospective basis.
The following methods and rates are used in the calculation of depreciation:
Assets Method
Estimated
Useful Life
Buildings Straight-line 15 to 40 years
Leasehold improvements Straight-line Over period of lease
Short-term rental equipment Straight-line 5 to 10 years
Automotive and trucks and computers Declining balance 30%
Furniture and fixtures, parts and shop equipment Declining balance 20%
Cervus Annual Report 2017 61
CERVUS EQUIPMENT CORPORATION Notes to the Consolidated Financial Statements
For the years ended December 31, 2017 and 2016
3. Significant Accounting Policies (continued)
Intangible Assets
Intangible Assets
Intangible assets include software, dealership distribution agreements, customer lists and non-competition
agreements and are recorded at cost less accumulated amortization and any accumulated impairment losses.
Software costs under development are measured at cost less any accumulated impairment, software moves from the
development phase and amortization commences when the asset is available for use.
Costs of internally generated intangible assets are capitalized only if the expenditure can be measured reliably, the
product or process is technically and commercially feasible, future economic benefits are probable and the Company
intends to complete development to use the asset. Otherwise, it is recognized in profit or loss as incurred.
The estimated useful life and amortization method are reviewed at the end of each period, with the effect of any
changes in estimate being accounted for on a prospective basis.
The following are the typical useful lives that are used in the calculation of amortization for each intangible asset.
Dealership distribution agreements 20 years
Customer lists and non-competition agreements 5 years
Software costs 5 years
Goodwill
Goodwill is the excess of the consideration of a business combination over the Company's interest in the net fair value
of the identifiable assets, liabilities and contingent liabilities recognized. Goodwill is measured at cost less
accumulated impairment.
Investments in Associates
An associate is an entity over which the Company has significant influence and that is neither a subsidiary nor an
interest in a joint venture. Significant influence is the power to participate in the financial and operating policy
decisions of the investee but is not control or joint control over those policies.
The results and assets and liabilities of associates are incorporated in these financial statements using the equity
method of accounting. Under the equity method, investments in associates are carried in the consolidated
statements of financial position at cost as adjusted for post-acquisition changes in the Company’s share of the net
assets of the associate, less any impairment in the value of individual investments. Losses of an associate in excess of
the Company’s interest in that associate (which includes any long-term interests that, in substance, form part of the
Company’s net investment in the associate) are recognized only to the extent that the Company has incurred legal or
constructive obligations or made payments on behalf of the associate.
Any excess of the cost of acquisition over the Company’s share of the net fair value of the identifiable assets, liabilities
and contingent liabilities of the associate recognized at the date of acquisition is recognized as goodwill. The goodwill
is included within the carrying amount of the investment and is assessed for impairment as part of that investment.
Any excess of the Company’s share of the net fair value of the identifiable assets, liabilities and contingent liabilities
over the cost of acquisition, after reassessment, is recognized immediately in profit or loss.
When the Company transacts with an associate of the Company, profit and losses are eliminated to the extent of the
Company’s interest on the relevant associate.
Cervus Annual Report 2017 62
CERVUS EQUIPMENT CORPORATION Notes to the Consolidated Financial Statements
For the years ended December 31, 2017 and 2016
3. Significant Accounting Policies (continued)
Assets Held for Sale
Non-current assets, or disposal groups comprising assets and liabilities, are classified as held for sale when it is highly
probable that an asset or disposal group in its present condition will be recovered principally through sale instead of
its continued use. Assets held for sale are measured at the lower of the carrying amount and fair value less costs to
sell. Once classified as held-for-sale, plant and equipment are no longer depreciated.
Lease Arrangements
At the inception of an arrangement, the Company considers whether the arrangement, is or contains, a lease. The
Company must determine whether the fulfilment of the arrangement is dependent on the use of a specific asset and
if the arrangement conveys the right to use the asset. Where it is determined that the arrangement contains a lease,
the Company classifies the lease as either an operating or finance lease dependent on whether substantially all of the
risks or rewards of ownership of the asset have been transferred.
a) The Company as the Lessee
Payments made under operating leases are recognized in profit or loss on a straight-line basis over the term of the
lease. Lease incentives received are recognized as an integral part of the total lease expense, over the term of the
lease.
At the inception of a finance lease, the asset and finance lease liability is recorded at the lower of its fair value and the
present value of minimum lease payments. Minimum lease payments made under finance leases are apportioned
between the finance expense and the reduction of the outstanding liability. The finance expense is allocated to each
period during the lease term so as to produce a constant periodic rate of interest on the remaining balance of the
liability.
b) The Company as the Lessor
An operating lease effectively establishes that the lessor shall retain the rewards and associated risks of ownership of
that asset for a period of time or use. Where the Company’s equipment rentals and leases to customers are classified
as operating leases, the payments received are included in revenue on a straight-line basis over the term of the lease.
Revenue related to lease arrangements accounted for as finance leases are recognized using an approach for a
constant rate of return on the net investment in the lease. The net investment in the finance lease is the aggregate of
net minimum lease payments and unearned finance income discounted at the interest rate implicit in the lease.
Unearned finance income is deferred and recognized in net income over the lease term.

Cervus Annual Report 2017 63
CERVUS EQUIPMENT CORPORATION Notes to the Consolidated Financial Statements
For the years ended December 31, 2017 and 2016
3. Significant Accounting Policies (continued)
Impairment
Financial Assets (Including Receivables)
A financial asset not carried at fair value through profit or loss is assessed at each reporting date to determine whether
there is objective evidence that it is impaired. A financial asset is impaired if objective evidence indicates that a loss
event has occurred after the initial recognition of the asset, and that the loss event had a negative effect on the
estimated future cash flows of that asset that can be estimated reliably.
Objective evidence that financial assets (including equity securities) are impaired can include default or delinquency
by a debtor, restructuring of an amount due to the Company on terms that the Company would not consider
otherwise, indications that a debtor or issuer will enter bankruptcy, or the disappearance of an active market for a
security. In addition, for an investment in an equity security, a significant or prolonged decline in its fair value below
its cost is objective evidence of impairment.
The Company considers evidence of impairment for receivables and held-to-maturity investment securities at both a
specific asset and collective level. All individually significant receivables and held-to-maturity investment securities
found not to be specifically impaired are then collectively assessed for any impairment that has been incurred but not
yet identified. Receivables and held-to-maturity investment securities that are not individually significant are
collectively assessed for impairment by grouping together receivables and held-to-maturity investment securities
with similar risk characteristics.
In assessing collective impairment the Company uses historical trends of the probability of default, timing of
recoveries and the amount of loss incurred, adjusted for management’s judgement as to whether current economic
and credit conditions are such that the actual losses are likely to be greater or less than suggested by historical trends.
An impairment loss in respect of a financial asset measured at amortized cost is calculated as the difference between
its carrying amount and the present value of the estimated future cash flows discounted at the asset’s original
effective interest rate. Losses are recognized in profit or loss and reflected in an allowance account against receivables.
Interest on the impaired asset continues to be recognized through the unwinding of the discount. When a subsequent
event causes the amount of impairment loss to decrease, the decrease in impairment loss is reversed through profit
or loss.

Cervus Annual Report 2017 64
CERVUS EQUIPMENT CORPORATION Notes to the Consolidated Financial Statements
For the years ended December 31, 2017 and 2016
3. Significant Accounting Policies (continued)
Non-Financial Assets
Property and equipment, intangible assets and goodwill are reviewed at each reporting period to identify if there are
indicators of impairment. If any such indication exists, then the asset’s recoverable amount is estimated. The carrying
values of intangible assets and goodwill with indefinite lives must be tested at least annually. We have selected
December 31st as our annual impairment test date, although impairment tests are conducted more frequently if
indicators of impairment are present at dates other than December 31st.
When it is not possible to estimate the recoverable amount of an individual asset, the Company estimates the
recoverable amount of the cash-generating unit (CGU) to which the asset belongs. The CGU corresponds to the
smallest identifiable group of assets whose continuing use generates cash inflows that are largely independent of the
cash inflows from other assets or groups of assets. The Company has determined that its CGUs comprise groups of
stores which provide the same or similar product within a geographic market.
Goodwill acquired in a business combination is allocated to the CGU which it relates. Intangible assets with indefinite
useful lives and assets held at the parent level are allocated to the CGU to which they relate.
Impairment losses are recognized in profit or loss. Any impairment loss is allocated first to reduce the carrying amount
of any goodwill allocated to the CGU and then to the other assets of the CGU pro rata based on the carrying amount
of each asset in the CGU. An impairment loss is recognized when the carrying amount of an asset, or of the CGU to
which it belongs, exceeds the recoverable amount. The recoverable amount of an asset or cash-generating unit is the
greater of its value in use and its fair value less costs to sell. In assessing value in use, the estimated future cash flows
are discounted to their present value using a pre-tax discount rate that reflects current market assessments of the
time value of money and the risks specific to the asset.
Reversals of Previously Recognized Impairments
An impairment loss in respect of goodwill is not reversed. In respect of other assets, impairment losses recognized in
prior periods are assessed at each reporting date for any indications that the loss has decreased or no longer exists.
An impairment loss is reversed if there has been a change in the estimates used to determine the recoverable amount.
An impairment loss is reversed only to the extent that the asset’s carrying amount does not exceed the carrying
amount that would have been determined, net of depreciation or amortization, if no impairment loss had been
recognized.

Cervus Annual Report 2017 65
CERVUS EQUIPMENT CORPORATION Notes to the Consolidated Financial Statements
For the years ended December 31, 2017 and 2016
3. Significant Accounting Policies (continued)
Income Tax
Income tax expense represents the sum of the tax currently payable and deferred tax. Current income taxes are
recorded based on the estimated income taxes payable on taxable income for the year and any adjustment to tax
payable in respect of previous years. The Company’s liability for current tax is calculated using tax rates that have
been substantively enacted by the end of the reporting period.
Deferred tax is recognized in respect of temporary differences between the carrying amounts of assets and liabilities
for financial reporting purposes and the amounts used for taxation purposes. Deferred tax is measured at the tax rates
that are expected to be applied to temporary differences when they reverse, based on the laws that have been
enacted or substantively enacted by the reporting date. A deferred tax asset is recognized if it is more likely than not
to be realized. The effect of a change in tax rates on deferred income tax assets and liabilities is recorded in the period
in which the change occurs.
Provisions
Provisions are recognized when the Company has a present obligation (legal or constructive) as a result of a past
event, it is probable that the Company will be required to settle the obligation, and a reliable estimate can be made
of the amount of the obligation. The amount recognized as a provision is the best estimate of the consideration
required to settle the present obligation at the end of the reporting period, taking into account the risks and
uncertainties surrounding the obligation. Where a provision is measured using the cash flows estimated to settle the
present obligation, its carrying amount is the present value of those cash flows.
When some or all of the economic benefits required to settle a provision are expected to be recovered from a third
party, a receivable is recognized as an asset if it is virtually certain that reimbursement will be received and measured
reliably.
Financial Instruments
A financial instrument is any contract that gives rise to a financial asset of one entity and a financial liability or equity
instrument to another entity. Financial assets and financial liabilities, including derivatives, are recognized on the
consolidated statement of financial position at the time the Company becomes a party to the contractual provisions.
Upon initial recognition, financial instruments are measured at fair value and for the purpose of subsequent
measurement; they are allocated into one of the following five categories: held-for-trading, held-to-maturity, loans
and receivables, available-for-sale or other financial liabilities. Derivative instruments are categorized as held for
trading unless they are designated as hedges. The Company’s financial assets and liabilities consist primarily of cash
and cash equivalents, trade and other accounts receivable, trade and other accrued liabilities, dividends payable, floor
plan payables, foreign currency hedging instruments, finance leases, and term debt and notes payable. The
designated financial instruments are recognized and measured as follows:
• Financial assets at fair value through profit or loss, or held-for-trading instruments, are financial assets and
liabilities typically acquired with the intention of generating revenues in the short-term. Financial assets and
financial liabilities required to be classified or designated as held for-trading are measured at fair value, with
gains and losses recorded in profit or loss for the period in which the change occurs. Upon initial recognition,
attributable transaction costs are recognized in profit or loss as incurred.
• Held-to-maturity financial assets are initially recognized at fair value plus any directly attributable transaction
costs. Subsequent to initial recognition, they are measured at amortized cost.

Cervus Annual Report 2017 66
CERVUS EQUIPMENT CORPORATION Notes to the Consolidated Financial Statements
For the years ended December 31, 2017 and 2016
3. Significant Accounting Policies (continued)
• Loans and receivables are measured at amortized cost using the effective interest method. Loans and
receivables include trade and other accounts receivable, and deposits with manufacturers.
• Available-for-sale financial assets are non-derivative assets that are designated as available-for sale or that are
not classified as loans and receivables, held-to-maturity investments or held for-trading. Available-for-sale
financial assets are initially recognized at fair value plus any directly attributable transaction costs, and are
carried at fair value with unrealized gains and losses included in other comprehensive income (OCI) until such
gains or losses are realized or an other than temporary impairment is determined to have occurred. Available-
for-sale assets are measured at fair value, except for assets that do not have a readily determinable fair value
which are recorded at cost and assessed for impairment when indicators for impairment exist.
• Other financial liabilities are measured at amortized cost using the effective interest method. The Company’s
other financial liabilities include trade and other accrued liabilities, dividends payable, floor plan payables,
term debt, finance lease obligation and notes payable.
Derivative financial instruments are used to manage aspects of the Company’s foreign currency exposure, primarily
utilizing forward currency contracts to lock the cost of certain customer orders where the customer has agreed to a
price in Canadian dollars, and the Company will be invoiced in U.S Dollars. Derivatives are initially recognized at fair
value and any directly attributable transaction costs are recognized in profit or loss as incurred. Subsequent to initial
recognition derivatives are measured at fair value and changes therein are generally recognized in profit or loss.
Revenue Recognition
Revenue is recognized when it is probable that future economic benefits will flow to the Company, and the amount
of revenue can be reliably measured. Revenue is recorded based on the fair value of the consideration received or
receivable. Revenue is not recognized before there is persuasive evidence that an arrangement exists, such as:
delivery has occurred, the rate is fixed and determinable, and the collection of outstanding amounts is considered
probable. The Company considers persuasive evidence to exist when a formal contract or purchase order is signed
and required deposits have been received. Sales terms do not include provision for post service obligations.
Parts revenue is recognized when the customer receives the part. Service revenue is recognized at the time the service
is provided. Rentals and operating lease revenue are recorded at the time the service is provided, recognized evenly
over the term of the rental or lease agreement with the customer.
Finance Income and Finance Costs
Finance income comprises interest income on funds invested.
Finance costs comprise interest expense on borrowings and impairment losses recognized on financial assets.
Borrowing costs that are not directly attributable to the construction, acquisition or production of a qualifying asset
are recognized in profit or loss as incurred.
Changes in the fair value of financial assets at fair value through profit or loss are included in Other Income or Loss.
Cervus Annual Report 2017 67
CERVUS EQUIPMENT CORPORATION Notes to the Consolidated Financial Statements
For the years ended December 31, 2017 and 2016
3. Significant Accounting Policies (continued)
Per Share Amounts
Basic per share amounts are computed by dividing earnings (loss) by the weighted average number of shares
outstanding for the period. Diluted earnings per share are calculated giving effect to the potential dilution that would
occur if share options or other dilutive instruments were exercised or converted to shares. The treasury stock method
is used to determine the dilutive effect of share options and other similar dilutive instruments. This method assumes
that any proceeds upon the exercise or conversion of dilutive instruments, for which market prices exceed exercise
price, would be used to purchase shares at the average market price of the shares during the period. Diluted earnings
per share may include the number of shares that were issuable on conversion of the debentures, if determined to be
dilutive. The net earnings are adjusted for the after-tax interest expense that would not have been incurred had the
debentures been converted at the beginning of the period.
Short-Term Employee Benefits
Short-term employee benefit obligations are measured on an undiscounted basis and are expensed as the related
service is provided. A liability is recognized for the amount expected to be paid under short-term cash bonus or profit
sharing plans if the Company has a present legal or constructive obligation to pay this amount as a result of past
service provided by the employee, and the obligation can be estimated reliably.
Share-Based Payment Transactions
The grant date fair value as determined by the Black-Scholes model for share option awards granted to employees is
recognized as an employee expense, with a corresponding increase in equity, over the period that the employees
unconditionally become entitled to the awards. The amount recognized as an expense is adjusted to reflect the
number of awards for which the related service and non-market vesting conditions are expected to be met, such that
the amount ultimately recognized as an expense is based on the number of awards that do meet the related service
and non-market performance conditions at the vesting date. Amounts for share option payment transactions are
recognized in contributed surplus as they vest, which is captured in other reserves.
Cervus Annual Report 2017 68
CERVUS EQUIPMENT CORPORATION Notes to the Consolidated Financial Statements
For the years ended December 31, 2017 and 2016
4. Standards Issued But Not Yet Effective
Certain new or amended standards or interpretations have been issued by the IASB or IFRIC that are required to be
adopted in the future periods. The new standards and amendments to existing standards which have not been applied
in preparing these consolidated financial statements are:
Revised
Standard
Description Impact of Application Effective Date
IFRS 15 –
Revenue from
Contracts
with
Customers
Effective January 1, 2018, the
Company will be required to adopt
IFRS 15 related to revenue from
contracts with customers. Revenue
from Contracts with Customers, was
issued in May 2014 and replaces IAS
11 Construction Contracts, IAS 18
Revenue, IFRIC 13 Customer Loyalty
Programs, IFRIC 15 Agreements for
the Construction of Real Estate, IFRIC
18 Transfers of Assets from Customers
and SIC-31 Revenue --- Barter
Transactions Involving Advertising
Services.
The Company has completed an
assessment to determine the
potential impact on its consolidated
financial statements. Based on the
analysis completed, the Company
concludes that there is no significant
impact on the amounts reported in
the financial statements.
Annual periods
beginning on or
after January 1,
2018
IFRS 9 –
Financial
Instruments
The IASB has released IFRS 9, related
to the accounting and presentation of
financial instruments and applies a
principal-based approach to the
classification and measurement of
financial assets and financial liabilities,
including an expected credit loss
model for calculating impairment,
and includes new requirements for
hedge accounting.
The Company intends to adopt IFRS
9 in its financial statements for the
annual period beginning on January
1, 2018. Based on the analysis
completed, the Company concludes
that there is no significant impact on
the amounts reported in the financial
statements.
Annual periods
beginning on or
after January 1,
2018
Cervus Annual Report 2017 69
CERVUS EQUIPMENT CORPORATION Notes to the Consolidated Financial Statements
For the years ended December 31, 2017 and 2016
4. Standards Issued But Not Yet Effective (continued)
Revised
Standard
Description Impact of Application Effective Date
IFRS 16 -
Leases
On January 13, 2016 the IASB issued
IFRS 16 Leases. The new standard is
effective for annual periods beginning
on or after January 1, 2019. Earlier
application is permitted for entities
that apply IFRS 15 Revenue from
Contracts with Customers at or before
the date of initial adoption of IFRS 16.
IFRS 16 will replace IAS 17 Leases.
The Company intends
to adopt IFRS 16 in its financial
statements for the annual period
beginning on January 1, 2019 and is
completing an assessment
documenting the potential impact
on its consolidated financial
statements. Under the application of
this standard, the operating lease
commitments are expected to be the
primary source of changes to the
consolidated statements of financial
position and the timing of expenses
in the consolidated statements of
comprehensive income.
Annual periods
beginning on or
after January 1,
2019.
5. Trade and Other Accounts Receivable
($ thousands)($ thousands)($ thousands)($ thousands) 2017 2016
Trade receivables $ 41,454 $ 48,282
Allowance for doubtful debts(a)(1,579) (1,710)
Trade receivables, net 39,875 46,572
Prepaid expenses 12,959 7,398
Other receivables 695 1,016
Total trade and other accounts receivable $ 53,529 $ 54,986
(a) Changes in allowance for doubtful debts during the year has been recorded in selling, general and administrative
expense, the details of which are disclosed in Note 24.
Cervus Annual Report 2017 70
CERVUS EQUIPMENT CORPORATION Notes to the Consolidated Financial Statements
For the years ended December 31, 2017 and 2016
6. Inventories
($ thousands)($ thousands)($ thousands)($ thousands)
New equipment $ 116,016 $ 104,424
Used equipment 128,188 101,073
Parts and accessories 45,188 48,398
Work-in-progress 1,132 1,336
Total inventories $ 290,524 $ 255,231
20162017
During the year ended December 31, 2017, inventories included in costs of sales were $954,995 thousand (2016 -
$858,667 thousand). The total inventory write-downs recorded during the year ended December 31, 2017 and included
in cost of goods sold was $5,624 thousand (2016 - $6,158 thousand). The Company’s inventory has been pledged as
security for floor plan payables under terms of the floorplan agreements and for long-term debt under general security
agreements.
7. Disposal Group Held for Sale
The Company has entered into a definitive agreement to sell its four construction dealerships within the Commercial
and Industrial segment, along with the land and building of one dealership location. There were no impairment losses
recognized and no cumulative income or expenses included in OCI for the disposal group.
Assets and Liabilities of Disposal Group Held for Sale
At December 31, 2017, the Construction disposal group was stated at carrying value and comprised the following assets
and liabilities.
($ thousands)($ thousands)($ thousands)($ thousands) 2017
Trade and other accounts receivable 1,831
Inventories 17,180
Property and equipment 3,693
Intangible assets 2,049
Goodwill 1,527
Assets held for sale $ 26,280
Trade and other liabilities 1,245
Floor plan payables 9,475
Term debt 1,530
Liabilities held for sale $ 12,250
Sale of Assets Held for Sale
In 2016, the Company sold two properties previously held for sale for net proceeds of $7,765 thousand and a net gain
of $1,373 thousand was recognized in other income on the sale. In 2016, a third property and related term debt
previously classified as held-for-sale was reclassified as held-for-use.
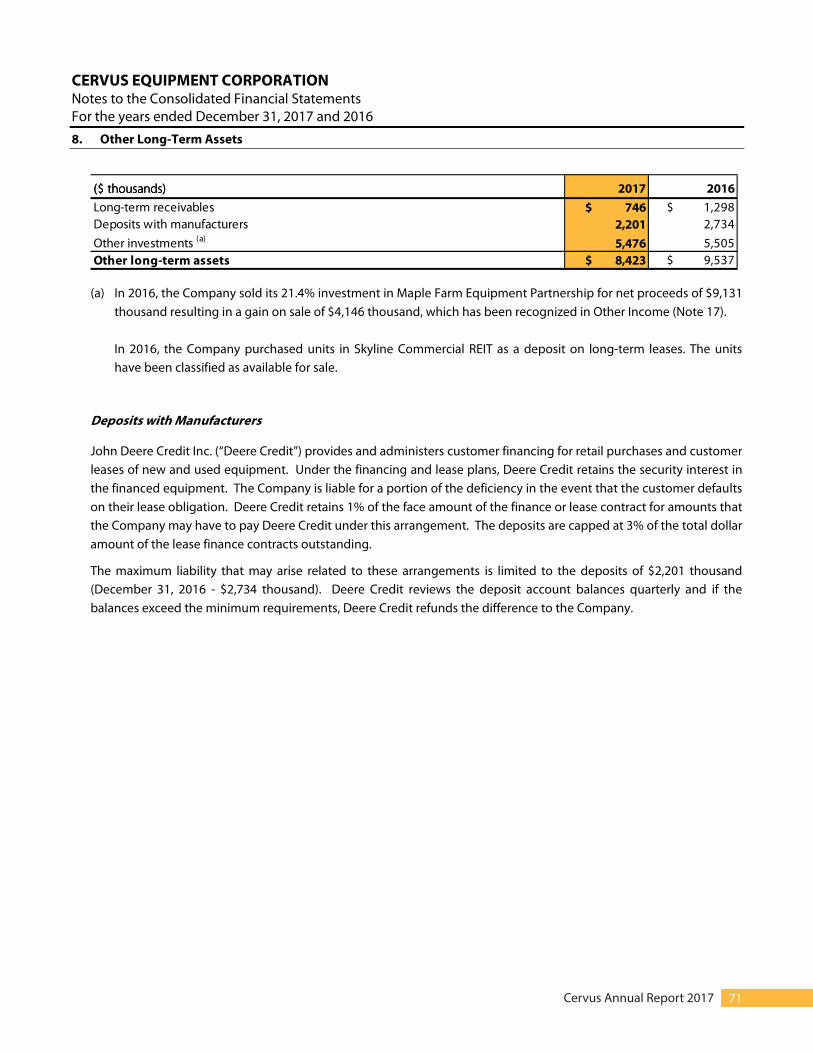
Cervus Annual Report 2017 71
CERVUS EQUIPMENT CORPORATION Notes to the Consolidated Financial Statements
For the years ended December 31, 2017 and 2016
8. Other Long-Term Assets
($ thousands)($ thousands)($ thousands)($ thousands) 2017 2016
Long-term receivables $ 746 $ 1,298
Deposits with manufacturers 2,201 2,734
Other investments (a)5,476 5,505
Other long-term assets $ 8,423 $ 9,537
(a) In 2016, the Company sold its 21.4% investment in Maple Farm Equipment Partnership for net proceeds of $9,131
thousand resulting in a gain on sale of $4,146 thousand, which has been recognized in Other Income (Note 17).
In 2016, the Company purchased units in Skyline Commercial REIT as a deposit on long-term leases. The units
have been classified as available for sale.
Deposits with Manufacturers
John Deere Credit Inc. (“Deere Credit”) provides and administers customer financing for retail purchases and customer
leases of new and used equipment. Under the financing and lease plans, Deere Credit retains the security interest in
the financed equipment. The Company is liable for a portion of the deficiency in the event that the customer defaults
on their lease obligation. Deere Credit retains 1% of the face amount of the finance or lease contract for amounts that
the Company may have to pay Deere Credit under this arrangement. The deposits are capped at 3% of the total dollar
amount of the lease finance contracts outstanding.
The maximum liability that may arise related to these arrangements is limited to the deposits of $2,201 thousand
(December 31, 2016 - $2,734 thousand). Deere Credit reviews the deposit account balances quarterly and if the
balances exceed the minimum requirements, Deere Credit refunds the difference to the Company.

Cervus Annual Report 2017 72
CERVUS EQUIPMENT CORPORATION Notes to the Consolidated Financial Statements
For the years ended December 31, 2017 and 2016
9. Property and Equipment
($ thousands)($ thousands)($ thousands)($ thousands)
CostCostCostCost
Land and Land and Land and Land and
BuildingsBuildingsBuildingsBuildings
Short-term Short-term Short-term Short-term
Rental Rental Rental Rental
EquipmentEquipmentEquipmentEquipment
Automotive Automotive Automotive Automotive
and Trucksand Trucksand Trucksand Trucks
Furniture Furniture Furniture Furniture
and and and and
FixturesFixturesFixturesFixtures
Parts and Parts and Parts and Parts and
Shop Shop Shop Shop
EquipmentEquipmentEquipmentEquipment
Computers Computers Computers Computers
and Softwareand Softwareand Softwareand Software
Leasehold Leasehold Leasehold Leasehold
ImprovementsImprovementsImprovementsImprovements Total
Balance at January 1, 2016Balance at January 1, 2016Balance at January 1, 2016Balance at January 1, 2016 85,172 50,989 20,694 7,033 8,308 5,187 3,724 181,107
Additions 201 2,647 1,723 388 579 630 242 6,410
Additions for finance lease - 1,544 - - - - - 1,544
Disposals (a) (59,411) (4,045) (1,312) (167) (484) (2,736) (44) (68,199)
Assets held for sale 3,187 - - - - - - 3,187
Transfers - (7,434) - - - - - (7,434)
Effect of movements in
exchange rates (155) (126) (129) (26) (36) (10) (4) (486)
Balance at December 31, 2016Balance at December 31, 2016Balance at December 31, 2016Balance at December 31, 2016 28,994 43,575 20,976 7,228 8,367 3,071 3,918 116,129
Additions 696 2,623 2,440 282 499 1,166 475 8,181
Additions for finance lease - 4,925 - - - - - 4,925
Disposals (4,014) (7,471) (1,516) (381) (599) (21) (211) (14,213)
Assets held for sale (Note 7) (3,187) (910) (1,239) (280) (539) (108) (751) (7,014)
Transfers - (1,821) - - 112 - - (1,709)
Effect of movements in
exchange rates193 (468) (29) (18) (45) (43) (11) (421)
Balance at December 31, 2017Balance at December 31, 2017Balance at December 31, 2017Balance at December 31, 2017 22,682 40,453 20,632 6,831 7,795 4,065 3,420 $ 105,878
($ thousands)($ thousands)($ thousands)($ thousands)
Accumulated Depreciation Accumulated Depreciation Accumulated Depreciation Accumulated Depreciation
and Impairmentand Impairmentand Impairmentand Impairment
Land and Land and Land and Land and
BuildingsBuildingsBuildingsBuildings
Short-term Short-term Short-term Short-term
Rental Rental Rental Rental
EquipmentEquipmentEquipmentEquipment
Automotive Automotive Automotive Automotive
and Trucksand Trucksand Trucksand Trucks
Furniture Furniture Furniture Furniture
and and and and
FixturesFixturesFixturesFixtures
Parts and Parts and Parts and Parts and
Shop Shop Shop Shop
EquipmentEquipmentEquipmentEquipment
Computers Computers Computers Computers
and Softwareand Softwareand Softwareand Software
Leasehold Leasehold Leasehold Leasehold
ImprovementsImprovementsImprovementsImprovements Total
Balance at January 1, 2016Balance at January 1, 2016Balance at January 1, 2016Balance at January 1, 2016 5,715 9,024 10,664 3,811 4,962 3,713 1,419 39,308
Depreciation expense 2,103 4,830 2,749 807 900 665 433 12,487
Disposals (4,828) (1,725) (722) (81) (428) (2,297) (29) (10,110)
Assets held for sale 324 - - - - - - 324
Transfers - (1,272) - - - - - (1,272)
Effects of movements in
exchange rates (5) (9) (51) (12) (20) (9) - (106)
Balance at December 31, 2016Balance at December 31, 2016Balance at December 31, 2016Balance at December 31, 2016 3,309 10,848 12,640 4,525 5,414 2,072 1,823 40,631
Depreciation expense 648 6,890 2,326 690 805 521 475 12,355
Disposals (189) (3,028) (1,077) (333) (502) (17) (143) (5,289)
Assets held for sale (Note 7) (517) (336) (1,003) (250) (451) (75) (689) (3,321)
Transfers - (329) - - - (1) - (330)
Effects of movements in
exchange rates 3 (187) (71) (10) (39) (36) (3) (343)
Balance at December 31, 2017Balance at December 31, 2017Balance at December 31, 2017Balance at December 31, 2017 3,254 13,858 12,815 4,622 5,227 2,464 1,463 $ 43,703
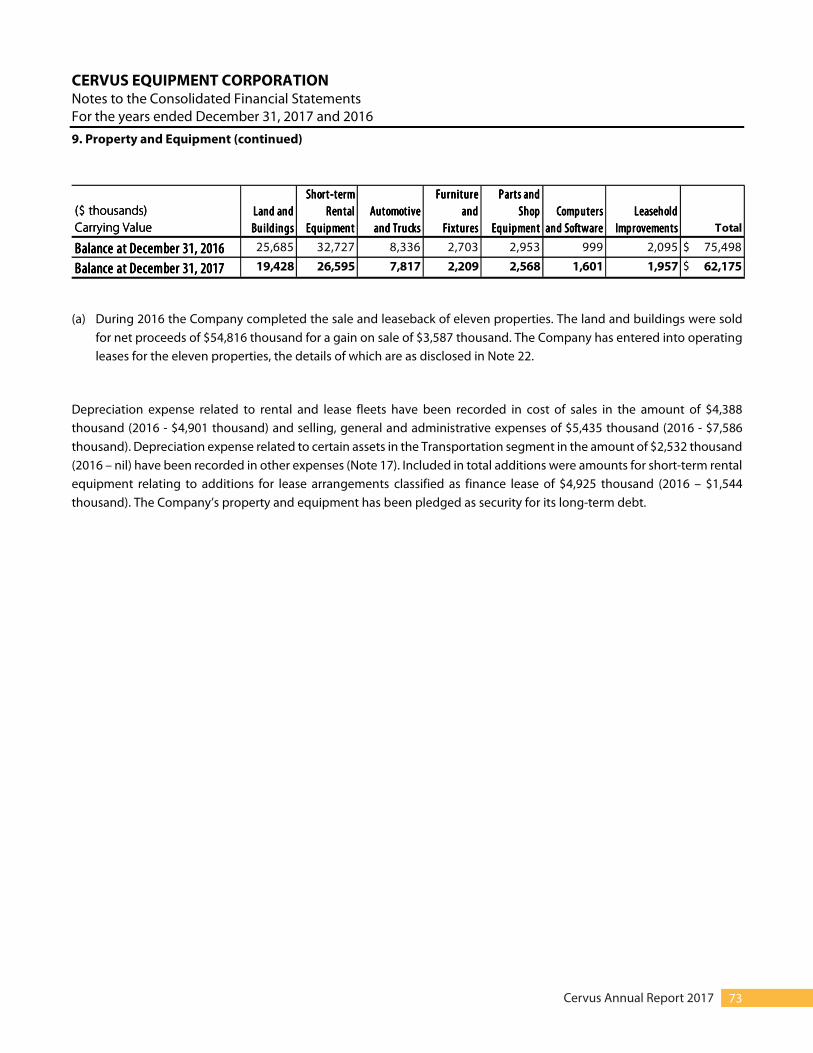
Cervus Annual Report 2017 73
CERVUS EQUIPMENT CORPORATION Notes to the Consolidated Financial Statements
For the years ended December 31, 2017 and 2016
9. Property and Equipment (continued)
($ thousands)($ thousands)($ thousands)($ thousands)
Carrying ValueCarrying ValueCarrying ValueCarrying Value
Land and Land and Land and Land and
BuildingsBuildingsBuildingsBuildings
Short-term Short-term Short-term Short-term
Rental Rental Rental Rental
EquipmentEquipmentEquipmentEquipment
Automotive Automotive Automotive Automotive
and Trucksand Trucksand Trucksand Trucks
Furniture Furniture Furniture Furniture
and and and and
FixturesFixturesFixturesFixtures
Parts and Parts and Parts and Parts and
Shop Shop Shop Shop
EquipmentEquipmentEquipmentEquipment
Computers Computers Computers Computers
and Softwareand Softwareand Softwareand Software
Leasehold Leasehold Leasehold Leasehold
ImprovementsImprovementsImprovementsImprovements Total
Balance at December 31, 2016Balance at December 31, 2016Balance at December 31, 2016Balance at December 31, 2016 25,685 32,727 8,336 2,703 2,953 999 2,095 $ 75,498
Balance at December 31, 2017Balance at December 31, 2017Balance at December 31, 2017Balance at December 31, 2017 19,428 26,595 7,817 2,209 2,568 1,601 1,957 $ 62,175
(a) During 2016 the Company completed the sale and leaseback of eleven properties. The land and buildings were sold
for net proceeds of $54,816 thousand for a gain on sale of $3,587 thousand. The Company has entered into operating
leases for the eleven properties, the details of which are as disclosed in Note 22.
Depreciation expense related to rental and lease fleets have been recorded in cost of sales in the amount of $4,388
thousand (2016 - $4,901 thousand) and selling, general and administrative expenses of $5,435 thousand (2016 - $7,586
thousand). Depreciation expense related to certain assets in the Transportation segment in the amount of $2,532 thousand
(2016 – nil) have been recorded in other expenses (Note 17). Included in total additions were amounts for short-term rental
equipment relating to additions for lease arrangements classified as finance lease of $4,925 thousand (2016 – $1,544
thousand). The Company’s property and equipment has been pledged as security for its long-term debt.

Cervus Annual Report 2017 74
CERVUS EQUIPMENT CORPORATION Notes to the Consolidated Financial Statements
For the years ended December 31, 2017 and 2016
10. Intangible Assets and Goodwill
Intangible Assets
Intangible assets are comprised of the following:
CostCostCostCost
Dealership Dealership Dealership Dealership
Distribution Distribution Distribution Distribution
AgreementsAgreementsAgreementsAgreements
CustomerCustomerCustomerCustomer
ListsListsListsLists
Non-Non-Non-Non-
Competition Competition Competition Competition
AgreementsAgreementsAgreementsAgreements
Software Software Software Software
CostsCostsCostsCosts Total
Balance at January 1, 2016Balance at January 1, 2016Balance at January 1, 2016Balance at January 1, 2016 52,240 15,959 3,509 2,361 74,069
Additions - - - 954 954
Effect of movements in exchange rates (178) (19) (4) - (201)
Balance at December 31, 2016Balance at December 31, 2016Balance at December 31, 2016Balance at December 31, 2016 52,062 15,940 3,505 3,315 74,822
Additions - - - 451 451
Effect of movements in exchange rates 39 17 3 - 59
Assets held for sale (Note 7) (5,200) (1,100) (900) - (7,200)
Balance at December 31, 2017Balance at December 31, 2017Balance at December 31, 2017Balance at December 31, 2017 46,901 14,857 2,608 3,766 $ 68,132
Accumulated Depreciation Accumulated Depreciation Accumulated Depreciation Accumulated Depreciation
Dealership Dealership Dealership Dealership
Distribution Distribution Distribution Distribution
AgreementsAgreementsAgreementsAgreements
CustomerCustomerCustomerCustomer
ListsListsListsLists
Non-Non-Non-Non-
Competition Competition Competition Competition
AgreementsAgreementsAgreementsAgreements
Software Software Software Software
CostsCostsCostsCosts Total
Balance at January 1, 2016Balance at January 1, 2016Balance at January 1, 2016Balance at January 1, 2016 10,066 10,569 2,354 72 23,061
Amortization expense 2,650 1,669 323 605 5,247
Balance at December 31, 2016Balance at December 31, 2016Balance at December 31, 2016Balance at December 31, 2016 12,716 12,238 2,677 677 28,308
Amortization expense 2,055 2,005 345 828 5,233
Assets held for sale (Note 7) (3,151) (1,100) (900) - (5,151)
Balance at December 31, 2017Balance at December 31, 2017Balance at December 31, 2017Balance at December 31, 2017 11,620 13,143 2,122 1,505 $ 28,390
Carrying ValueCarrying ValueCarrying ValueCarrying Value
Dealership Dealership Dealership Dealership
Distribution Distribution Distribution Distribution
AgreementsAgreementsAgreementsAgreements
CustomerCustomerCustomerCustomer
ListsListsListsLists
Non-Non-Non-Non-
Competition Competition Competition Competition
AgreementsAgreementsAgreementsAgreements
Software Software Software Software
CostsCostsCostsCosts Total
Balance at December 31, 2016Balance at December 31, 2016Balance at December 31, 2016Balance at December 31, 2016 39,346 3,702 828 2,638 $ 46,514
Balance at December 31, 2017Balance at December 31, 2017Balance at December 31, 2017Balance at December 31, 2017 35,281 1,714 486 2,261 $ 39,742
Amortization expense of $5,233 thousand (2016 - $5,247 thousand) has been recorded in selling, general and
administrative expense.

Cervus Annual Report 2017 75
CERVUS EQUIPMENT CORPORATION Notes to the Consolidated Financial Statements
For the years ended December 31, 2017 and 2016
10. Intangible Assets and Goodwill (continued)
Goodwill
The continuity of the Company`s goodwill is as follows:
($ thousands)($ thousands)($ thousands)($ thousands)
Balance at January 1, 2016Balance at January 1, 2016Balance at January 1, 2016Balance at January 1, 2016 $ 20,616
Impact of translation of goodwill held in foreign currencies (72)
Balance at December 31, 2016Balance at December 31, 2016Balance at December 31, 2016Balance at December 31, 2016 $ 20,544
Impact of translation of goodwill held in foreign currencies (68)
Disposal of goodwill (a) (69)
Assets held for sale (Note 7) (1,527)
Balance at December 31, 2017Balance at December 31, 2017Balance at December 31, 2017Balance at December 31, 2017 $ 18,880
(a) The Company disposed of goodwill in relation to assets sold in 2017.
The aggregate carrying amounts of goodwill allocated to each CGU are as follows:
($ thousands)($ thousands)($ thousands)($ thousands) 2017 2016
Agricultural Segment
Agricultural - Alberta $ 11,988 $ 11,988
Agricultural - Saskatchewan 327 327
Agricultural - New Zealand 2,098 2,248
Agricultural - Australia 1,254 1,241
Commercial and Industrial Segment
Commercial - 1,527
Industrial 666 666
Transportation Segment
Transportation - Ontario 2,547 2,547
Carrying value of goodwill $ 18,880 $ 20,544
Annual Impairment Test
The Company conducted the annual impairment test of goodwill at December 31, 2017 and 2016. The recoverable
amount of the cash-generating units (CGUs) was determined using value in use calculations. Value in use was
determined by discounting the future cash flow forecasts for a five-year period and applying after-tax discount rates
ranging from 11.1% to 12.0% (2016 – 11.3% to 12.1%) based on the Company’s post-tax weighted average cost of
capital and risks specific to particular CGUs (pre-tax discount rate of 15.2% to 17.1% in 2017 (2016 – 15.7% to 16.8%)).
Future cash flow estimates began with 2017 revenue, gross profit margin, and expenses, which were then adjusted
through the forecast period for the outlook of the CGU at the date of impairment testing. In situations where 2017
performance diverged from demonstrated historical mid cycle performance, revenue in the five-year forecast period
was based on mean convergence with historical mid cycle actual results for the CGU.
CGU revenue expectations within the forecast period were also assessed for reasonability against third party market
expectations at the time of impairment testing. Further, forecasts were assessed for reasonability against the
demonstrated historical performance of the CGUs. Revenues used in the forecast period did not exceed prior historical
revenue levels of the CGU, other than the impact of assumed inflation. A growth rate was not applied in extrapolating
the resulting cash flows beyond the fifth year of the forecast period.

Cervus Annual Report 2017 76
CERVUS EQUIPMENT CORPORATION Notes to the Consolidated Financial Statements
For the years ended December 31, 2017 and 2016
10. Intangible Assets and Goodwill (continued)
CGU historical gross profit margin has generally increased in periods of increased revenue and decreased in periods of
lower revenue. Therefore, gross profit margin in the forecast period was based on the CGU’s historical gross profit at
historical revenue levels corresponding with the annual revenues used in the forecast period. The expense forecasts
for each CGU were set based on historical expenses as a percent of revenue. Cash requirements for working capital were
benchmarked by CGU based on historical actual working capital requirements as a percent of annual historical revenue.
Sensitivity testing was conducted as part of the impairment test. Had the estimated cost of capital used in determining
the post-tax discount rate been 1% higher than management’s estimates the recoverable amount of the CGUs would
continue to exceed their carrying amount. Alternatively, holding the post-tax discount rate unchanged from that
utilized in the annual impairment tests, had the annual estimated cash flows of each CGU in the forecast and terminal
period decreased by 14%, the recoverable amounts of each CGU would continue to exceed their carrying amounts. Any
additional negative changes in the cash flow assumption would cause goodwill to be impaired, with such impairment
loss recognized in net earnings.
The impairment calculations require the use of estimates related to the future operating results and cash generating
ability of the assets. Judgment is also used in identifying the CGUs or group of CGUs at which goodwill, intangible assets
and property and equipment are monitored for internal management purposes and identifying an appropriate
discount rate for these calculations.
11. Trade and Other Liabilities
($ thousands)($ thousands)($ thousands)($ thousands) 2017 2016
Trade and other payables $ 49,290 $ 40,689
Non-trade payables and accrued expenses 25,672 25,742
Customer deposits 3,086 8,362
Dividends payable (Note 16) 1,098 1,103
Income taxes payable 2,408 3,301
Foreign exchange contracts 402 615
Current portion of finance lease obligation (Note 13) 5,361 4,528
Total trade and other liabilities $ 87,317 $ 84,340
12. Loans and Borrowings
Bank Indebtedness
At December 31, 2017, the Company has a revolving credit facility (the “Syndicated Facility”), with a syndicate of lenders.
The principal amount available under this facility is $100 million. The facility was amended and extended on December
19, 2016. The facility is committed for a three year term, but may be extended on or before the anniversary date with
the consent of the lenders. The facility contains an $80 million accordion which the Company may request as an increase
to the total available facility, subject to lender approval. As at December 31, 2017 there was $25 million drawn on the
facility and $2.4 million had been utilized for outstanding letters of credit to John Deere. The Company’s credit facility
bears interest at the lender’s prime rate plus the Applicable Margin (currently 0%). Applicable Margin can range from
0% to 2.00% (2016 – 0% to 2.00%) and is based on a liabilities to income ratio.

Cervus Annual Report 2017 77
CERVUS EQUIPMENT CORPORATION Notes to the Consolidated Financial Statements
For the years ended December 31, 2017 and 2016
12. Loans and Borrowings (continued)
Term Debt Borrowings
The Syndicated Facility is secured by a general security agreement, a priority agreement; trade accounts receivable,
unencumbered inventories, assignment of fire insurance and guarantees from the Company’s subsidiaries. As terms
under the Syndicated Facility, the Company must maintain certain leverage, income coverage, and asset coverage
ratios, which the Company has complied with throughout 2017, see Note 24 for further discussion on covenants. Costs
directly attributable to the completion of the Syndicated Facility have been deferred and will be amortized over the
three year term.
Outstanding Borrowings
($ thousands)($ thousands)($ thousands)($ thousands)
Year of Year of Year of Year of
MaturityMaturityMaturityMaturity 2017 2016
Operating and Other Bank Credit Facilities
Revolving credit facility, lenders prime rate plus the Applicable Margin (currently
0.0%). Applicable Margin can range from 0% to 2.0% and is based on a liabilities to
income ratio
2019 $ 25,000 $ 11,100
National Australian Bank, Australia, revolving credit facility, interest at 5.9% 2018 589 -
Capital Facilities
Farm Credit Corporation, mortgages payable in monthly instalments of $23
thousand including interest at 4.46%, a rate of lenders prime plus 1% per annum
(December 31, 2016 - 3.70%)
2022 1,792 2,005
Farm Credit Corporation, mortgages payable in monthly instalments of $37
thousand including interest at 4.20%, a rate of lenders prime plus 1% per annum
(December 31, 2016 - 3.70%)
2019 4,468 4,730
Affinity Credit Union, mortgages payable in monthly installments of $16 thousand,
including interest at 3.24% per annum2018 5,822 6,008
National Australian Bank, Australia, mortgage, payable monthly payments of $25
thousand and a floating interest rate (December 31, 2016 - 6.4%)(a) 2017 - 2,800
Rental Equipment Term Loans
John Deere finance contracts, New Zealand, payable in monthly instalments
including interest at the rate of 5.1% per annum, secured by related equipmentVarious 5,586 7,693
Hire purchase contracts, Australia, finance contracts payable in monthly
installments ranging up to AUD $4 thousand including interest at a rate of 4.6% to
6.4%, secured by related equipment
Various 1,312 1,223
Finance contracts, various, repayable in monthly instalments ranging per month
including interest from 4.2% to 9.3%Various 648 2,213
45,217 37,772
Less current portion (11,122) (15,720)
Less liabilities held for sale (Note 7) (1,530) -
Less deferred debt issuance costs (395) (392)
Carrying value of term debt at December 31 $ 32,170 $ 21,660
(a) The 2016 National Australia Bank balance included mortgage payable amounts which were repaid during the year
upon the sale of three properties in Australia.

Cervus Annual Report 2017 78
CERVUS EQUIPMENT CORPORATION Notes to the Consolidated Financial Statements
For the years ended December 31, 2017 and 2016
12. Loans and Borrowings (continued)
Floor Plan Payables
The Company utilizes floor plan financing arrangements with various suppliers for inventory purchases. The terms of
these arrangements may include an interest-free period followed by a term during which interest is charged at rates
ranging from 3.00% to 8.20% at December 31, 2017. Settlement of the floor plan liability occurs at the earlier of sale of
the inventory, in accordance with terms of the financing arrangement, or based on management’s discretion. Floor plan
payables are secured by specific new and used equipment inventories.
($ thousands)($ thousands)($ thousands)($ thousands) Interest Rate 2017 2016
John Deere Financial, Canada 4.45% - 8.20% $ 72,165 $ 42,302
Wells Fargo Vendor Finance 5.10% - 6.30% 3,412 5,556
6.05% - 6.50% 13,640 10,716
PACCAR Financial 4.07% - 4.12% 33,806 21,762
CIBC Floor Plan Facility 4.59% 908 4,019
Other Floor Plan Facilities 3.00% - 5.06% 1,642 1,736
Total floor plan payable $ 125,573 $ 86,091
John Deere Financial, New Zealand and Australia
Convertible Debenture
On July 24, 2012, the Company issued $34,500 thousand of convertible unsecured subordinated debentures with a face
value of $1,000 per debenture that matured on July 31, 2017 and bore interest at 6.0% per annum paid semi-annually
on January 31 and July 31 of each year. The debentures were convertible at the option of the holder into shares of the
Company at any time prior to the maturity date at a rate of $26.15 (the "conversion price") per share.
The convertible debentures were considered a compound financial instrument as they could be converted to a fixed
number of common shares at the option of the holder. The liability component of a compound financial instrument
was recognized initially at the fair value of a similar liability that does not have an equity conversion option, and
subsequently accounted for under the effective interest rate method. The equity component was recognized initially
at the difference between the fair value of the compound financial instrument as a whole and the fair value of the
liability component. Any directly attributable transaction costs were allocated to the liability and equity components
in proportion to their initial carrying amounts.
The Company repaid its convertible debenture in cash on July 31, 2017. Repayment was funded by a draw on the
Company’s long term committed syndicated credit facility.
Changes in the debenture liability are as follows:
($ thousands)($ thousands)($ thousands)($ thousands) 2017 2016
Face value of convertible debenture $ 34,500 $ 34,500
Discount to face value at issuance under effective interest method (4,251) (4,251)
Cumulative amortization of discount through December 31 4,251 3,650
Repayment of convertible debenture (34,500) -
Carrying value of debenture payable at December 31 $ - $ 33,899

Cervus Annual Report 2017 79
CERVUS EQUIPMENT CORPORATION Notes to the Consolidated Financial Statements
For the years ended December 31, 2017 and 2016
12. Loans and Borrowings (continued)
Pre-Approved Credit Limits and Available Credit Facilities
A summary of the Company’s maximum pre-approved credit limits on available credit facilities as at December 31, 2017
are as follows:
Total LimitsTotal LimitsTotal LimitsTotal Limits BorrowingsBorrowingsBorrowingsBorrowings
Letters of Letters of Letters of Letters of
CreditCreditCreditCredit
Amount Amount Amount Amount
AvailableAvailableAvailableAvailable Total LimitsTotal LimitsTotal LimitsTotal Limits BorrowingsBorrowingsBorrowingsBorrowings
Letters of Letters of Letters of Letters of
CreditCreditCreditCredit
Amount Amount Amount Amount
AvailableAvailableAvailableAvailable
Operating and other bank credit facilities 101,925 25,589 2,400 73,936 100,000 11,100 2,556 86,344
Capital facilities (a) 12,082 15,543
Floor plan facilities and rental equipment
term loan financing (b) 133,119 97,220
Total borrowing 170,790 123,863
Total current portion long term debt (11,122) (15,720)
Total inventory floor plan facilities (125,573) (86,091)
Term debt held for sale (Note 7) (1,530) -
Deferred debt issuance costs (395) (392)
Total long term debt 32,170 21,660
($ thousands)($ thousands)($ thousands)($ thousands)
December 31, 2017 December 31, 2016
(a) For capital facilities, the amount available under the facilities is limited to the lesser of the pre-approved credit limit
of $55.8 million (2016-$58.5 million) or the available unencumbered assets which is estimated at $1.5 million as at
December 31, 2017 (2016- $3.3 million).
(b) For floorplan facilities, the amount available under the facilities is limited to the lesser of the pre-approved credit
limit of $453.0 million (2016-$471.5 million) or the available unencumbered assets which is estimated at $28.9
million as at December 31, 2017 (2016- $33.2 million).

Cervus Annual Report 2017 80
CERVUS EQUIPMENT CORPORATION Notes to the Consolidated Financial Statements
For the years ended December 31, 2017 and 2016
12. Loans and Borrowings (continued)
Reconciliation of Movements of Liabilities to Cash Flows Arising from Financing Activities
Dividend
payable
Debenture
payable
Finance
lease
obligation Term debt Total
Balance at January 1, 2017 1,103 33,899 15,223 37,380 87,605
Changes from financing cash (outflows) inflows
Cash dividends paid (3,626) - - - (3,626)
Repayment of debenture payable - (34,500) - - (34,500)
Payment of finance lease liabilities - - (4,373) - (4,373)
Advance of term debt - - - 7,692 7,692
Total (outflows) inflows from financing cash flows (3,626) (34,500) (4,373) 7,692 (34,807)
Effect of changes in foreign exchange rates - - - (250) (250)
Liabilities held for sale - - - (1,530) (1,530)
Liability related changes
Dividends issued through DRIP (778) - - - (778)
Dividends declared 4,399 - - - 4,399
New finance leases - - 4,927 - 4,927
Interest expense - 1,808 - - 1,808
Interest paid - (1,207) - - (1,207)
Total liability related other increase (decrease) 3,621 601 4,927 - 9,149
Balance at December 31, 2017 1,098 - 15,777 43,292 60,167
Financial Liabilities
($ thousands)($ thousands)($ thousands)($ thousands)
13. Finance Leases
As Lessee - Finance Lease Liabilities
Finance lease liabilities reflect the Company’s total future payments on leases for heavy trucks and equipment,
including final payments or buyouts. The finance lease assets are subsequently leased to customers, primarily under
operating lease agreements. Based on the effective interest rate implicit in each lease these future payments are
discounted to determine the net scheduled lease payments on each lease. The leases have terms typically between 1
and 7 years. On the maturity of the lease, the Company will sell the equipment. The difference between the Company’s
proceeds and the residual value per the lease agreement remains with the Company.
Finance lease liabilities as at December 31, 2017 and 2016 are payable as follows:
2017 2016 2017 2016 2017 2016
Less than one year $ 5,535 $ 4,677 $ (174) $ (149) $ 5,361 $ 4,528
Between one and five years 11,260 11,562 (1,474) (1,558) 9,786 10,004
More than five years 965 918 (335) (227) 630 691
Total $ 17,760 $ 17,157 $ (1,983) $ (1,934) $ 15,777 $ 15,223
($ thousands)($ thousands)($ thousands)($ thousands)
Future minimum lease
paymentsInterest
Present value of minimum
lease payments

Cervus Annual Report 2017 81
CERVUS EQUIPMENT CORPORATION Notes to the Consolidated Financial Statements
For the years ended December 31, 2017 and 2016
14. Income Taxes
Tax Expense
($ thousands)($ thousands)($ thousands)($ thousands) 2017 2016
Current income tax expense $ 9,700 $ 8,082
Deferred income tax recovery (654) (1,040)
$ 9,046 $ 7,042Income tax expense
Using federal and provincial statutory rates of 26.8% (2016 – 26.9%), the income tax expense for the year can be
reconciled to the statement of comprehensive income as follows:
($ thousands)($ thousands)($ thousands)($ thousands) 2017 2016
Income before income tax expense $ 28,958 $ 30,566
Expected income tax expense 7,761 8,222
Non-deductible costs and other 1,285 (1,180)
$ 9,046 $ 7,042Income tax expense
Deferred Tax Assets and Liabilities
Continuity of the Company’s tax balances in during the year are as follows:
($ thousands)($ thousands)($ thousands)($ thousands) 2016 2017
Tangible assets $ 8,170 (516)$ $ 7,654
Intangible assets 6,159 (146) 6,013
Finance lease obligation (4,093) (149) (4,242)
Unrealized foreign exchange and other 372 157 529
Net deferred tax liabillity $ 10,608 $ (654) $ 9,954
Recognized in Recognized in Recognized in Recognized in
Comprehensive Comprehensive Comprehensive Comprehensive
IncomeIncomeIncomeIncome
The Company has not recognized the benefits associated with net capital losses of $36,302 thousand (2016 - $36,586
thousand) and non-capital losses of $936 thousand (2016 - $941 thousand), as the timing and ultimate application of
these tax loss carryforwards are uncertain.

Cervus Annual Report 2017 82
CERVUS EQUIPMENT CORPORATION Notes to the Consolidated Financial Statements
For the years ended December 31, 2017 and 2016
15. Financial Instruments
Fair values are approximate amounts at which financial instruments could be exchanged between willing parties based
on current markets for instruments with similar characteristics, such as risk, principal, and remaining maturities.
Financial instruments recorded or disclosed at fair value are classified using a fair value hierarchy that reflects the
significance of the inputs used in making the measurements. The fair value hierarchy has the following levels:
Level 1: Reflects valuation based on quoted prices observed in active markets for identical assets or liabilities;
Level 2: Reflects valuation techniques based on inputs other than quoted prices included in level 1 that are
observable either directly or indirectly;
Level 3: Reflects valuation techniques with significant unobservable market inputs, there were no level 3
instruments in current or prior year.
Carrying Value and Fair Value of Financial Assets and Liabilities
The following table shows the carrying amounts and fair values of financial assets and financial liabilities, including their
levels in the fair value hierarchy. It does not include fair value information for financial assets and financial liabilities not
measured at fair value if the carrying amount is a reasonable approximation of fair value.
Category Level 1 Level 2 Level 1 Level 2
Financial Assets
Cash and cash equivalents (a) Loans and receivable 14,502$ 14,542$
Trade and other accounts
receivable (a) Loans and receivable 52,834 53,970
Derivative financial instruments Held-for-trading 397 397 617 617
Other investments Available for sale 5,119 5,119 5,000 5,000
Other long-term assets Loans and receivable 2,605 3,459
Finance lease receivables Loans and receivable 640 636 972 977
Financial Liabilities
Trade and other liabilities (a) Other liabilities 86,915 83,725
Floor plan payables (a) Other liabilities 125,573 86,091
Term debt (b) Other liabilities 43,292 43,292 37,380 37,380
Derivative financial liability Held-for-trading 402 402 615 615
Finance lease obligation Other liabilities 15,777 15,716 15,223 15,469
Debenture payable (c) Other liabilities - - 33,899 34,328
($ thousands)($ thousands)($ thousands)($ thousands)
2016
Fair Value
Carrying
value
Carrying
value
Fair Value
2017
(a) The carrying value approximates fair value due to the immediate or short-term maturity.
(b) The carrying values of the current and long-term portions of term debt and notes payable approximate fair value
because the applicable interest rates on these liabilities are at rates similar to prevailing market rates.

Cervus Annual Report 2017 83
CERVUS EQUIPMENT CORPORATION Notes to the Consolidated Financial Statements
For the years ended December 31, 2017 and 2016
15. Financial Instruments (continued)
(c) Debenture payable is measured at amortized cost using the effective interest method. The fair value of debenture
payable at December 31, 2016 is the quoted market trading price for the debentures.
For other financial liabilities where the carrying value does not approximate the fair value, a discounted cash flows
approach was used to determine the fair value. For derivative financial instruments or forward exchange contracts, fair
value is based on market comparison technique based on quoted prices.
16. Capital and Other Components of Equity
The Company has unlimited authorized share capital without par value for all common shares. All issued common
shares have been fully paid.
Share Capital
(thousands)(thousands)(thousands)(thousands)
Number of
common shares
Total carrying
amount
Balance at January 1, 2016 15,606 $ 88,270
Issued under the DRIP plan 79 883
Issued under the deferred share plan 65 710
Balance at December 31, 2016 15,750 89,863
Issued under the DRIP plan 62 778
Issued under the deferred share plan 103 757
Repurchased under the NCIB (240) (3,235)
Balance at December 31, 2017 15,675 $ 88,163
Common Shares
Shareholders are entitled to:
(i) dividends if, as and when declared by the Board of Directors of the Company;
(ii) to one vote per share at meetings of the holders of Common Shares; and
(iii) upon liquidation, dissolution or winding up of Cervus to receive pro rata the remaining property and assets of
the Company, subject to the rights of shares having priority over the Common Shares.
Normal Course Issuer Bid
On August 21, 2017, the Company announced a Normal Course Issuer Bid (the ‘‘Bid’’), which commenced on August
23, 2017, to purchase up to a maximum of 805,659 common shares (the ‘‘Shares’’) for cancellation before August 22,
2018. Cervus has appointed Raymond James Ltd. as its broker, who will conduct the Bid on behalf of the Company.
All purchases are made in accordance with the Bid at the prevailing market price of the Shares at the time of purchase.
The weighted average price for the common shares repurchased during the year was $13.45 per share.

Cervus Annual Report 2017 84
CERVUS EQUIPMENT CORPORATION Notes to the Consolidated Financial Statements
For the years ended December 31, 2017 and 2016
16. Capital and Other Components of Equity (continued)
Dividends Declared
($ thousands)($ thousands)($ thousands)($ thousands) 2017 2016
$0.28 per qualifying common share (2016 - $0.28) $ 4,399 $ 4,394
Total dividends paid in cash during the year were $3,626 thousand (2016 - $5,725 thousand). Dividends payable as at
December 31, 2017 was $1,098 thousand (2016 - $1,103 thousand).
Dividend Reinvestment Plan
The Company has a Dividend Reinvestment Plan ("DRIP") entitling shareholders to reinvest cash dividends in additional
common shares. The DRIP allows shareholders to reinvest dividends into new shares at 95 percent of the average share
price of the previous 10 trading days prior to distribution.
Accumulated and Other Comprehensive Income
Accumulated and Other Comprehensive Income is comprised of a cumulative translation account that comprises all
foreign currency differences that arise on the translation of the financial statements of the Company’s investment in its
foreign operations, Cervus New Zealand Equipment Ltd., Cervus Equipment Holdings Australia Pyt Ltd. and Cervus
Equipment Australia Pty Ltd.
17. Other Income
Other income for the years ended December 31, 2017 and 2016 are comprised of the following:
($ thousands)($ thousands)($ thousands)($ thousands) 2017 2016
Net gain on sale of property and equipment $ 1,680 $ 5,579
Reorganization costs (a)(2,532) -
Gain on sale of equity accounted investees - 4,146
Unrealized foreign exchange gain (b)890 3,501
Other income 1,074 712
Total other income $ 1,112 $ 13,938
(a) Relates to a valuation adjustment to the Ontario lease fleet, incurred in connection with reorganizing the
Company’s Ontario operations during the year.
(b) Unrealized foreign exchange gain (loss) is due to changes in fair value of our foreign exchange derivative and from
period close translation of accounts payable and floorplan payables denominated in U.S. dollars.

Cervus Annual Report 2017 85
CERVUS EQUIPMENT CORPORATION Notes to the Consolidated Financial Statements
For the years ended December 31, 2017 and 2016
18. Selling, General and Administrative Expenses By Nature
($ thousands)($ thousands)($ thousands)($ thousands) 2017 2016
Wages and benefits 101,530 98,216
Depreciation and amortization 10,668 12,833
Occupancy costs including maintenance 21,609 16,481
Operating and administrative expenses 42,392 36,901
Total selling, general and administrative expenses $ 176,199 $ 164,431
19. Wages and Benefits
($ thousands)($ thousands)($ thousands)($ thousands) 2017 2016
Included in cost of sales:
Wages and benefits $ 36,285 $ 36,038
Included in selling, general and administrative expenses:
Wages and benefits 100,838 97,071
Share-based payments 692 1,145
101,530 98,216
Total wages and benefits $ 137,815 $ 134,254
Total wages and benefits included in selling, general and administrative expenses
Employee Share Purchase Plan
The Company has an employee share purchase plan available to all employees on a voluntary basis. Under the plan,
employees are able to contribute 2% to 4% of their annual salaries, based on years of service. The Company contributes
between 15% and 150%, depending on the Company’s annual financial performance, on a matching basis to a
maximum of $5,000 per year, per employee. The shares are purchased on the open market through a trustee; therefore,
there is no dilutive effect to existing shareholders. Included in selling, general and administrative wages and benefits
expense are $837 thousand (2016 - $919 thousand) of expenses incurred by the Company to match the employee
contributions.
Mid-Term Management Incentive Plan
The Company offers a mid-term incentive plan (the “MTIP”) to certain senior key employees. Under the MTIP,
participants receive annual grants of performance share units (“PSUs”) which are settled in cash based on the
achievement of performance targets at the end of a three year performance period. A liability for MTIP obligation is
recognized at its fair value of cash payable, and is re-measured each reporting period until the liability is settled on the
third anniversary of initial grant. Any changes in the liability are recognized in the statement of comprehensive income.
For the year ended December 31, 2017, MTIP expense recognized during the year amounted to $137 thousand (2016 –
$257 thousand).

Cervus Annual Report 2017 86
CERVUS EQUIPMENT CORPORATION Notes to the Consolidated Financial Statements
For the years ended December 31, 2017 and 2016
19. Wages and Benefits (continued)
Deferred Share Plan
The Company has a deferred share plan available to officers, directors and employees whereby, if elected, certain
payments to these individuals can be deferred, ranging in amounts up to $50 thousand per individual, where the
Company also matches the deferred portion. The deferred shares are granted as approved by the board of directors
based on 95% of the 10-day average share price prior to the date of grant. The matched component of the plan vests
over a period of 5 years (50% after 3 years, 25% after 4 years and 25% after 5 years) and is recorded as selling, general
and administrative expense as it vests. As at December 31, 2017, the Company has 900 thousand shares reserved for
issuance under this plan. As at December 31, 2017, 696 thousand (2016 – 745 thousand) deferred shares have been
issued under the deferred share plan and remain outstanding. Of the outstanding deferred shares, 570 thousand (2016
– 622 thousand) can be converted to common shares.
20. Finance Income and Finance Costs
($ thousands)($ thousands)($ thousands)($ thousands) 2017 2016
Finance income $ 484 $ 169
Interest expense on convertible debenture (1,808) (3,029)
(1,373) (3,657)
Interest expense on financial liabilities (4,108) (5,851)
Finance costs $ (7,289) $ (12,537)
Net finance costs recognized separately (5,379) (10,495)
Net finance costs recognized in cost of sales (1,426) (1,873)
Total net finance costs $ (6,805) $ (12,368)
Interest expense on mortgage and term debt obligations
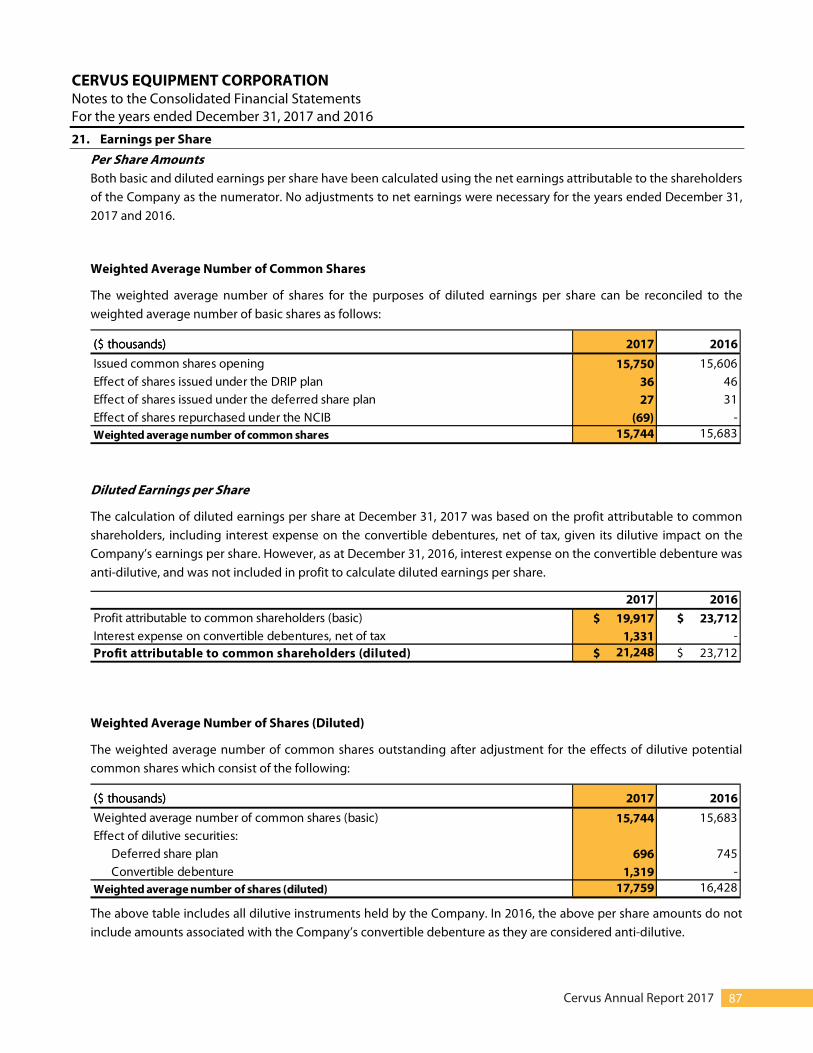
Cervus Annual Report 2017 87
CERVUS EQUIPMENT CORPORATION Notes to the Consolidated Financial Statements
For the years ended December 31, 2017 and 2016
21. Earnings per Share
Per Share Amounts
Both basic and diluted earnings per share have been calculated using the net earnings attributable to the shareholders
of the Company as the numerator. No adjustments to net earnings were necessary for the years ended December 31,
2017 and 2016.
Weighted Average Number of Common Shares
The weighted average number of shares for the purposes of diluted earnings per share can be reconciled to the
weighted average number of basic shares as follows:
($ thousands)($ thousands)($ thousands)($ thousands) 2017 2016
Issued common shares opening 15,750 15,606
Effect of shares issued under the DRIP plan 36 46
27 31
Effect of shares repurchased under the NCIB (69) -
15,744 15,683Weighted average number of common shares
Effect of shares issued under the deferred share plan
Diluted Earnings per Share
The calculation of diluted earnings per share at December 31, 2017 was based on the profit attributable to common
shareholders, including interest expense on the convertible debentures, net of tax, given its dilutive impact on the
Company’s earnings per share. However, as at December 31, 2016, interest expense on the convertible debenture was
anti-dilutive, and was not included in profit to calculate diluted earnings per share.
2017 2016
Profit attributable to common shareholders (basic) $ 19,917 $ 23,712
Interest expense on convertible debentures, net of tax 1,331 -
Profit attributable to common shareholders (diluted) $ 21,248 $ 23,712
Weighted Average Number of Shares (Diluted)
The weighted average number of common shares outstanding after adjustment for the effects of dilutive potential
common shares which consist of the following:
($ thousands)($ thousands)($ thousands)($ thousands) 2017 2016
15,744 15,683
Effect of dilutive securities:
Deferred share plan 696 745
Convertible debenture 1,319 -
17,759 16,428Weighted average number of shares (diluted)
Weighted average number of common shares (basic)
The above table includes all dilutive instruments held by the Company. In 2016, the above per share amounts do not
include amounts associated with the Company’s convertible debenture as they are considered anti-dilutive.

Cervus Annual Report 2017 88
CERVUS EQUIPMENT CORPORATION Notes to the Consolidated Financial Statements
For the years ended December 31, 2017 and 2016
22. Operating Leases
a) As Lessee
The Company leases a number of lands and building facilities, office equipment and vehicles. The leases typically run
for a period of between 1 to 20 years (2016 - 3 and 20 years) with options to renew the leases on the lands and buildings
after that date. The land and building leases do not include any provisions for transfer of title. It was determined that
substantially all the risks and rewards of ownership of the land and buildings remains with the landlord. As such, the
Company has determined that the leases are operating leases.
In 2016, the company completed the sale and leaseback of eleven properties. The properties were entered into long-
term leases ranging from 15-20 years with an option to renew for two ten year periods at market terms at the time of
renewal. The lease cost escalates a rate of 1% per year.
The Company is committed to the following minimum payments under operating leases for land and buildings,
equipment and vehicles:
($ thousands)($ thousands)($ thousands)($ thousands) 2017 2016
Less than 1 year $ 11,775 11,096
Between 1 and 5 years 34,168 31,572
More than 5 years 83,407 78,518
$ 129,350 121,186
b) As Lessor
The Company has entered into fixed term contractual arrangements to allow customers to have dedicated use of
certain heavy trucks and equipment owned by the Company. The minimum payments for the non-cancellable
operating leases for rental fleet is as follows:
($ thousands)($ thousands)($ thousands)($ thousands) 2017 2016
Less than 1 year $ 3,780 3,308
Between 1 and 5 years 7,102 8,058
More than 5 years 547 933
$ 11,429 12,299
23. Supplemental Cash Flow Information
($ thousands)($ thousands)($ thousands)($ thousands) 2017 2016
Changes in non-cash working capital:
Inventory (58,343) 61,386
Floorplan 49,221 (79,085)
(1,686) 932
Trade and other liabilities 4,544 (5,601)
(6,264) (22,368)
Trade and other receivables
Total change in non-cash working capital
The change in non-cash working capital takes into consideration the assets and liabilities held for sale (Note 7).
Cervus Annual Report 2017 89
CERVUS EQUIPMENT CORPORATION Notes to the Consolidated Financial Statements
For the years ended December 31, 2017 and 2016
24. Financial Risk Management
Overview
The Company has exposure to the following risks from its use of financial instruments: credit risk; liquidity risk; and
market risk. This note presents information about the Company’s exposure to each of the above risks, the Company’s
objectives, policies and processes for measuring and managing risk, and the Company’s management of capital. Further
quantitative disclosures are included throughout these consolidated financial statements.
Risk Management Framework
The Board of Directors (“Board”) has overall responsibility for the establishment and oversight of the Company’s risk
management framework. The Board, together with the Audit Committee are responsible for monitoring and oversight
of the Company’s risk management policies. The Company’s risk management policies are established to identify and
analyze the risks faced by the Company, to set appropriate risk limits and controls, and to monitor risks and adherence
to limits. Risk management policies and systems are reviewed regularly to reflect changes in market conditions and the
Company’s activities. The Company, through its training and management standards and procedures, aims to develop
a disciplined and constructive control environment in which all employees understand their roles and obligations.
The Company’s Audit Committee oversees how management monitors compliance with the Company’s risk
management policies and procedures, and reviews the adequacy of the risk management framework in relation to the
risks faced by the Company.
Credit Risk
Trade and Other Receivables
By granting credit sales to customers, it is possible these entities, to which the Company provides services, may
experience financial difficulty and be unable to fulfill their obligations. A substantial amount of the Company’s revenue
is generated from customers in the farming, construction and industrial, and transportation equipment industries. This
results in a concentration of credit risk from customers in these industries. A significant decline in economic conditions
within these industries would increase the risk customers will experience financial difficulty and be unable to fulfill their
obligations to the Company. The Company’s exposure to credit risk arises from granting credit sales and is limited to
the carrying value of accounts receivable, finance lease receivables, long-term receivables and deposits with
manufacturers (see Note 5).
Goods are sold subject to retention of title clauses so that in the event of non-payment, the Company may have a
secured claim. The Company will also register liens in respect to trade and other long-term receivables as deemed
necessary and dependent on the value of the receivable.

Cervus Annual Report 2017 90
CERVUS EQUIPMENT CORPORATION Notes to the Consolidated Financial Statements
For the years ended December 31, 2017 and 2016
24. Financial Risk Management (continued)
The carrying amount of financial assets represents the maximum credit exposure. The maximum exposure to credit risk
at the reporting dates was:
($ thousands)($ thousands)($ thousands)($ thousands) 2017 2016
Trade receivables (a) $ 43,285 $ 48,282
Other receivables 3,642 5,048
$ 46,927 $ 53,330
The maximum exposure to credit risk at the reporting date by geographic region was:
($ thousands)($ thousands)($ thousands)($ thousands) 2017 2016
Domestic (a)$ 36,140 $ 40,736
New Zealand 4,395 2,362
Australia 2,750 5,184
$ 43,285 $ 48,282
The aging of trade and other receivables at the reporting date was:
($ thousands)($ thousands)($ thousands)($ thousands) 2017 2016
Current - 60 days (a) $ 38,047 $ 42,344
Past due – 61-90 days 2,900 2,033
Past due – 91 to 120 days 1,242 2,796
Past due more than 120 days 1,096 1,109
$ 43,285 $ 48,282
(a) Included in the balances are receivables held for sale, as the Company was exposed to the credit risk as at December
31, 2017 (Note 7).
The Company recorded the following activity in its allowance for impairment of loans and receivables:
($ thousands)($ thousands)($ thousands)($ thousands) 2017 2016
Balance at January 1 $ 1,710 $ 1,987
Additional allowance recorded 903 316
Amounts written-off as uncollectible (1,034) (593)
Balance at December 31 $ 1,579 $ 1,710
In our industries, customers typically pay invoices within 30 to 60 days. No single outstanding customer balance
represented more than 10% of total accounts receivable.
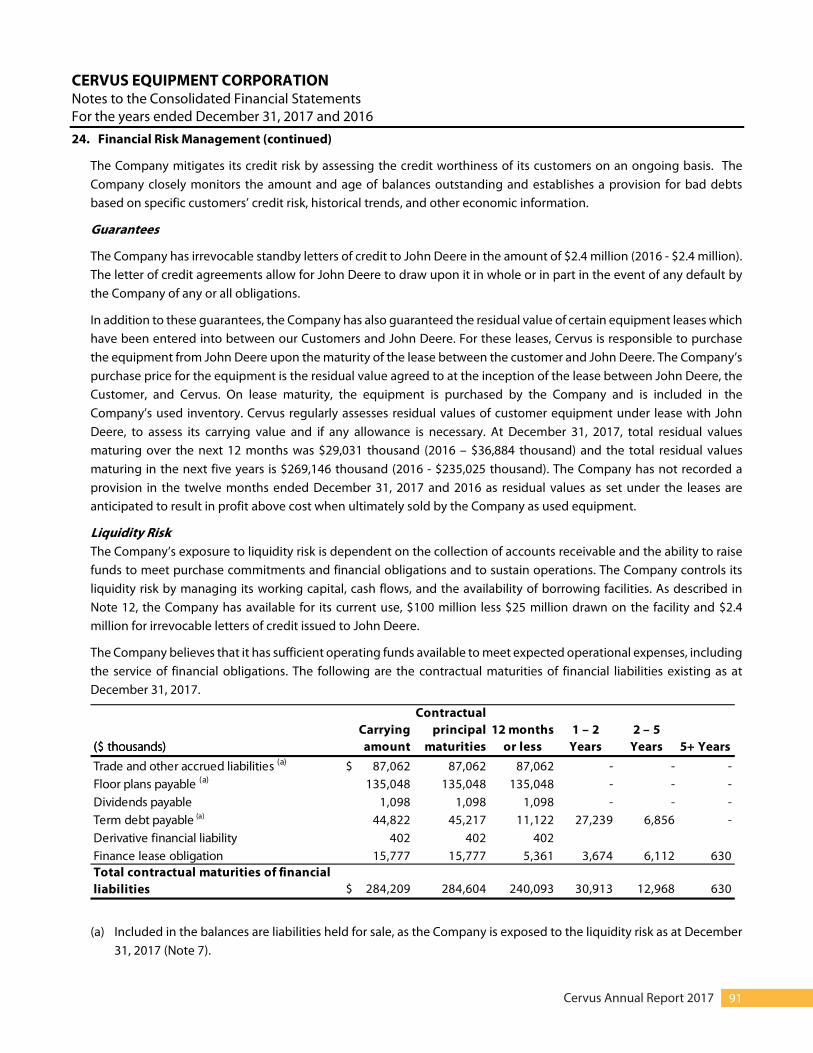
Cervus Annual Report 2017 91
CERVUS EQUIPMENT CORPORATION Notes to the Consolidated Financial Statements
For the years ended December 31, 2017 and 2016
24. Financial Risk Management (continued)
The Company mitigates its credit risk by assessing the credit worthiness of its customers on an ongoing basis. The
Company closely monitors the amount and age of balances outstanding and establishes a provision for bad debts
based on specific customers’ credit risk, historical trends, and other economic information.
Guarantees
The Company has irrevocable standby letters of credit to John Deere in the amount of $2.4 million (2016 - $2.4 million).
The letter of credit agreements allow for John Deere to draw upon it in whole or in part in the event of any default by
the Company of any or all obligations.
In addition to these guarantees, the Company has also guaranteed the residual value of certain equipment leases which
have been entered into between our Customers and John Deere. For these leases, Cervus is responsible to purchase
the equipment from John Deere upon the maturity of the lease between the customer and John Deere. The Company’s
purchase price for the equipment is the residual value agreed to at the inception of the lease between John Deere, the
Customer, and Cervus. On lease maturity, the equipment is purchased by the Company and is included in the
Company’s used inventory. Cervus regularly assesses residual values of customer equipment under lease with John
Deere, to assess its carrying value and if any allowance is necessary. At December 31, 2017, total residual values
maturing over the next 12 months was $29,031 thousand (2016 – $36,884 thousand) and the total residual values
maturing in the next five years is $269,146 thousand (2016 - $235,025 thousand). The Company has not recorded a
provision in the twelve months ended December 31, 2017 and 2016 as residual values as set under the leases are
anticipated to result in profit above cost when ultimately sold by the Company as used equipment.
Liquidity Risk
The Company’s exposure to liquidity risk is dependent on the collection of accounts receivable and the ability to raise
funds to meet purchase commitments and financial obligations and to sustain operations. The Company controls its
liquidity risk by managing its working capital, cash flows, and the availability of borrowing facilities. As described in
Note 12, the Company has available for its current use, $100 million less $25 million drawn on the facility and $2.4
million for irrevocable letters of credit issued to John Deere.
The Company believes that it has sufficient operating funds available to meet expected operational expenses, including
the service of financial obligations. The following are the contractual maturities of financial liabilities existing as at
December 31, 2017.
($ thousands)($ thousands)($ thousands)($ thousands)
Carrying
amount
Contractual
principal
maturities
12 months
or less
1 – 2
Years
2 – 5
Years 5+ Years
Trade and other accrued liabilities (a) $ 87,062 87,062 87,062 - - -
Floor plans payable (a) 135,048 135,048 135,048 - - -
Dividends payable 1,098 1,098 1,098 - - -
Term debt payable (a) 44,822 45,217 11,122 27,239 6,856 -
Derivative financial liability 402 402 402
Finance lease obligation 15,777 15,777 5,361 3,674 6,112 630
Total contractual maturities of financial
liabilities $ 284,209 284,604 240,093 30,913 12,968 630
(a) Included in the balances are liabilities held for sale, as the Company is exposed to the liquidity risk as at December
31, 2017 (Note 7).

Cervus Annual Report 2017 92
CERVUS EQUIPMENT CORPORATION Notes to the Consolidated Financial Statements
For the years ended December 31, 2017 and 2016
24. Financial Risk Management (continued)
Market Risk
Market risk is the risk that changes in the marketplace such as foreign exchange rates, interest rates and commodity prices
that will affect the Company’s income or the value of its holdings of financial instruments. The objective of market risk
management is to manage and control market risk exposures within acceptable parameters while optimizing return. The
Company’s primary approach to market risk is managing the quantity, type, and applicability of its inventory, to facilitate
regular inventory turnover in line with market demand.
Currency Risk
Many of our products, including equipment and parts, are based on a U.S. dollar price as they are supplied primarily by U.S.
manufacturers but are settled in Canadian dollars as they are received. This may cause fluctuations in the sales values
assigned to equipment and parts inventories, as inventory is recorded based on Canadian dollar cost at the time of receipt,
but is sold to the customer based on market pricing prevailing at the time of sale. Both sales revenues and gross profit
margins may fluctuate based on differences in foreign exchange rates between the purchase of inventory and sale of
inventory. Certain of the Company’s manufacturers also have programs in place to facilitate and/or reduce the effect of
foreign currency fluctuations, primarily on the Company’s new equipment inventory purchases.
Further, a portion of the Company’s owned inventory is floor planned in U.S. dollars. As such, U.S. dollar denominated floor
plan payables are exposed to fluctuations in the U.S. dollar exchange rate until the unit is sold and the floorplan is repaid.
The fluctuation in the U.S. dollar floorplan payable is recorded in unrealized gain/loss on foreign exchange within other
income. When the equipment is sold, equipment is priced based on the prevailing spot USD/CAD exchange rate at the time
of sale, plus applicable margin. In so doing, the Company’s proceeds on sale directly offset the prevailing U.S. Dollar
floorplanned cost of the equipment. If the Company was unable to recapture fluctuations in the US/CAD dollar in the sales
price for equipment floor planned in U.S. dollars, a $0.01 change in the U.S. exchange rate would have increased (decreased)
comprehensive income by $108 thousand (2016 - $80 thousand), based on the U.S. dollar floor plan balances at December
31, 2017. From time to time the Company also enters into foreign exchange forward contracts to manage exposure on
timing difference between the payout of floorplan and receipt of funds from a customer.
In addition, the Company is exposed to foreign currency fluctuation related to translation adjustments upon consolidation
of its Australian and New Zealand operations. These foreign subsidiaries report operating results in Australia and New
Zealand dollars, respectively. Movements in these currencies relative to the Canadian dollar will impact the results of these
operations upon consolidation.

Cervus Annual Report 2017 93
CERVUS EQUIPMENT CORPORATION Notes to the Consolidated Financial Statements
For the years ended December 31, 2017 and 2016
24. Financial Risk Management (continued)
Interest Rate Risk
The Company’s cash flow is exposed to changes in interest rates on its floor plan arrangements and certain term debt
which bear interest at variable rates. The cash flows required to service these financial liabilities will also fluctuate as a
result of changes in market interest rates. The Company mitigates its exposure to interest rate risk by utilizing excess
cash resources to buy-down or pay-off interest bearing contracts and by managing its floor plan payables by
maximizing interest-free periods as may be provided by Original Equipment Manufacturers (“OEM”).
Interest Bearing Financial Instruments
At the reporting dates, the Company’s interest bearing financial instruments were:
($ thousands)($ thousands)($ thousands)($ thousands) 2017 2016
Fixed Rate
Debenture payable $ - $ 33,899
Finance lease obligation 15,777 15,223
Variable Rate
Floor plan payables
Floor plan payables - interest bearing 119,426 80,980
Floor plan payables - interest free period (a)6,147 5,111
Term debt 45,217 37,772
Total interest bearing financial instruments $ 186,567 $ 172,985
(a) Various floor plan facilities include an interest free period, further certain incentives and rebates may be available to reduce
interest expense otherwise due on interest bearing portions of floor plans.
The Company does not account for any fixed rate financial assets and liabilities at fair value through profit or loss. A change
in 100 basis points in interest rates would have increased or decreased interest costs for the year ended December 31, 2017
by approximately $1,708 thousand (2016 -$1,239 thousand).
Capital Risk Management
The Company’s objective when managing its capital is to safeguard its ability to continue as a going concern, in order
to generate returns for shareholders, expand business relationships with stakeholders, and identify risk and allocate its
capital accordingly. In the management of capital, the Company considers its capital to comprise term debt, the current
portion of term debt, and all components of equity.
The Company sets the amount of capital in proportion to risk. The Company manages the capital structure and makes
adjustments to it in the light of changes in economic conditions and the risk characteristics of the underlying assets. In
order to maintain or adjust the capital structure, the Company may issue or repurchase shares, raise or retire term debt,
and/or adjust the amount of distributions paid to the shareholders.

Cervus Annual Report 2017 94
CERVUS EQUIPMENT CORPORATION Notes to the Consolidated Financial Statements
For the years ended December 31, 2017 and 2016
24. Financial Risk Management (continued)
The Company uses the following ratios in determining its appropriate capital levels:
Debt to Total Capital ratio (term debt plus current portion of term debt divided by: term debt plus current
portion of term debt plus book value of equity);
Return on Invested Capital ratio (net income before tax plus interest on term debt divided by total capital);
A debt to tangible assets ratio (calculated as total debt divided by: total assets less goodwill and intangibles);
and;
A fixed charge coverage ratio (calculated as adjusted net income divided by contractual principle, interest,
shareholder distributions, and lease payments).
There were no changes in the Company’s approach to capital management in the year. Neither the Company, nor any
of its other subsidiaries are subject to externally imposed capital requirements.
Covenant Compliance
The Company must meet certain financial covenants as part of its current Canadian syndicated credit facility, all of which
the Company was in compliance as at December 31, 2017. The covenants under the Syndicated Credit Facility are
consistent in principle with the internal ratios used by the Company in determining appropriate capital levels, however
calculations are not directly comparable, as the Company’s internal ratios are broader to consider all stakeholders, while
the Syndicate Covenants are specifically tailored by the Syndicate for their specific security position. The three core
covenants under the Syndicated Credit Facility, as contained in the Syndicated Credit agreement requires:
Maintaining a “total liabilities to tangible net worth ratio” not exceeding 4.0:1.0 calculated from adjusted total
liabilities over adjusted equity.
Maintaining a “fixed charge coverage ratio” greater to or equal to 1.10:1 for the period from March 31, 2017
onwards.
Maintaining an “asset coverage ratio” greater than 3.0:1.0.
The specific calculations of the covenants under the Syndicated lending agreement include numerous lender, and
agreement specific, non-IFRS measures. The specific calculations and defined terms thereof are available for retrieval
at www.SEDAR.ca. The Company’s compliance as at December 31, 2017 with the covenants contained in the Syndicated
Credit Agreement is set out below:
Covenant Result Covenant Result
Total Liabilities to Tangible Net Worth* Less than 4.0:1.0 2.55 Less than 4.0:1.0 1.99
Fixed Charge Coverage Ratio* Greater than 1.1:1.0 1.69 Greater than 1.0:1.0 1.43
Asset Coverage Ratio* Greater than 3.0:1.0 10.01 Greater than 3.0:1.0 21.03
As at December 31, 2017 As at December 31, 2016
* These are non-IFRS measures, stating the title of the covenant as defined in the Syndicated Credit Agreement, for
reference purposes.

Cervus Annual Report 2017 95
CERVUS EQUIPMENT CORPORATION Notes to the Consolidated Financial Statements
For the years ended December 31, 2017 and 2016
25. Segment Information
The Company operates under three segments: Agriculture, Transportation, and Commercial and Industrial based on
the industries which they serve. These segments are managed separately, and strategic decisions are made on the basis
of their respective operating results. These three business segments are described in Note 3 and are considered to be
the Company’s three strategic business units. The three business segments offer different products and services and
are managed separately as they operate in different markets and require separate strategies. For each of the strategic
business units, the Company’s key decision makers review internal management reports on a monthly basis.
Each of these business segment operations are supported by a single shared corporate head office. Certain corporate
head office expenses are allocated to the business segments under either specific identification approach or a usage
based metric. The corporate head office also incurs certain costs which are considered as public company costs, which
are allocated to the segments based on the gross margin of the Canadian operations. Total corporate related
expenditures, excluding income taxes, that have been allocated for the year ended December 31, 2017 are $4,476
thousand (2016 - $7,070 thousand).
The following is a summary of financial information for each of the reportable segments.
($ thousands)($ thousands)($ thousands)($ thousands) Total
Segmented income figures
Year ended December 31, 2017
Revenue $ 833,677 $ 293,369 $ 94,239 $ 1,221,285
Income (loss) for the year before income tax 29,479 (3,562) 3,041 28,958
Depreciation and amortization 7,029 7,852 2,707 17,588
Finance income 319 115 50 484
Finance expense including amounts in costs of sales (3,593) (3,152) (544) (7,289)
Capital additions, including finance leases 6,838 5,825 443 13,106
Segmented assets and liabilities as at December
31, 2017
Reportable segment assets $ 337,442 $ 122,687 $ 53,926 $ 514,055
Reportable segment liabilities 185,443 77,956 25,403 288,802
Intangible assets 23,673 11,867 4,202 39,742
Goodwill 15,667 2,547 666 18,880
Agricultural
Equipment
Transportation
Equipment
Commercial and
Industrial
Equipment

Cervus Annual Report 2017 96
CERVUS EQUIPMENT CORPORATION Notes to the Consolidated Financial Statements
For the years ended December 31, 2017 and 2016
25. Segment Information (continued)
($ thousands)($ thousands)($ thousands)($ thousands) Total
Segmented income figures
Year ended December 31, 2016
Revenue $ 739,029 $ 286,243 $ 84,667 $1,109,939
Income (loss) for the year before income tax 28,414 3,256 (1,104) 30,566
Share of profit of equity accounted investees 489 - - 489
Depreciation and amortization 9,318 5,445 2,971 17,734
Finance income 164 4 1 169
Finance expense including amounts in costs of sales (6,738) (4,620) (1,179) (12,537)
Capital additions, including finance leases 4,820 2,570 564 7,954
Segmented assets and liabilities as at December
31, 2016
Reportable segment assets $ 304,563 $ 120,673 $ 51,616 $ 476,852
Reportable segment liabilities 166,975 69,900 26,138 263,013
Intangible assets 26,215 13,469 6,830 46,514
Goodwill 15,804 2,547 2,193 20,544
Commercial and
Industrial
Equipment
Transportation
Equipment
Agricultural
Equipment
The Company primarily operates in Canada but includes subsidiaries in Australia (Cervus Australia Pty Ltd.) and in New
Zealand (Cervus NZ Equipment Ltd.), which together operate 15 agricultural equipment dealerships. Gross revenue and
non-current assets for the geographic territories of New Zealand and Australia were $168,398 thousand (2016 -
$157,117 thousand) and $20,431 thousand (2016 - $26,763 thousand) respectively. The Australia and New Zealand
operations are included in the Agricultural Segment.
26. Commitments and Contingencies
The Company is a defendant and plaintiff in various other legal actions that arise in the normal course of business. The
Company believes that any liabilities that might arise pertaining to such matters would not have a material effect on its
consolidated financial position.
Financing Arrangements
John Deere Credit Inc. (“Deere Credit”) and other financing companies provide financing to certain of the Company’s
customers. A portion of this financing is with recourse to the Company if the amounts are uncollectible. At December
31, 2017 payments in arrears by such customers aggregated $226 thousand (2016 - $456 thousand).
In addition, the Company is responsible for assuming all lease obligations held by its customers with Deere Credit and
other financing companies through recourse arrangements for the net residual value of the lease outstanding at the
maturity of the contract. At December 31, 2017, the net residual value of such leases aggregated $269,146 thousand
(2016- $235,025 thousand). Management believes that the potential liability in relation to the amounts outstanding is
negligible and consequently, no accrual has been made in these financial statements in relation to any potential loss
on assumed lease obligations.

Cervus Annual Report 2017 97
CERVUS EQUIPMENT CORPORATION Notes to the Consolidated Financial Statements
For the years ended December 31, 2017 and 2016
25. Segment Information (continued)
($ thousands)($ thousands)($ thousands)($ thousands) Total
Segmented income figures
Year ended December 31, 2016
Revenue $ 739,029 $ 286,243 $ 84,667 $1,109,939
Income (loss) for the year before income tax 28,414 3,256 (1,104) 30,566
Share of profit of equity accounted investees 489 - - 489
Depreciation and amortization 9,318 5,445 2,971 17,734
Finance income 164 4 1 169
Finance expense including amounts in costs of sales (6,738) (4,620) (1,179) (12,537)
Capital additions, including finance leases 4,820 2,570 564 7,954
Segmented assets and liabilities as at December
31, 2016
Reportable segment assets $ 304,563 $ 120,673 $ 51,616 $ 476,852
Reportable segment liabilities 166,975 69,900 26,138 263,013
Intangible assets 26,215 13,469 6,830 46,514
Goodwill 15,804 2,547 2,193 20,544
Commercial and
Industrial
Equipment
Transportation
Equipment
Agricultural
Equipment
The Company primarily operates in Canada but includes subsidiaries in Australia (Cervus Australia Pty Ltd.) and in New
Zealand (Cervus NZ Equipment Ltd.), which together operate 15 agricultural equipment dealerships. Gross revenue and
non-current assets for the geographic territories of New Zealand and Australia were $168,398 thousand (2016 -
$157,117 thousand) and $20,431 thousand (2016 - $26,763 thousand) respectively. The Australia and New Zealand
operations are included in the Agricultural Segment.
26. Commitments and Contingencies
The Company is a defendant and plaintiff in various other legal actions that arise in the normal course of business. The
Company believes that any liabilities that might arise pertaining to such matters would not have a material effect on its
consolidated financial position.
Financing Arrangements
John Deere Credit Inc. (“Deere Credit”) and other financing companies provide financing to certain of the Company’s
customers. A portion of this financing is with recourse to the Company if the amounts are uncollectible. At December
31, 2017 payments in arrears by such customers aggregated $226 thousand (2016 - $456 thousand).
In addition, the Company is responsible for assuming all lease obligations held by its customers with Deere Credit and
other financing companies through recourse arrangements for the net residual value of the lease outstanding at the
maturity of the contract. At December 31, 2017, the net residual value of such leases aggregated $269,146 thousand
(2016- $235,025 thousand). Management believes that the potential liability in relation to the amounts outstanding is
negligible and consequently, no accrual has been made in these financial statements in relation to any potential loss
on assumed lease obligations.

cervusequipment.com