static.cambridge.orgcambridge.org:id:...Web viewstatic.cambridge.org
104
Supplementary material Philip C. Calder, Alan Boobis, Deborah Braun, Claire L. Champ, Louise Dye, Suzanne Einöther, Arno Greyling, Christophe Matthys, Peter Putz, Suzan Wopereis, Jayne V. Woodside and Jean-Michel Antoine Improving selection of markers in nutrition research: evaluation of the criteria proposed by the ILSI Europe Marker Validation Initiative Content s Specific field and related marker: Nutritional epidemiology – vitamin C intake determined by food frequency questionnaire................................................................................. 2 Specific field and related marker: Nutritional epidemiology – serum/plasma vitamin B12 as a status marker ........................................................................................................ 4 Specific field and related marker: Immune function – use of response to vaccination as a marker of immune competence.............................................................................................. 6 Specific field and related marker: Chronic inflammation - use of C-reactive protein (CRP) concentration as a biomarker......................................................................................... 10 Specific field and related marker: Cognition – example of verbal memory measures.......................13 Specific field and related marker: Attention – example of sustained attention measures.................22 Specific field and related marker: Cardiovascular diseases/vascular function – flow mediated dilatation 25 Specific field and related marker: Cardiovascular diseases/oxidative stress– F2-isoprostanes...........33 1
Transcript of static.cambridge.orgcambridge.org:id:...Web viewstatic.cambridge.org

Supplementary material
Philip C. Calder, Alan Boobis, Deborah Braun, Claire L. Champ, Louise Dye, Suzanne Einöther, Arno Greyling, Christophe Matthys, Peter Putz, Suzan Wopereis, Jayne V. Woodside and Jean-Michel Antoine
Improving selection of markers in nutrition research: evaluation of the criteria proposed by the ILSI Europe Marker Validation Initiative
Content
s
Specific field and related marker: Nutritional epidemiology – vitamin C intake determined by food frequency questionnaire................................................2
Specific field and related marker: Nutritional epidemiology – serum/plasma vitamin B12 as a status marker.......................................................................4
Specific field and related marker: Immune function – use of response to vaccination as a marker of immune competence.....................................................6
Specific field and related marker: Chronic inflammation - use of C-reactive protein (CRP) concentration as a biomarker...................................................10
Specific field and related marker: Cognition – example of verbal memory measures........................................................................................................13
Specific field and related marker: Attention – example of sustained attention measures...................................................................................................22
Specific field and related marker: Cardiovascular diseases/vascular function – flow mediated dilatation............................................................................25
Specific field and related marker: Cardiovascular diseases/oxidative stress– F2-isoprostanes............................................................................................33
Specific field and related marker: Cardiovascular diseases – blood pressure....................................................................................................................35
Specific field and related marker: Glucose intolerance and type-2 diabetes – branched chain amino acids and their derivatives...........................................37
Specific field and related marker: Polyunsaturated fatty acid synthetic capacity – FADS1 Polymorphisms........................................................................40
Specific field and related marker: Intestinal Barrier Function (Intestinal permeability) - Lactulose/mannitol ratio urinary test.............................................42
Specific field and related marker: Energetics/Obesity - Energy expenditure: Doubly labelled water..................................................................................45
Reference List...........................................................................................................................................................................................................49
1

2

Specific field and related marker: Nutritional epidemiology – vitamin C intake determined by food frequency questionnaire
Criteria to evaluate markers Comments1) Analytical aspects
i. Method should be validated according to recognised guidelines.
ii. This should include for example: robustness, appropriate analytical sensitivity and specificity, reproducibility, accuracy, quality assurance, standardisation, traceability, stability (quality of the sample), analytical variation, biological variation. (These guidelines can be specific per marker; it applies equally well to biological markers, imaging, questionnaires, etc.)
Food frequency questionnaires (FFQs) are designed to assess habitual diet by asking about the frequency with which food items or specific food groups are consumed over a reference period (e.g. 6 months or a year). FFQs may be based on an extensive list of food items or a relatively short list of specific foods. The foods listed should be a) major sources of a group of nutrients of particular interest or b) foods which contribute to the variability in intake between individuals in the population, and c) commonly consumed in the study population. The number of foods listed can frequently range from about 20 to 200. Questionnaires can be self-administered using paper or web-based formats, or interviewer administered, either face-to-face or by telephone. The frequency of food consumption is assessed by a multiple response grid in which respondents are asked to estimate how often a particular food or beverage is consumed. Categories ranging from ‘never’ or ‘less than once a month’ to ‘6+ per day’ are used and participants have to choose one of these options. If nutrient intakes are to be estimated from FFQs, as for the vitamin C example here, an ‘average’ portion size is ascribed, and frequencies used to calculate a usual daily intake of each food. Then, using food composition databases (e.g. McCance and Widdowson’s The Composition of Foods), which contain the nutrient composition of a range of foods, intake of the nutrient, in this example, vitamin C can be calculated. The analysis of FFQs can be undertaken using specialist nutritional software linked to these food composition databases.
FFQs have been used widely in epidemiological studies investigating links between diet and disease. For this purpose it is more important to rank the intake of individuals relative to others in the population (e.g. high, medium, or low intake) or as quantiles (e.g. fifths of the distribution of intake) than to determine the absolute intake. Two well-known FFQs are the Harvard or Willett questionnaire(1) and the Block questionnaire(2). These are both American FFQs – the most widely used in the UK is the European Prospective Investigation of Cancer (EPIC)-Norfolk FFQ(3). Since FFQs are often designed to assess the ranking of intakes within a population, they cannot be assumed to produce reliable estimates of absolute intake. Over-estimation is common, particularly for foods eaten less often or for foods perceived as 'healthy', such as fruit and vegetables. There is some evidence that over-estimation increases with the length of the food list (4). Realisation of the error associated with dietary intake measures has led to a host of validation studies, which are normally sub-samples of larger cohorts, where dietary intake tools are correlated either with other dietary assessment methods which are considered more methodologically sound (e.g. weighed intakes or food diaries) or with biomarkers so that errors can be assessed and accounted for (e.g. (Brunner et al., 2001(5); McKeown et al., 2001(6)). For the EPIC-Norfolk FFQ, and specifically in terms of vitamin C, comparison of estimated vitamin C intake (expressed as mg/d) with plasma vitamin C concentration (expressed as µmol/l) showed that the two were weakly associated (r=0.28) (7). In a
3

separate validation that also included weighed records (i.e. food consumed), similar associations were observed (r=0.21-0.35)(8)). Guidelines on the development of new FFQs, the adaptation of previously used FFQs and on designing and interpreting validation studies exist(9).
2) Reflect/mark an endpointi. Significant association between marker
and endpoint in a target population ii. Marker changes consistently with a
change in the endpoint
The associations observed between estimated vitamin C intake (using the EPIC Norfolk FFQ) and plasma vitamin C status are described above.As FFQs are completed retrospectively and ask about usual intake in the last six months to one year, they will be relatively insensitive to short-term dietary change, and, for interventions where a change in vitamin C is expected, a more robust method of assessing dietary vitamin C intake, e.g. 7 day food diary, and/or measurement of plasma vitamin C, would be more sensitive.
Although not directly relevant to interventions, the impact of the use of different dietary assessment methods on associations with disease risk was studied in a subset of the EPIC cohort, examining 12,474 men and women aged 35-75 y from the Norfolk centre in the UK (10). FFQs were collected alongside a 7 day food diary and, when these intake measures were correlated with a number of biomarkers, the diary provided a better indication of intake than the FFQ. Additionally, the risk of ischemic heart disease (IHD) was inversely associated with plasma vitamin C and intake of vitamin C as assessed by the 7 day food diary but not by FFQ (10). Such observations reveal the weakness of using a FFQ alone to measure dietary intake.
3) Must respond to a dietary intervention i. What is considered as a normal range for
healthy people (might vary for different applications e.g. epidemiological studies vs. individual level)
ii. Any dietary intervention should induce a meaningful change in the marker (meaningful refers to 2.ii )
iii. Lifestyle changes (which may include changes in the diet) may also include a meaningful (meaningful refers to 2.ii ) change in the marker
i A FFQ is used to rank individuals according to intake rather than provide absolute levels of intake (see section 1), therefore normal ranges of vitamin C intake from a FFQ are not reliable.
ii The sensitivity of a FFQ to pick up a change in intake of vitamin C is described above (section 2).
iii Vitamin C intake will differ by socioeconomic status (Novakovic et al., 2014). Smoking and body mass index may also affect vitamin C absorption and metabolism and therefore status (11). Such factors should be considered when validating any FFQ.
Remarks for the discussioni. Are there experimental data were the
intervention has not resulted in a significant change?
ii. What were expected changes in the power calculations of clinical trials?
iii. others
See section 2; FFQs are insensitive to pick up dietary change and are not a suitable tool.
Conclusions FFQs are dietary assessment tools capable of ranking individuals in terms of vitamin C intake, but are not appropriate for measuring absolute vitamin C intake and may not be sensitive enough to monitor changes in
4

vitamin C intake over the course of a dietary intervention.
Specific field and related marker: Nutritional epidemiology – serum/plasma vitamin B12 as a status marker
Criteria Identified at the workshop Comments1) Analytical aspects
i. Method should be validated according to recognised guidelines.
ii. This should include for example: robustness, appropriate analytical sensitivity and specificity, reproducibility accuracy, quality assurance, standardization, traceability, stability (quality of the sample). These guidelines can be specific per marker, it apply equally well to biological markers, imaging, questionnaires, etc.
Although serum (or plasma) vitamin B12 concentration is the most frequently used biomarker of vitamin B12 status and for screening for vitamin B12 deficiency, it is generally accepted that it does not necessarily reflect bodily vitamin B12 status(12). This is because serum concentration may be maintained whilst stores become increasingly depleted. Microbial and photochemical assays have been used to determine vitamin B12 concentration in the past. Nowadays different analytical techniques have been proposed to measure vitamin B12 concentration for both clinical practice and nutritional/pharmacological studies/investigations. These tests refer to electroluminescence, inductively-coupled plasma (ICP) - mass spectrometry (MS) (ICP-MS), atomic absorption spectroscopy, radioimmunoassay, radio dilution assays using pure intrinsic factor as the binding protein and high-performance liquid chromatography (HPLC). Each of these tests has advantages and disadvantages (13). Recently the sensitivity and specificity of the different assays has been discussed(14-16). It is clear that the current assays are characterised by both false negative and false positive values (occurring in up to 50% of tests) when using the laboratory-reported lower limit of the normal range as a cut-off point for deficiency (16). The high number of both false negative and false positive results could be explained by the fact that only 20% of the total measured vitamin B12 is carried on the cellular delivery protein, transcobalamin. In clinical settings, the majority of the laboratories use automated assays of vitamin B12 on platforms, also used for many other analytes. Comparison studies have shown that there is often poor agreement when samples are assayed by different laboratories or with the use of different methods (16). The reason of this poor agreement is that intrinsic factor is used as the assay-binding protein, therefore anti–intrinsic factor antibodies need to be removed chemically from the sample and this seems to be problematic in the automated assays(16). As mentioned before, serum vitamin B12 concentrations are directly altered by the concentrations of the binding proteins. Multiple groups have published on the limitations of serum vitamin B12 measurements(17-22).
2) Reflect/mark an endpointi. Significant association between
marker and endpoint in a target population
ii. Marker changes consistently with a change in the endpoint
Serum/plasma total vitamin B12 concentrations are the most widely used biomarker of vitamin B12 status, but there is currently discussion regarding cut-off values for deficiency. Cut-off values that are currently used are: < 150 pmol/L (< 200 pg/mL) for deficiency, and 150–221 pmol/L (200–300 pg/mL) for depletion(23).
Due to the high number of false positive and false negative values, serum vitamin B12 concentration does not reliably identify deficiency. Based on observational studies, there is evidence to suggest that low vitamin B12 status is associated with an increased risk of chronic diseases of ageing including CVD, dementia, cognitive impairment and osteoporosis and that optimal vitamin B12 status is important for healthy ageing but there is no confirmation from randomized clinical trials(24).
5
3) Must respond to a dietary intervention i. Any dietary intervention should induce a
meaningful change in the marker (meaningful refers to 2.ii )
ii. Lifestyle changes (which may include changes in the diet) may also include a meaningful (meaningful refers to 2.ii) change in the marker
A systematic review(25) confirmed that serum/plasma total vitamin B12 increased significantly in response to intervention with both low and pharmacological doses of vitamin B12 over supplementation periods of at least four weeks, in individuals with low/borderline status. However, it was noted that the response varied considerably between studies. Elderly individuals (> 70 years) and other adults were the only age groups where sufficient data were available to claim that serum/plasma total B12 accurately reflects a change in intake. According to Hoey et al.(25), only one study was conducted in children and adolescents and therefore the authors decided that there is insufficient data to decide on the usefulness of the biomarker.
Conclusions Serum/plasma vitamin B12 concentration is a marker for vitamin B12 status. Cut-off values for deficiency are described but serum/plasma vitamin B12 measurement may not reliably detect deficiency mainly because of technical issues with the assays. Serum/plasma vitamin B12 concentration increases with increased intake in persons starting with low status.
6

Specific field and related marker: Immune function – use of response to vaccination as a marker of immune competence
Criteria to evaluate markers Comments1) Analytical aspects
i. Method should be validated according to recognised guidelines.
ii. This should include for example: robustness, appropriate analytical sensitivity and specificity, reproducibility, accuracy, quality assurance, standardisation, traceability, stability (quality of the sample), analytical variation, biological variation (these guidelines can be specific per marker; it applies equally well to biological markers, imaging, questionnaires, etc.)
Vaccination is a means of exposing the immune system to one or more antigens in a standardised and controlled manner. In response to vaccination, the host mounts an immune reaction that culminates in the production of anti-vaccine antibodies. The use of vaccination in an experimental setting (e.g. in a study of a nutritional intervention) involves vaccinating a participant (usually intramuscularly) with a commercial clinically used vaccine (e.g. influenza, tetanus, pneumococcus,) and obtaining blood samples at specific time points thereafter. Anti-vaccine antibodies are measured in serum or plasma prepared from the blood (26). The serum/plasma needs to be stored frozen (minus 80°C) until antibodies are measured. Accredited laboratories can be used to measure responses to some vaccines (e.g. WHO accredited laboratories for anti-influenza vaccine antibodies). Such laboratories use validated methodology that is recognised by WHO and other authorities. This may not be the case for all anti-vaccine antibody measurements. Where there is an accredited laboratory many of the analytical aspects are of the highest quality. For some vaccines there are definitions of seroprotection and seroconversion, although these definitions can differ between countries. Seroprotection means that the individual has a high probability of being protected and it is defined as having an antibody titre (level) above a particular threshold. For seasonal influenza vaccination, seroprotection is defined as having an antibody level of 40 haemagglutination units/ml or higher, while for diphtheria and tetanus it is defined as having an antibody level of 0.1 IU/ml or higher. Seroconversion is commonly defined as having at least a 4-fold increase in antibody levels following vaccination. Discussions of the relation between seroprotection, seroconversion and clinical protection may be found in the literature (27). Note that an individual can show seroconversion but still not be seroprotected and that, conversely, reaching the threshold for seroprotection may require less than a 4-fold increase in antibody levels (i.e. may not require seroconversion). Within a population there is substantial variation in the antibody response to many vaccines. The tables below show unpublished data (AL Lomax & PC Calder) from a study of 43 healthy humans aged 40 to 65 years vaccinated with the 2008/2009 seasonal influenza vaccine. The data are based upon serum antibody titres 4 weeks post-vaccination. The seasonal influenza vaccine contains subunits of three different viral strains so that three separate antibody responses are measured.
7

Table S1. Percentage of subjects who seroconverted and became seroprotected from a study of 43 healthy humans aged 40 to 65 years vaccinated with the 2008/2009 seasonal influenza vaccine (unpublished data)
Viral antigen type
% of subjects who seroconverted
% of subjects who became seroprotected
Antibody tite (IU/mL)
Lowest Median HighestHAH1 79.1 72.1 5 80 15360HAH3 79.1 81.4 5 320 20480HAB 59.1 60.4 5 60 960
% who seroprotected % who seroconvertedTo none of the viral antigens
To only one of the viral antigens
To any two of the viral antigens
To all three of the viral antigens
To none of the viral antigens
To only one of the viral antigens
To any two of the viral antigens
To all three of the viral antigens
4.7 18.6 34.9 41.9 2.3 20.9 34.8 41.9
These data show large variations in antibody response between individuals (i.e. within a population) and also that there is variation in response to several antigens administered together within an individual. The ability of vaccinations to initiate a robust host immune response, and so to produce clinical protection, is recognised to be poorer in the elderly (see below), the frail, the malnourished and those with certain chronic diseases. For clinical protection against some diseases the same vaccine can be used unchanged over many years. However because of the rapid mutation rate of seasonal influenza viruses, the exact make-up of the seasonal influenza vaccine changes from year to year. The three stains that have been used in the vaccine over the years may be found on many websites (e.g. http://www.who.int/influenza/vaccines/virus/recommendations/en/). Some vaccinations (e.g. polio) give life-long protection, others (e.g. tetanus) give shorter protection.For a primary antibody response, the subject cannot have received the same vaccine previously. Administration of a vaccine to a person who has received it already can induce a secondary antibody response, which may be different in kinetics and vigour from the primary response. Responses to vaccination may be modified by many factors including age and health status. For example, the success of seasonal influenza vaccine is much less in people aged over 65 years than in middle aged adults (28,29). For example, Goodwin et al. (2006)(29) noted that in young healthy adults the seasonal influenza vaccine provides a protective clinical efficacy in 70 to 90% of cases, which is reduced to only 17 to 53% in elderly individuals. This reflects a general decline in cell-mediated immunity that occurs, to varying extents, with ageing; this is termed
8
immunosenescence(30,31).
2) Reflect/mark an endpointi. Significant association between marker
and endpoint in a target population ii. Marker changes consistently with a
change in the endpoint
The production of antibodies in response to vaccination represents an integrated read-out of the immune response – it will have required the activity of antigen processing and presenting cells, T cells and B cells. It is considered to be superior to any individual laboratory-based immune marker (32,33) and is one of the few immune biomarkers considered to be of high value in human nutrition studies.Response to vaccination can be defined by seroprotection and seroconversion (described in the previous section) and is considered to be related to clinical outcome (i.e. protection from the infective agent), although this can be poorly defined. For seasonal influenza vaccination seroprotection and seroconversion thresholds are defined by WHO (see previous section) – in clinical practice these are often not met (e.g. in the elderly) but neither the clinician nor the patient is aware of this. Such a failure may allow susceptibility to the infectious agent, so in this sense a poor response can increase risk of poor clinical outcome (i.e. infection and its severity) while a good response can decrease risk of poor clinical outcome (i.e. infection and its severity).
3) Must respond to a dietary intervention i. Any dietary intervention should induce a
meaningful change in the marker (meaningful refers to 2.ii )
ii. Lifestyle changes (which may include changes in the diet) may also include a meaningful (meaningful refers to 2.ii ) change in the marker
Response to vaccination may be used in epidemiology studies to investigate the association between the immune response and a future clinical outcome (prospective study) or between the intake of foods or nutrients and the immune response (cross-sectional study) or in intervention trials of dietary or nutrient modifications. The response to vaccination, based upon antibody titres measured at an appropriate time point after vaccination, may be represented in several different ways: antibody titre concentrations; change in antibody titre concentrations from the pre-vaccinated state; fold change in antibody titre concentrations from the pre-vaccinated state; % of individuals seroprotected; % of individuals seroconverted; % of individuals seroconverted and seroprotected (see previous section). Each of these may be a valid marker of immune response, although the clinical meaning of the outcomes may be different. For example, in a controlled trial it is possible that no subjects seroconvert or become seroprotected but that there is still a statistically significant effect of an intervention on antibody titres compared with a control group. Conversely, it is possible that all subjects in a study seroconvert and become seroprotected but that there is still a statistically significant effect of an intervention on antibody titres compared with a control group. In both of these scenarios it might be interpreted that there is an improvement in immune response, although the clinical meaning of this improvement may be different.
Some studies have shown improved response to vaccination with a dietary intervention, while others have not. Studies involving prebiotics and response to vaccination were included in the review by Lomax and Calder (2009)(34), while studies of probiotics were reviewed by Lomax and Calder (2009)(35) and by Maidens et al. (2013)(36). Examples of studies where improvements in response to seasonal influenza vaccination have been demonstrated include Boge et al. (2009)(37). Langkamp-Henken et al. (2006)(38) and Langkamp-Henken et al. (2004)(39). Boge et al. (2009)(37) reported two controlled studies of oral Lactobacillus casei DN-114 001 administration for 7 weeks (study 1) and 13 weeks (study 2) in elderly subjects (> 70 years of age; mean age ~ 84 years) who received the seasonal influenza vaccine after 4 weeks. Study 1 used the 2005/2006 seasonal influenza vaccine and identified 40 to 50% seroprotection and 20 to 50% seroconversion (depending upon viral strain) in the control group 3 weeks post-vaccination, in keeping with the relatively poor response to vaccination in the elderly. This
9

study, which involved approx. 40 subjects per group (i.e. control and L. casei), showed non-significant trends towards higher antibody titres and increased seroprotection and seroconversion with L. casei. Study 2 was larger (~110 subjects in each group) and measured antibody titres 3, 6 and 9 weeks post-vaccination with the 2006/2007 vaccine. The study revealed higher antibody titres to all 3 vaccine strains at all 3 post-vaccination time points, although these were significant only for antibodies against the B strain (at all 3 time points); typically antibody titres were 60 HIU/ml in the control group and 100 in the L. casei group. Seroconversion to the B strain was low in the control group (~10% at 3 weeks) but was significantly increased by L. casei at all times points assessed (~20% at 3 weeks). Seroconversion at 5 months post-vaccination was higher to the B strain (~7% vs ~2%) and to the H3N2 strain (~20% vs ~10%) with L. casei. Langkamp-Henken et al. (2004)(39) reported a controlled study of 26 weeks administration of an oral nutritional formula providing vitamins E and C, beta-carotene, B vitamins, Se, Zn, structured triglyceride and the prebiotic fructooligosaccharide. Subjects were older adults (> 65 years; mean age ~ 82 years) who received the 1999/2000 seasonal influenza vaccine after 2 weeks. Antibody titres to the H3N2 and B strains were not different between groups at 6 weeks or 24 weeks post-vaccination. In contrast, 6 weeks post vaccination antibody titres to the H1N1 strain were significantly higher in the formula group (~200 vs ~100). Seroprotection to each of the three viral strains was not different between groups at 6 weeks post-vaccination. Seroconversion to the H1N1 strain was higher in the formula group (87% vs 41%) but there was no difference between groups in seroconversion to the H3N2 or B strains. In the formula group 87% of subjects seroconverted and seroprotected to the H1N1 strain which was significantly higher than in the control group (35%). This study also reported cold and influenza symptoms over the study period: days with symptoms per subject were lower in the formula group (median 0 vs 3).
Langkamp-Henken et al. (2006)(38) report a controlled study of 10 weeks administration of the same oral nutritional formula in older adults (> 65 years; mean age ~ 85 years) who received the 2002/2003 seasonal influenza vaccine after 4 weeks. The study identified ~45% seroconversion to the H1N1 strain and ~35% to the H3N2 strain with no effect of the nutritional formula. Seroconversion to the B strain was ~50% in the control group and 64% in the formula group (P = 0.09). Seroprotection to the H1N1 strain was higher in the formula group (44% vs 29%), and tended to be higher to the H3N2 strain (97% vs 89%) but wasn’t different to the B strain (95% vs 94%). Antibody titres to any strain were not different between groups.
Conclusions Response to vaccination, assessed as anti-vaccine antibodies in serum or plasma, can be used as a biomarker of immune function in both epidemiological and intervention studies. However, there is high variability in response between subjects.
10

Specific field and related marker: Chronic inflammation - use of C-reactive protein (CRP) concentration as a biomarker
Criteria Identified at the workshop Comments1) Analytical aspects
i. Method should be validated according to recognised guidelines.
ii. This should include for example: robustness, appropriate analytical sensitivity and specificity, reproducibility accuracy, quality assurance, standardization, traceability, stability (quality of the sample). These guidelines can be specific per marker, it apply equally well to biological markers, imaging, questionnaires, etc.
C-reactive protein (CRP) is an acute phase protein produced by the liver in response to elevated inflammation (in particular an elevated blood concentration of the cytokine interleukin-6). CRP is usually measured in serum (but may also be measured in plasma). The serum can be assayed fresh or can be stored at room temperature for a short period of time or frozen (minus 80°C) for longer. CRP may be measured by various immunoassays. These often have different sensitivities. In many hospital settings the assays are performed using a standardised assay approved by regulatory bodies and technique(40), thus meeting requirements for reproducibility, accuracy, quality assurance and standardization. However where these, or other assays for CRP, are used in research laboratories these requirements may not be met. People often refer to “high sensitivity CRP”. This is simply CRP measured with a high sensitivity assay (i.e. the analyte for a CRP assay and for a high sensitivity CRP assay is the same). Such high sensitivity assays are required because CRP concentrations are typically low in people without infection, acute inflammation or a chronic high grade inflammation. In healthy people or those with chronic low grade inflammation, a high sensitivity assay kit is typically needed. For conventional CRP assays, test values are typically considered to be clinically significant, in terms of infection or high grade inflammation, at levels above 10 mg/L(40).
2) Reflect/mark an endpointi. Significant association between marker and
endpoint in a target population ii. Marker changes consistently with a change
in the endpoint
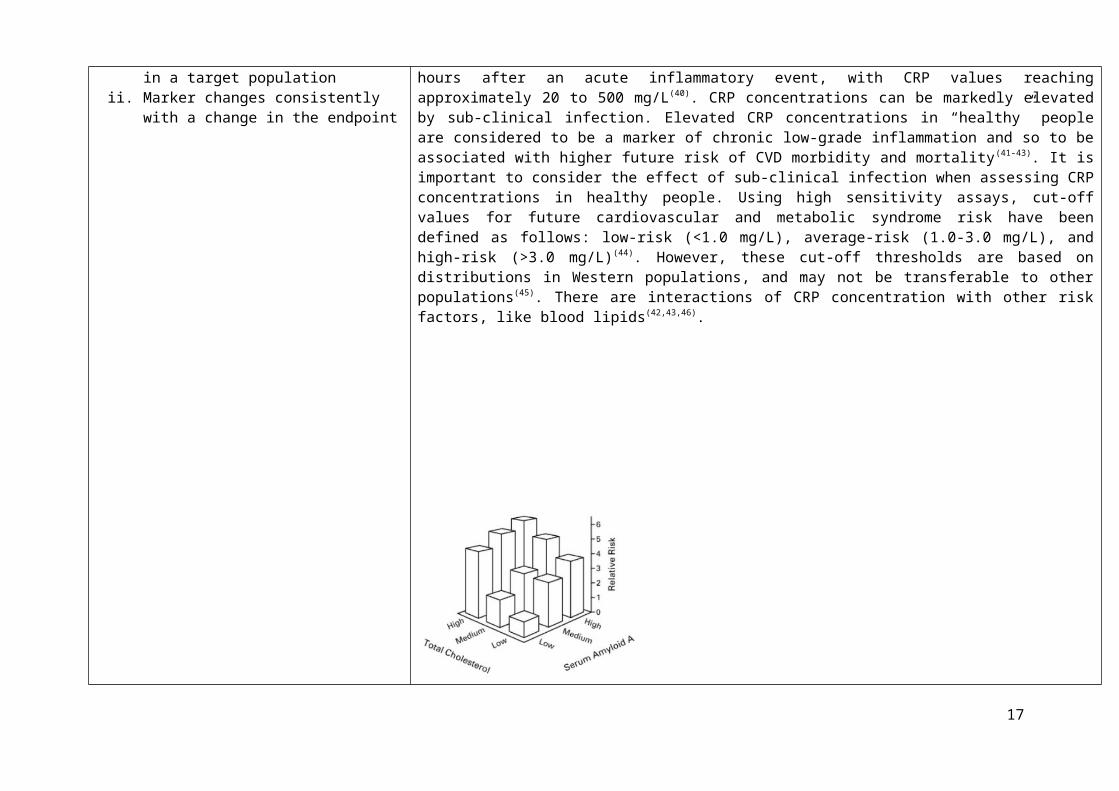
In apparently healthy people blood CRP levels are below 5 mg/L, although this could be above the cut-off for increased disease risk (see below), while in various conditions this threshold is often exceeded within four to eight hours after an acute inflammatory event, with CRP values reaching approximately 20 to 500 mg/L (40). CRP concentrations can be markedly elevated by sub-clinical infection. Elevated CRP concentrations in “healthy” people are considered to be a marker of chronic low-grade inflammation and so to be associated with higher future risk of CVD morbidity and mortality(41-43). It is important to consider the effect of sub-clinical infection when assessing CRP concentrations in healthy people. Using high sensitivity assays, cut-off values for future cardiovascular and metabolic syndrome risk have been defined as follows: low-risk (<1.0 mg/L), average-risk (1.0-3.0 mg/L), and high-risk (>3.0 mg/L)(44). However, these cut-off thresholds are based on distributions in Western populations, and may not be transferable to other populations (45). There are interactions of CRP concentration with other risk factors, like blood lipids(42,43,46).
11

Fig. S1. Interactions of CRP concentrations with other risk factors (with permission to use from N Engl J Med 2000; 342:836-43 and Clin Chem 47: 403-411)
Despite exhibiting consistent associations with risk of CVD events, the ability of CRP to discriminate individuals who will suffer events is extremely modest and similar to blood pressure or cholesterol values on their own, so therefore CRP is not currently included in cardiovascular risk prediction models(47,48).
CRP concentrations increase with age(49) and are predictive of mortality in elderly persons(50,51). CRP concentrations are elevated in obesity(52,53). However there is significant between-individual variation (at least 10-fold) among non-obese and obese individuals and there is a substantial overlap in concentration between non-obese and obese
12

persons. However, there is a positive relationship between body mass index and other measures of obesity such as waist circumference and circulating concentration of CRP(54). Weight loss through lifestyle change (and also through surgery) has been reported to result in lower CRP concentrations (55-58). Physical training also lowered CRP in some studies(59,60). Typical reductions in CRP reported through weight loss are 10 to 50%; in general the greater the weight loss and the longer the duration, the greater the reduction in CRP. Also there is some evidence from weight loss studies that those with a higher starting CRP concentration show a greater decrease.
3) Must respond to a dietary intervention i. Any dietary intervention should induce a
meaningful change in the marker (meaningful refers to 2.ii )
ii. Lifestyle changes (which may include changes in the diet) may also include a meaningful (meaningful refers to 2.ii ) change in the marker
CRP concentrations may be (and have been) used in epidemiology studies to investigate the association between inflammation and a future clinical outcome (prospective study) or between the intake of foods or nutrients and inflammation (cross-sectional study) or in intervention trials of dietary or nutrient or other lifestyle modifications. As indicated above studies have shown that weight loss through lifestyle change (mainly caloric restriction) can lower CRP concentrations(55-58). Physical training also lowered CRP in some studies(59,60).
Calder et al. (2011)(54) comprehensively reviewed the literature on dietary/food patterns, foods and nutrients in relation in CRP concentration, including data from both epidemiological and intervention studies; they identified many hundreds of studies on this topic. Many studies show associations between dietary/food patterns, certain foods and specific nutrients and CRP concentration, which are retained with adjustment for confounders. CRP concentrations are shown to be lower with increasing adherence to the Mediterranean diet, with a higher healthy eating index, and with greater adherence to a prudent diet and to be higher with greater adherence to a Western-style diet(54). In general, the associations reported in these studies are graded. Foods with inverse associations with CRP concentration include whole grains, fruit and vegetables, and fish while nutrients with inverse associations include fibre, marine omega-3 fatty acids and antioxidant vitamins (vitamin C, vitamin E, carotenoids) (54). Diets with higher glycaemic load or glycaemic index have been associated with higher CRP concentrations (54). Intervention studies with foods or nutrients tend to be less consistent in their findings than the association studies. However there is quite good evidence from intervention studies that whole grains, fibre, fruit and vegetables, low glycaemic load, marine omega-3 fatty acids and some plant polyphenols lower CRP concentrations(54).
Conclusions CRP can be measured using commercially available kits as a marker of inflammation. In the absence of infection or an acute of chronic condition, CRP levels are low, but within this low range there is an association between CRP and increased future risk of cardiovascular disease morbidity and mortality. There is interaction between CRP and other risk factors.
13

Specific field and related marker: Cognition – example of verbal memory measures
Criteria Identified at the workshop Comments1) Analytical aspects
i. Method should be validated according to recognised guidelines.
ii. This should include for example: robustness, appropriate analytical sensitivity and specificity, reproducibility accuracy, quality assurance, standardization, traceability, stability (quality of the sample). These guidelines can be specific per marker, it apply equally well to biological markers, imaging, questionnaires, etc.
Verbal memory is widely used as a measure of cognitive function. Consideration of it as a marker or endpoint raises issues which are common to many other cognitive tests used in nutritional interventions. Measures of verbal memory may involve participants memorising word lists (e.g. Rey Auditory Verbal Learning test, RAVLT(61)), a paragraph or a short story (e.g. Wechsler Memory Scale – Fourth Edition, WMS-IV(62)). Word list items can either be associated by categories e.g. lists of animals or items of clothing, or have no relationship to other items. Paragraph or story recall requires recall of key points of a story or a paragraph of prose (e.g. Rivermead Behavioural Memory Test – Third Edition, RBMT-3(63)). Performance for story or paragraph recall tends to be better than recall of unrelated word lists since the relational aspects of the stimulus material allow for better encoding and recall(64)). Cued recall tasks represent another variant of verbal memory performance in which recall is made in response to a specific cue (e.g. previously paired word or semantic cue). Recall can be elicited immediately after presentation or with varying delay (delayed recall) ranging from 30 min to many days or longer, sometimes years as in the case of the Mini Mental State Examination (MMSE(65)) used to screen for dementia by asking questions such what year did the second world war begin or who is the current Prime Minister. The MMSE is prone to ceiling effects even in samples of older adults(66). Delayed recognition is a further variant in which previously presented items must be identified from a list of distractor items which have not previously been seen. Administration can be via computer or paper and pencil, with stimulus material to be remembered presented visually or aurally and responses given verbally (into a digital recorder or marked by a researcher) or by the participant writing the words on paper (NB this engages slightly different cognitive processes than verbal recall).
There are various measures of verbal memory available e.g. commonly used measures include RAVLT, California Verbal Learning test (CVLT(67)) and many variants of these (see Table below). These standardised measures have similar administration i.e. 5 learning trials (immediate recall of each to show rate of learning over successive trials), presentation of an interference list which is recalled in some verbal learning tests but not others and delayed recall and recognition trials post interference list presentation so that the impact of the interference list on original list recall can be evaluated. Standardisation of lists includes for example, matching word lists for imagery, concreteness and frequency of occurrence in the language in question and sometimes matching on length and number of syllables included in the list. However, the word lists on the CVLT are
14

categorically related and participants are expected to identify and use this to aid recall. Crucially both measures provide scores in a range of areas such as number of items correctly recalled and recognised, number of intrusions and repetitions, recall discriminability and proactive (intrusions of previous list items in recall of newly presented list items) and retroactive (intrusions of more recent list items in recall of previously presented list items) interference. This allows for a comprehensive assessment to be made, revealing the severity of impairments in verbal memory, if present, by referring to test norms and the effect of any intervention. Some measures have equivalents, which are designed specifically for certain age ranges. For example, the Rivermead Behavioural Memory Test for children (RBMT-C(68)) is a measure of memory that is normed for ages 5-10 years, which has a subtest of verbal memory ability involving the immediate recall of up to 31 key points from a story. Tests of verbal memory may vary in qualities such as word frequency, concreteness, imagery, age of acquisition of the stimulus words between tests and also between parallel versions of the same test, which can affect performance and lead to inequalities between parallel versions. Counterbalancing of versions is therefore also important. The Rey has high reliability (0.8,(69)).Performance on verbal memory tests is correlated with level of education, IQ (positive relationship between level of education/IQ and performance(70,70,71)), gender (females perform better than males) and age (tends to decline with age)(72). Test retest reliability for most tests is good but tests can be vulnerable to practice effects or the development of strategies to aid recall in some subjects (possibly related to education or IQ). Many tests were not developed with the intention of examining changes in performance in response to dietary intervention but to classify groups of individuals and many tests are therefore likely to show substantial stability.Importantly, performance could be a marker of learning or cognitive decline in which case these and not verbal memory are the endpoint. Normally the marker is performance on the test.
2) Reflect/mark an endpointi. Significant association between marker and endpoint
in a target population ii. Marker changes consistently with a change in the
endpoint
Verbal memory performance may be reflective of cognitive decline, either age related or disease induced (i.e. dementia, amnesic-MCI, stroke). Powell et al. (2006)(73) demonstrated that performance in a test of verbal memory predicted development of Alzheimer’s Disease 22 years later in the Framingham study. Each standard deviation difference in baseline performance increased risk of AD by 60% (relative risk 1.57 95% CI: 1.31-1.87). Verbal memory could be a marker of memory capacity in cognitive decline, which might also decrease with age but the trajectory or extent of the decline could be a useful outcome. Using data from about 10,000 participants in the Whitehall II study in the UK, Singh-Manoux et al. (2012)(66) reported a 3% change over 10 years in memory performance in men aged 45 years at baseline after adjusting for education, whilst a 2.5% decline was shown in women of the same age at baseline. Age related changes in interference may be larger than for verbal recall(74) but there is little confirmatory data available. Verbal memory may be a marker of
15

another outcome or an outcome in itself. Change in performance should be consistent over age in a normal population in the absence of pathology. Verbal memory could be a marker of learning capacity in children (which might also still increase with age up to adulthood as vocabulary capacity also develops(75)).
Measures of verbal memory are threshold or of interval scale of measurement e.g. a change from 9 words to 10 or a decline from 10 to 9 is still in the high functioning range and different from a decline from 5 words to 4 which would indicate below normal function. A verbal memory capacity of 7+/-2 items is considered normal memory capacity(76) – although this can be increased with education/IQ and adoption of learning strategies.
3) Must respond to a dietary intervention i. Any dietary intervention should induce a meaningful
change in the marker (meaningful refers to 2.ii )ii. Lifestyle changes (which may include changes in the
diet) may also include a meaningful (meaningful refers to 2.ii ) change in the marker
In most studies verbal memory is the endpoint rather than a marker of some other cognitive outcome such as dementia or cognitive decline. The available evidence suggests that verbal memory performance can be influenced by dietary intervention. Various verbal memory measures employed in dietary intervention studies of polyphenols, omega 3 fatty acids and B Vitamins are shown in the Table below. For example, there is evidence for a beneficial effect of phytoestrogens in menopausal women(77). Verbal memory enhancement by glucose has been demonstrated; for example Foster, Lidder and Sünram (1998)(78) found a significant glucose facilitation effect upon performance of long-term verbal free and cued recall tasks which correlated significantly with blood glucose levels. However short-term verbal memory (forwards/backwards digit recall) and long-term non-verbal memory (complex figure reproduction) were not affected suggesting that the effects of glucose on verbal memory relate specifically to glucose function in the hippocampus. Dietary carbohydrates (potatoes and barley) enhanced cognition in subjects with poor memories or beta cell function independently of plasma glucose(79). In some situations, verbal memory can be a marker for cognitive impairment and is related to glucose regulation such that poorer glucoregulation results in impaired verbal memory. In support of this, glucoregulatory indices calculated on the basis of evoked glucose levels have been found to be significantly associated with cognitive performance on the Logical Memory subtest from the Wechsler Memory Scales-III and a test of verbal free recall. Mostly effect sizes are small (less than seen in dementia vs controls) and it can be difficult to relate changes in verbal memory induced by dietary intervention to those seen with years of ageing. Lifestyle changes e.g. weight loss leading to improved glucose regulation, reduced blood pressure etc. have been shown to improve measures of verbal memory(80) but again effects are small.
4) Conclusions Verbal memory fulfils in part the criteria of a useful marker in nutrition research. In terms of analytical aspects (criterion 1), most measures of verbal memory are validated against existing measures, standardised for the population in question. The measures are therefore, only as good as those against which they have been validated. There are a large range of verbal memory tests available but all measure a specific cognitive function and thus can be considered to show specificity, although there is variability in the degree of standardisation of these tests. There is also considerable
16
variability in the sensitivity and discriminative validity (i.e. the ability of the test to detect impairment) of verbal memory tests for example the Mini Mental State Examination can detect severe memory impairment but is less sensitive to mild impairment. The association between the marker and the endpoint depends on the demographics of the target population. Verbal memory shows a stronger association with the endpoint (cognitive decline) in older adults with mild cognitive impairment. In general, verbal memory does not reflect or predict a clinical endpoint. In terms of response to dietary intervention, verbal memory measures are often the endpoint rather than the marker. Dietary intervention studies are usually short term (<1 year) and although effects observed for verbal memory may be statistically significant, these may not be clinically significant i.e. may not reflect a reduction in disease risk or progression. Hence verbal memory only partially meets the criteria of being a valid marker.
17

Table S2. Summary of verbal memory tests used in polyphenol, B vitamin and n-3 fatty acid intervention trials
Nutritional intervention Age of
participants
Characteristics of
participants
Verbal
memory test
Measures p value Effect size
Grape juice
Supplementation over 12
weeks (n=12)
Mean age of
78.2
Males and females who
have experience age
related memory decline
CVLT Item Acquisition p=0.04 f = 0.28
Delayed Recall p=0.10 f = 0.33
Blueberry
Supplementation over 12
weeks (n=9)
Mean age of
76.2
Males and females who
have experience age
related memory decline
VPAL Cumulative learning score p=0.009 d = 1.78
CVLT Word list recall p=0.04 d = 1.18
n-3 Fatty Acid over 24
months (n=748)
70 - 79 years Healthy males and females CVLT Sum of words on three trials
of immediate recall
p=0.14
Delayed recall p=0.46
Isoflavone
supplementation over 12
months (n=175)
60 - 75 years Healthy postmenopausal
females
RAVLT Immediate Recall p=0.36
Delayed Recall p=0.68
Recognition p=0.53
18

Nutritional intervention Age of
participants
Characteristics of
participants
Verbal
memory test
Measures p value Effect size
Nutritional intervention Age of
participants
Characteristics of
participants
Verbal
memory test
Measures p value Effect size
Isoflavone
supplementation over 12
weeks (n=34)
30 - 80 years Healthy males RAVLT Immediate Recall p=0.40
Short delay recall following
interference list
p=0.71
Delayed Recall p=0.48
PAL Immediate Recall p=0.18
Delayed Recall p=0.24
Vitamin B over 24
months (n=253)
> 64 years Healthy males and females RAVLT Sum of words on five trials of
immediate recall
p=0.14
Delayed Recall p=0.16
Isoflavone
supplementation over 6
months (n=30)
62 - 89 years Healthy males and females Selective
Reminding
Total number words across all
learning trials (immediate
recall)
p=0.42
Delayed recall p=1.00
19

Nutritional intervention Age of
participants
Characteristics of
participants
Verbal
memory test
Measures p value Effect size
Nutritional intervention Age of
participants
Characteristics of
participants
Verbal
memory test
Measures p value Effect size
Cranberry Juice over 6
weeks (n=47)
≥60 years Healthy males and females Selective
Reminding
Immediate free recall p=0.54
Long-term storage p=0.16
Short-term recall p=0.05a
Long term retrieval p=0.20
Consistent long-term retrieval p=0.31
Random long-term retrieval p=0.99
Cued recall p=0.21
Delayed free recall p=1.00
Delayed recognition p=0.71
Dark Chocolate and
Cocoa over 6 weeks
(n=90)
> 59 years Healthy males and females Selective
Reminding
Immediate recall p=0.79
Cued Recall p=0.95
Delayed Recall p=0.71
Delayed Recognition p=0.22
20

Nutritional intervention Age of
participants
Characteristics of
participants
Verbal
memory test
Measures p value Effect size
Nutritional intervention Age of
participants
Characteristics of
participants
Verbal
memory test
Measures p value Effect size
Vitamin B over 35 days
(n=211)
n=56 between
20 - 30 years;
n=82 between
45 - 55 years;
n=75 between
65 - 92 years.
Healthy females RAVLT Immediate Recall p=0.06
Recognition p<0.05
Vitamin B over 10 weeks
(n=7)
> 64 years Males and females who
met criteria for dementia
Logical
Memory subtest
(WMS)
Free Recall p=0.28
Associate
Learning subtest
(WMS)
Recall p=0.08
n-3 Fatty Acid over 105
days (n=288)
6 - 11 years Healthy male and female
children
HVLT Total scores across three recall
trials
p>0.05
Recognition p>0.05
21

Nutritional intervention Age of
participants
Characteristics of
participants
Verbal
memory test
Measures p value Effect size
n-3 Fatty Acid for 12
months (n=35)
> 59 years Males and females who
met criteria for MCI
RAVLT Immediate Recall p>0.05
Delayed Recall p<0.05
Nutritional intervention Age of
participants
Characteristics of
participants
Verbal
memory test
Measures p value Effect size
Vitamin B over 24
months (n=223)
> 69 years Males and females who
met criteria for MCI
HVLT Delayed Recall b p=0.23
Delayed Recall c p=0.001
Vitamin B over 3 months
(n=76)
70 - 79 years Healthy males Associate
Learning Task
Short Delay Recognition p<0.05d
Delayed Recognition (forget
score)
p<0.04e
n-3 Fatty Acid and
Vitamin B over 4 weeks
(n=41)f
> 19 years Healthy males and females RAVLT Immediate Recall on trials 1 -
5
p=0.25
Short delay recall following
interference list
p=0.17
Delayed Recall p=0.52
MCI, mild cognitive impairment; CVLT, California verbal learning test; PAL, paired associate learning; VPAL, verbal paired associate learning; RAVLT, rays auditory-verbal learning Test; WMS, Wechsler memory scale; HVLT, Hopkins verbal learning test. a Bonferonni corrected α level of 0.003
22

b Overall effect c High homocysteine groupd On trial 2e On session twof Vitamin B (coconut oil) was placebo
23

Specific field and related marker: Attention – example of sustained attention measures
Criteria Identified at the workshop Comments1) Analytical aspects
i. Method should be validated according to recognised guidelines.
ii. This should include for example: robustness, appropriate analytical sensitivity and specificity, reproducibility accuracy, quality assurance, standardization, traceability, stability (quality of the sample). These guidelines can be specific per marker, it apply equally well to biological markers, imaging, questionnaires, etc.
Sustained attention (or vigilance) is widely used as a measure of cognitive function. Consideration of it as a marker or endpoint raises issues which are common to many other cognitive tests used in nutritional interventions. Sustained attention measures typically involve performing a monotonous task for prolonged periods of time. The participant is required to keep watch for a certain rare and unpredictably occurring target and the overall ability to detect these targets (‘vigilance level’), and the decrement in performance over time (‘vigilance decrement’)(81) are assessed. Vigilance level is generally based on the measurement of classic parameters of the Signal Detection Theory such as hit, correct rejection, omission and false alarm. Vigilance level is usually expressed as either a decrease in the number of correct detections over time or an increase in reaction time to signals over the watch-keeping period. Commonly, response speed to targets is also measured, particularly in tasks where subjects exhibit high levels of detections of signals and low levels of false alarms. Data are generally obtained via computerised assessments.There are various measures of sustained attention available. Commonly used measures include the Sustained Attention to Response Inhibition Task (SART(82), the Continuous Performance Task (CPT(83)), the Rapid Visual Information Processing (RVIP(84) task and the Digit Detection or Vigilance task(85).These standard measures have similar administration in that they employ a rapid presentation of continuously changing stimuli among which there is a designated "target" stimulus (i.e. a specific letter, number, colour or symbol) or "target" pattern (e.g. three specific numbers presented consecutively), usually among distracter stimuli. The duration of the task varies, but the task is intended to be of sufficient length to measure sustained attention. Most of the decrement typically appears within the first 15 minutes(86) but it can appear even more rapidly when task demand conditions are high.Typically, these tests have been validated for the relevant age group, have good robustness and sensitivity (e.g. SART(87); CPT(88); RVIP(89) and they are used widely in the field of psychology in a standardised manner. Tests can be vulnerable to practice effects, yet the exact effects of practice on vigilance remain insufficiently investigated. Notably, practice may not necessarily decrease the test demand during sustained attention tasks.
2) Reflect/mark an endpoint
i. Significant association between marker and endpoint in a target population
ii. Marker changes consistently with a change in the endpoint
Low sustained attention may be reflective of a difference in real-life performance such as higher risk of errors and accidents within a target population. This is relevant for example in situations such as driving, factory work, and shift work in particular but numerous situations can be thought of in which sustaining attention is of crucial importance.Changes in sustained attention performance, both positive (e.g. due to caffeine, taking naps) and negative (e.g. due to sleep deprivation, diazepam), can be related to changes in real-life performance such as
24

driving performance resulting in differences in the occurrence of road or railway accidents (e.g. Brice et al. (2001)(90); Edkins et al. (1997)(91). Moreover, it is generally problems with sustained attention that make it difficult and fatiguing to maintain work performance throughout the day. For example, decreases in sustained attention during factory work increase accident risk at the end of 2 hour shifts(92).
3) Must respond to a dietary intervention
i. Any dietary intervention should induce a meaningful change in the marker (meaningful refers to 2.ii )
ii. Lifestyle changes (which may include changes in the diet) may also include a meaningful (meaningful refers to 2.ii ) change in the marker
Sustained attention can be influenced by a range of dietary interventions. Perhaps most noticeably and consistently, caffeine consumption has been related to acute improvements in sustained attention. Findings for different tasks are summarized in the Table below. Moreover, other acute interventions such as glucose(93), theanine(94), cocoa flavanols(95) and chewing gum(96,97) have been shown to positively affect performance on sustained attention tasks in some studies.Other studies have also explored the effects of longer term dietary interventions on sustained attention, with some positive results. For example, Duffy, R. et al., 2003(98) found that taking a dietary supplement of soya isoflavones for 12 weeks resulted in significant improvements in sustained attention (a Paced Auditory Serial Addition Test).Notably, in most studies sustained attention is the endpoint rather than a marker of some other cognitive outcome such as dementia or cognitive decline. Lifestyle changes have not been related to changes in sustained attention.
Conclusions With regard to acute effects of sustained attention, the effects of caffeine are generally consistent, with the large majority of studies showing beneficial effects on speed and/or accuracy outcomes (or both). Effects of other nutrients (glucose, theanine, cocoa) and for longer term nutrition interventions are rather more inconsistent.In these cases it is difficult to determine whether the lack of effects is due to insensitivity of the measure, the sample size, differences in the duration of treatment or dose/preparation etc.Experimental challenges such as stress exposure or sleep deprivation which can affect sustained attention could be useful adjunct paradigms to increase the sensitivity of this marker. Sustained attention has potential as a marker of cognitive function and can be influenced by specific nutrients. Notably, in most studies sustained attention is the endpoint rather than a marker of some other cognitive outcome such as dementia or cognitive decline.
25

Table S3. Summary of sustained attention tests used in acute caffeine intervention trials
Test Nutritional intervention Studies Summary of findings
Rapid Visual Information
Processing (RVIP) task
Single dose of caffeine
(as compared to placebo)
Hasenfratz et al. 1992; 1994(99,100); Warburton et al. 1995(101);
Rees et al., 1999(102); Smit et al., 2000(103); Yeomans et al.,
2002(104); James et al., 2005(105,106); Haskell et al., 2008(107);
Owen et al., 2008(108); Maridakis et al., 2009a; 2009b(106,109)
8 out of 11 studies found an effect of
caffeine in various doses
Repeat Digit Detection
(RDD) task
Single dose of caffeine
(as compared to placebo)
Smith et al. 1992; 1994a; 1994b; 1997; 1999; 2003; 2005;
2006; 2009(110-118); Brice & Smith, 2001(90); Christopher et al.
2005(119); Hewlet et al. 2006; 2007(120,121)
10 out of 13 studies found an effect of
caffeine in various doses. 7 studies reported
more hits, and 6 reported
Continuous Performance
Task (CPT)
Single dose of caffeine
(as compared to placebo)
Kelemen et al., 2001(122); Maridakis et al., 2009b(109); Tieges
et al., 2009(123)
2 out of 3 studies found faster responses
after caffeine
Digit Vigilance (DV) Task Single dose of caffeine
(as compared to placebo)
Haskell et al., 2005; 2008(107,124) Faster responses after caffeine
Sustained Attention to
Response Task (SART)
Single dose of caffeine
(as compared to placebo)
Foxe et al., 2012(94) Reduced error rates after caffeine
26

Specific field and related marker: Cardiovascular diseases/vascular function – flow mediated dilatation
Criteria Identified at the workshop Comments1) Analytical aspects
i. Method should be validated according to recognised guidelines.
ii. This should include for example: robustness, appropriate analytical sensitivity and specificity, reproducibility accuracy, quality assurance, standardization, traceability, stability (quality of the sample), analytical variation, biological variation These guidelines can be specific per marker, it apply equally well to biological markers, imaging, questionnaires, etc.
Endothelial dysfunction is an important early event in the development of atherosclerosis, which precedes the development of clinical symptoms. Flow-mediated dilatation (FMD) describes arterial dilatation in response to increased intra-luminal shear stress. In humans, this phenomenon has been assessed using a forearm technique, in which reactive hyperaemia following release of an arm cuff inflated to suprasystolic pressures mediates increased brachial artery diameter. The assessment of FMD was introduced almost 20 years ago to examine vasodilator function in vivo. FMD is widely believed to reflect endothelium-dependent and largely nitric oxide-mediated arterial function and is used as a surrogate marker of vascular health(125). The technique is non-invasive, and is therefore widely used. A number of agreed protocols have been published to guide investigators using this procedure, while guidelines for investigators regarding methodology and technique and also training and quality assurance have been published (see tables below(126,127)). The available guidelines recommend rigorous attention be paid to protocol standardisation, training and ongoing quality improvement, as these are critical to generating valid, reproducible data. Despite its widespread adoption and the availability of these guidelines, there is considerable variability between studies with respect to the protocols applied, methods of analysis, and interpretation of results. Such differences in methodological approaches have important impacts on the response magnitude, can result in spurious data interpretation, and limit the comparability of outcomes between studies(127,128), while differences in reproducibility between centres have also been highlighted(129). However, recent papers examining variability and reproducibility of FMD in multi-centre studies suggested that reproducible FMD measurements can be achieved, comparable with those reported from specialized laboratories. Thus, if such reproducibility can be established within a centre, following the guidelines as indicated below, then FMD can be used as an outcome measure in short- to medium-term studies(130,131). Reproducibility should be reported, within centre, between operators and between centres for multi-centre studies, for any study reporting FMD.
27

Table S4. Training and quality improvement protocol (with permission to use from J Am College Cardiol 2002; 39:257-65)
28

Recommendations for FMD assessment to examine a largely nitric oxide-mediated, endothelium-dependent vasodilatation of a conduit artery in humans. Methodological and Technical Guidelines (modified after Circ
29

Physiol 300(1): H1-H12)
Subject Preparation
- Rest in a quiet, preferably darkened room for a period of ≥20 min before assessment.
- Supine posture (i.e., the imaged artery should not be substantially above or below heart level).
- Tests should be standardized and, for multiple tests, conducted at a similar time of day.
- Cuff must be placed distal to the imaged artery and inflated for 5 min.
- Subjects must be fasted for ≥6 h.
- Subjects must avoid exercise or food/drinks that contain caffeine or alcohol for ≥8 h.
- Careful history should be taken regarding the use/timing of drugs because some drugs have an effect.
- Premenopausal women should be assessed on days 1-7 of the menstrual cycle.
Protocol
- Baseline diameter must be examined before cuff inflation for a period of at least 1 min.
- Present absolute baseline diameter should be in results section.
- Measurement of postdeflation diameter should start before cuff release.
- Measurements should be performed for ≥3 min in upper limb arteries and ≥5 min in lower limb arteries.
Technique
- Continuous measurement of velocity and diameter using duplex ultrasound should be performed.
- Blood velocity should be assessed using an insonation ≤60°.
- Use the same angle within a study and study group (and report angle).
- B-mode images with a probe of ≥7.5 MHz should be used (and report probe details).
Analysis
- Continuous edge detection and wall tracking should be used to capture true peak diameter and for calculation of shear rate.
- Peak velocity outer envelope assessment is recommended for analysis of the Doppler signal.
- Automated mathematical algorithms should be used to calculate the peak diameter.
- Present the FMD response in absolute (in mm) and relative (in %) change.
- The relevant shear-rate stimulus (area-under-the-curve until peak diameter) must be presented.
- The use of ratio normalization (e.g., FMD/shear) is currently unresolved, and at this time no recommendation to use such normalization can be provided.
30

An acceptable reproducibility is a mean difference of 2-3% in FMD over time (on a baseline vasodilatation of 10%), but such reproducibility data are rarely reported in nutrition interventions (126). The merits of a single measure of FMD have been debated (Al-Quaisi et al., 2008), but a recent study examining variability and reproducibility of FMD in a multicentre clinical trial suggested that, in a multi-centre setting reproducible single FMD measurements can be achieved in the short to medium term, comparable to that achieved in specialist laboratories, and that therefore FMD, if such performance can be demonstrated within a centre, can be used as an outcome measure for short- and medium-term assessment of dietary and other interventions.
2) Reflect/mark an endpointi. Significant association between marker
and endpoint in a target population ii. Marker changes consistently with a
change in the endpoint
FMD has been associated fairly consistently with CVD risk factors and with an increased risk of CVD (128,132-134), although its predictive value on top of traditional risk factors is unknown (135,136), and the effect of a change in FMD on CVD risk has not yet been established, and a need for such trials has been suggested(133). See below for a comparison of FMD compared to other measures of endothelial function, demonstration of association with CVD risk factors, and prognostic significance in terms of CVD risk(132).
Table S5. Methods for Clinical Assessment of Endothelial Function (modified after Circulation 2007; 115:1285-95)
Technique (Outcome Measure)
Noninvasive
Repeatable
Reproducible*
Reflects Biology
Reversible
Predicts Outcome†
31

Cardiac catheterization (change in diameter, change in coronary blood flow)
− − +/− + + +
Venous occlusion plethysmography (change in forearm blood flow)
− +/− +/− + + +
Ultrasound FMD (change in brachial artery diameter)
+ + +/− + + +‡
PWA (change in augmentation index)
+ + +/− + − −
PCA (change in reflective index)
+ + +/− + − −
PAT (change in pulse amplitude)
+ + +/− + − −
+ indicates supportive evidence in literature; −, insufficient evidence; FMD, flow-mediated dilatation; PWA, pulse wave analysis; PCA, pulse contour analysis; and PAT, pulse amplitude tonometry.*Reproducibility of PWA, PCA, and PAT has been less extensively investigated than FMD.†Studies that link PWA, PCA, and PAT to outcome have not yet been reported.‡FMD is currently the standard for non-invasive assessment of conduit artery endothelial function because there is considerable clinical trial experience, validation, a firm link to biology, and association with cardiovascular events.
32

Fig. S2. FMD of the brachial artery. A, Ultrasound probe held in stereotactic clamp with micrometre adjustment. B, Continuous measurement of brachial artery diameter (end-diastolic images obtained every 3 seconds), before, during, and after inflation and release of sphygmomanometer cuff on forearm. C, Relationship of FMD to coronary risk factors in 500 asymptomatic adults. Reproduced from Celermajer et al copyright © 1994, with permission from the American College of Cardiology Foundation. D, Impact of diet and exercise on FMD in overweight Chinese teenagers over 6 weeks and 1 year. Reproduced from Woo et al with permission from Lippincott, Williams & Wilkins. Copyright © 2004, American Heart Association. With permission to use from Circulation 2007; 115:1285-95.
33

Fig. S3. Relationship between different measures of endothelial function and cardiovascular outcome. A, Intracoronary testing with acetylcholine in 308 patients referred for cardiac catheterization. Ach indicates acetylcholine; VC-Ach, vasoconstriction to Ach; VD-Ach, vasodilatation to Ach. Reproduced from Halcox et al with permission from Lippincott, Williams & Wilkins. Copyright © 2002, American Heart Association. B, FMD of the brachial artery in 199 patients undergoing vascular surgery. Reproduced from Gokce et al, copyright © 2003, with permission from the American College of Cardiology Foundation. C, Event-free survival in 519 patients with coronary disease according to levels of circulating CD34+KDR+ endothelial progenitor cells at enrolment. Reproduced from Werner and Nickenig with permission from the Foundation for Cellular and Molecular Medicine. Copyright © 2006. With permission to use from Circulation 2007; 115:1285-95.
3) Must respond to a dietary intervention i. Any dietary intervention should induce a
meaningful change in the marker (meaningful refers to 2.ii )
ii. Lifestyle changes (which may include changes in the diet) may also include a meaningful (meaningful refers to 2.ii ) change in the marker
Normal ranges have not yet been described for FMD.
The effect of n-3 fatty acids on endothelial function has been reviewed (137) as has the effect of fruit polyphenols(138), berries(139), soy isoflavones(140), flavonoids from cocoa(141) and green and black tea (142,143)
on vascular health, and these reviews include studies using FMD endpoints. Recent individual studies have suggested improved FMD after increasing potassium (Blanch et al., 2014), reducing salt(144) or increasing almond intake (Choudhury et al., 2014). Therefore a wide range of dietary interventions have been suggested to affect FMD. A wide range of lifestyle and other factors can affect FMD, including time of day, menstrual cycle, room temperature, nicotine, caffeine, fatty food, concurrent inflammation or infection, and therefore a careful protocol, minimising the effect of these through protocol adjustment, is important(128,132). See above guidelines for further details(126,127) of necessary protocol design.
Remarks for the discussion (if any)i. Are there experimental data were the
intervention has not resulted in a significant
A useful calculation of power based on different reproducibility performance, and according to expected change in FMD in response to the intervention has been recently presented(130).
34

change?ii. ix. What were expected changes in
the power calculations of clinical trials?iii. others
Fig. S4. Relationship between effect on maximum % change in flow-mediated dilatation and number of subjects required in various trial scenarios with different coefficient of variation (CV: 15% and CV: 25%) between centres assuming 80% power and 5% significance for a parallel and crossover trial design. With permission to use from Eur Heart J 2013; 34:3501-07
Conclusions FMD has potential as a marker of endothelial function and CVD risk and can be influenced by diet and by specific nutrients. However, careful consideration of methodological issues around reproducibility and standardised protocols is required within an individual centre or multi-centres, and there is also currently a lack of studies showing a reduction in CVD risk in response to a change in FMD. However, as it is non-invasive, and permits testing of nutritional interventions at any early pre-clinical stage, when the disease process is likely to be reversible, FMD is an attractive choice of endpoint in nutritional interventions.
35

Specific field and related marker: Cardiovascular diseases/oxidative stress– F2-isoprostanes
Criteria Identified at the workshop Comments1) Analytical aspects
i. Method should be validated according to recognised guidelines.
ii. This should include for example: robustness, appropriate analytical sensitivity and specificity, reproducibility accuracy, quality assurance, standardization, traceability, stability (quality of the sample), analytical variation, biological variation. (These guidelines can be specific per marker; it applies equally well to biological markers, imaging, questionnaires, etc.)
F2-isoprostanes are prostaglandin F2-like compounds formed in vivo from non-enzymatic arachidonic acid peroxidation, and have been suggested as indicators of in vivo oxidative stress. Currently they are considered the gold-standard for measuring oxidative stress. F2-Isoprostanes can be evaluated in plasma and urine, and can be measured in both fresh and frozen samples, but urine is considered to be the more reliable measure. Assays are either chromatography-based, or immuno-assays. Chromatographic methods are superior, because of their greater specificity (see Table below from Stephens et al. 2009(145)), and because when linked to MS, they allow the use of a stable isotope internal standard which reduces analytical variation. Published protocols detailing chromatography assay-based protocols are available(146,147). Chromatography-based methods tend to require a relatively large sample volume (0.5-1.0 ml(145). In urine the assessment requires concurrent assessment of creatinine. Measurement of isoprostanes as a biomarker of oxidative damage to lipids has been accepted by EFSA (NDA panel).
Table S6. Methods used to measure oxidative stress in plasma (modified after Arteriosclerosis 2009; 321-329)Method Principle CommentPlasma TAOS/TAS Measures the inhibition of an in vitro
oxidative process by plasma.Technically easy and provides an overall measure of antioxidant status. Methods include TAOS/TAS/TRAP.
F2-isoprostanes Product of free radical-mediated oxidation of phospholipids containing arachidonic acid
Very specific and the ‘gold’ standard for assessing lipid peroxidation ex vivo. However, technically complex requiring mass spectroscopy. RIA method is validated. Commercially available ELISA kit not validated.
Lipid peroxides Peroxidation products of lipids. These are often instable.
Require HPLC or GC–MS. Commercially available kits have little validation.
Thiobarbituric acid-reactive substances and monoaldehyde
Malonaldehyde, a product of lipid peroxidation is coupled to thiobarbituric acid and the resulting chromogram is measured by fluorescence.
Widely used and technically simple. Subject to confounding by compounds of non-peroxidation origin. The specificity may be improved by HPLC. Also affected by Fe content of buffer and reagents.
Biomarkers of protein peroxidation
8-Hydroxydeoxyguanosine (8-ohdG) generated from oxidative attach on DNA.
The validity of measuring 8-ohdG needs to be confirmed. Measured by HPLC. Commercial kits recently developed.
36

Isoprostane levels are either similar in males and females or slightly higher in females (148). Fasting does not seem to affect isoprostane concentration in urine(148), when creatinine adjusted values are used. A recent paper suggests that isoprostane metabolites may be more sensitive biomarkers of oxidative stress than the parent compounds(149).
2) Reflect/mark an endpointi. Significant association between marker
and endpoint in a target population ii. Marker changes consistently with a
change in the endpoint
Whilst isoprostanes are considered to be the best marker of oxidative stress to date, their association with CVD risk has not been demonstrated consistently, with only a small number of case control and nested case control studies examining association with CVD endpoints. Such studies, reviewed in 2011, do suggest an association between increased isoprostane status and increased risk of CVD, with the severity of disease correlating with status(148). However, to date there are no studies demonstrating that a reduction in isoprostane levels leads to a reduction in CVD risk.
3) Must respond to a dietary intervention i. Any dietary intervention should induce a
meaningful change in the marker (meaningful refers to 2.ii )
ii. Lifestyle changes (which may include changes in the diet) may also include a meaningful (meaningful refers to 2.ii ) change in the marker
Normal ranges for isoprostane levels in a variety of biological fluids have been defined for healthy subjects (147).
Table S7. Basal levels of free F2-Isoprostanes in various body fluids and tissues from normal human (modified after Meth Enzymol 2007; 433: 113-26)
Body fluid Level (mean ± 1 sd)Plasma 35 ± 6 pg ml-1
Urine 1.6 ± 0.6 ng mg-1 creatinineCerebrospinal fluid 23 ± 1 pg ml-1
An effect of vitamin E on isoprostanes in plasma has been demonstrated in animal models and humans (148). An effect of fruit and vegetables has been demonstrated in one study in humans, but a number of other studies have found no effect of increasing polyphenols (summarised in (McCall et al., 2011(129)). A recent systematic review summarised the effects of antioxidant-rich foods or supplements on F2-isoprostanes. The interventions and study designs included were heterogeneous, but less than half of the 154 studies considered (45%) demonstrated an effect of intervention on isoprostanes, and the authors stress the need for consideration of intervention type, dose, duration, study design and participant characteristics in future studies (150). Urinary isoprostane concentrations are higher in smokers than non-smokers(148).
Conclusions F2-isoprostanes are proven biomarkers of oxidative stress, and the laboratory methodology to measure them is well established. Some information on confounders and associations with CVD risk factors and risk is available, but large studies showing an association with CVD risk are absent, and the ability of interventions lowering isoprostanes to reduce CVD risk has not yet been established.
37

Specific field and related marker: Cardiovascular diseases – blood pressure
Criteria Identified at the workshop Comments1) Analytical aspects
i. Method should be validated according to recognised guidelines. This should include for example: robustness, appropriate analytical sensitivity and specificity, reproducibility accuracy, quality assurance, standardization, traceability, stability (quality of the sample), analytical variation, biological variation. (These guidelines can be specific per marker; it applies equally well to biological markers, imaging, questionnaires, etc.)
Hypertension (raised blood pressure) is one of the most important preventable causes of premature morbidity and mortality worldwide, being a risk factor for stroke, myocardial infarction, heart failure, chronic kidney disease, cognitive decline and premature death. Systolic blood pressure is the pressure in the arteries when the heart beats (when the heart muscle contracts), while diastolic blood pressure measures the pressure in the arteries between heartbeats. Systolic blood pressure is included in all cardiovascular risk assessment screening tools (e.g. JBS, Q-RISK). National guidelines are available regarding validated, automatic blood pressure measuring devices, as well as measurements by the manual method(151,152). In the UK, a list of validated blood pressure monitoring devices is available from the British Hypertension Society website (www.bhsoc.org). Blood pressure can be measured in the clinical setting, via ambulatory blood pressure monitoring, and by the patient using home blood pressure monitoring. The need for training, review of performance, and recommendations for maintenance and calibration of equipment have also been described within national guidelines(151,152).
2) Reflect/mark an endpointi. Significant association between marker
and endpoint in a target population ii. Marker changes consistently with a
change in the endpoint
The association between blood pressure and cardiovascular disease risk is linear and definitions for stages of hypertension to guide therapy exist(151,152). Both systolic and diastolic blood pressure are used in the clinical diagnosis of hypertension, with the reading reported as systolic/diastolic. Stage 1 hypertension is defined as clinic blood pressure ≥140/90 mmHg; stage 2 hypertension as ≥ 160/100 mmHg or higher, while severe hypertension is defined as systolic blood pressure ≥ 180 mmHg or diastolic blood pressure ≥ 110 mmHg. Hypertension is an established risk factor for CVD, and lowering of blood pressure results in lowering of CVD risk. Clinical guidelines for pharmacological management of hypertension are available(151, 152). Blood pressure assessment is included in all cardiovascular risk screening tools, such as Q-RISK2, Framingham and JBS3. In a recent review of trial data, Law et al., 2009(153) estimated an approximate 50% reduction in CVD events per 20 mm Hg reduction in systolic BP, which is similar to that expected from the epidemiological evidence for CVD mortality from the Prospective Studies Collaboration(154).
3) Must respond to a dietary intervention i. Any dietary intervention should induce a
meaningful change in the marker (meaningful refers to 2.ii )
ii. Lifestyle changes (which may include changes in the diet) may also include a meaningful (meaningful refers to 2.ii ) change in the marker
Blood pressure is normally distributed in the population and there is no natural cut-point above which hypertension definitively exists and below which it does not, with the increased disease risks associated with increasing blood pressure being continuous(152). Clinical management guidelines have, however, been suggested (See earlier).
Clinical management guidelines include lifestyle advice, such as sodium, alcohol and caffeine reduction (152) and below(151).
38

Table S8. Lifestyle Modifications to Manage Hypertension* (modified after JAMA 2003; 289: 2560-71)
Modification Recommendation Approximate Systolic BP Reduction, Range
Weight reduction Maintain normal body weight (BMI, 18.5-24.9)
5-20 mm Hg/10-kg weight loss
Adopt DASH eating plan Consume a diet rich in fruits, vegetables, and low-fat dairy products with a reduced content of saturated and total fat
8-14 mm Hg
Dietary sodium reduction Reduce dietary sodium intake to no more than 100 mEq/L (2.4 g sodium or 6 g sodium chloride)
2-8 mm Hg
Physical activity Engage in regular aerobic physical activity such as brisk walking (at least 30 minutes per day, most days of the week)
4-9 mm Hg
Moderation of alcohol consumption Limit consumption to no more than 2 drinks per day (1 oz or 30 mL ethanol [eg, 24 oz beer, 10 oz wine, or 3 oz 80-proof whiskey]) in most men and no more than 1 drink per day in women and lighter-weight persons
2-4 mm Hg
Abbreviations: BMI, body mass index calculated as weight in kilograms divided by the square of height in meters; BP, blood pressure; DASH, Dietary Approaches to Stop Hypertension. *For overall cardiovascular risk reduction, stop smoking. The effects of implementing these modifications are dose and time dependent and could be higher for some individuals.
The recent JBS3 guidelines(47) suggest that body weight reduction, reduced salt intake, limitation of alcohol consumption to < 3 units per day for males and < 2 units per day for females, increased physical activity, increased fruit and vegetable consumption, and reduced total fat and saturated fat intake can all reduce blood pressure (47). A systematic review of randomised clinical trials suggests improved diet, aerobic exercise, alcohol and sodium restriction, and fish oil supplements all reduce both systolic and diastolic blood pressure, but that relaxation therapies, calcium, magnesium or potassium supplements have no effect on blood pressure(155).
Conclusions Elevated blood pressure is accepted as a risk factor for CVD and as an indicator of increased risk, and is reversible by lifestyle and dietary changes.
39

40
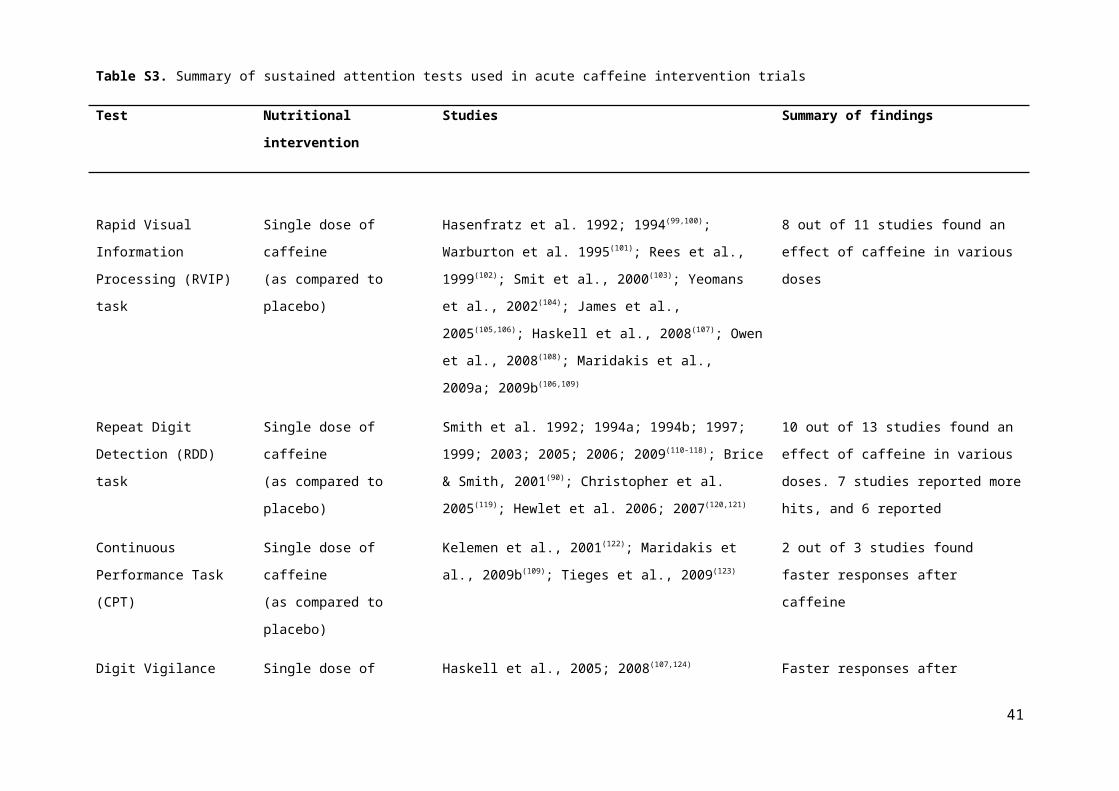
Specific field and related marker: Glucose intolerance and type-2 diabetes – branched chain amino acids and their derivatives
Criteria Identified at the workshop Comments (what should be included)1) Analytical aspects
i. Method should be validated according to recognised guidelines.
ii. This should include for example: robustness, appropriate analytical sensitivity and specificity, reproducibility accuracy, quality assurance, standardization, traceability, stability (quality of the sample). These guidelines can be specific per marker, it apply equally well to biological markers, imaging, questionnaires, etc.
The branched chain amino acids and their derivatives (valine, leucine, isoleucine, 3-methyl-2-oxovalerate, 3-methyl-2-oxobutyrate, 4-methyl-2-oxopentanoate) have been consistently identified as plasma/serum biomarkers of hyperglycaemia, insulin resistance and type 2 diabetes in cohort studies where metabolomics/metabolic profiling approaches were used. The metabolomics or metabolic profiling approaches applied in the different studies differ from each other. Most were mass spectroscopy (MS)-based techniques, which allow the simultaneous analysis of several hundred metabolites in a single sample. Metabolomics/metabolic profiling offers considerable potential for identification of new biomarkers, but still lacks well established and standardized methods or procedures and therefore there can be differences in reproducibility and quality assurance. To correct for deviations due to saturation of LC/GC columns, for example, it is important to add a quality control (QC) sample at regular intervals during the analysis sequence (one QC after every 10 samples). A QC sample can be prepared by pooling, for example, plasma from all subjects. It serves to monitor regularly the LC/GC-MS response time and to calibrate the data. Furthermore, these methods report semi-quantitative concentrations against internal standards. Finally, besides method of sample taking and preservation, stability of the metabolites depends on the analysis method used. The performance of the method for the different metabolites quantified can be reported by the relative standard deviation (RSD) and should be reported per identified biomarker. Only metabolites with a precision of less than 20% in terms of RSD should be considered. However, the RSD of the markers identified is often not reported. A comprehensive review on limitations and recommendations of MS-based technology in nutrition research was provided by Scalbert et al., 2009(156).
2) Reflect/mark an endpointi. Significant association between marker
and endpoint in a target population ii. Changes in the marker are associated
with consistent change in the endpoint
Elevated concentrations of the branched chain amino acids and their derivatives have been associated with insulin resistance and type 2 diabetes in several cohorts(157-160). Studies cited also performed clinical validation of findings in independent cohorts. Recently, elevated concentrations of branched chain amino acids and their derivatives have also been identified in subjects with impaired fasting glucose. This suggests that higher blood concentrations of these markers are associated with the prediabetic to the diabetic state (161,162). Furthermore, elevated concentrations of the branched chain amino acids were found to predict future risk of type 2 diabetes, and this finding was confirmed in an independent prospective cohort(160). The branched chain amino acid response to an OGTT was found to be blunted in subjects with insulin resistance(163).
Gastric bypass surgery results in the rapid resolution of type 2 diabetes. Total amino acids and branched chain amino acids decreased after gastric bypass surgery (n=10+6, two cohorts), but not after dietary intervention inducing weight loss (n=11+6, two cohorts). Metabolites derived from branched chain amino acid oxidation also decreased only after gastric bypass surgery. These data suggest that the decrease in circulating amino acids after
41

gastric bypass surgery occurs by mechanisms other than weight loss and may contribute to the better improvement in glucose homeostasis observed with the surgical intervention(164). Recently, it was found that gastric bypass surgery resulted in elevated levels of branched chain amino acids (n=4 patients). The simultaneous increase in branched-chain amino acid with resolution of type 2 diabetes questions their role as a marker for insulin resistance(165). The reason for the difference between the two studies is not known, although there were differences in study design and number of subjects.
In conclusion, a significant association between this marker and endpoint has consistently been found. Also, there are indications that changes in the marker are associated with changes in the endpoint shown by gastric bypass surgery. However, this biomarker profile has so far only been used at a group level and has not been used for diagnostic purposes at an individual level.
3) Must respond to a dietary intervention (Is sensitive to nutrition intervention?)
i. Do dietary intervention induce a meaningful change in the marker (meaningful refers to 2.ii )
ii. Do other lifestyle changes (which may include changes in the diet) induce a meaningful (meaningful refers to 2.ii) change in the marker?
The Study of the Effects of Diet on Metabolism and Nutrition (STEDMAN) observed a persistent reduction in free fatty acids, branched chain amino acids, and related metabolites, associated with weight loss, that may contribute to improved insulin action(166).In a double-blind placebo-controlled, crossover study with treatment periods of 5 weeks significant lowering of plasma concentrations of branched chain amino acids and derivatives amongst other findings after dietary intervention with an anti-inflammatory mixture in 36 overweight subjects was reported (167). This study detected a multitude of subtle changes were detected by an integrated analysis of the "omics" data, which indicated modulated inflammation of adipose tissue, improved endothelial function, affected oxidative stress, and increased liver fatty acid oxidation. Glucose and insulin were not changed due to the dietary intervention, but other markers related to glucose metabolism, such as 1,5-anhydroglucitol – a marker for glycaemic control – and GLP-1, an incretin secreted in the gut inducing glucose-dependent stimulation of insulin secretion while suppressing glucagon secretion, were changed. This indicates that branched chain amino acids may be early and sensitive markers for changes in glucose metabolism.
Insulin resistance (IR) improves with weight loss, but this response is heterogeneous. Interestingly, a cluster of metabolites comprising branched chain amino acids and related analytes predicts improvement in the Homeostasis Model Assessment of insulin resistance (HOMA-IR) independent of the amount of weight lost. These findings were validated in the independent cohort, with a factor composed of branched chain amino acids and related metabolites predicting ∆HOMA-IR (p = 0.007). These results may help identify individuals most likely to benefit from moderate weight loss and elucidate novel mechanisms of IR in obesity(168).
Together, these results show that the branched chain amino acids and derivatives are sensitive to dietary modulation and that dietary interventions are able to induce a meaningful change to these markers. Weight loss is well known for improving insulin sensitivity. This has been associated with decreased levels of branched amino acids and derivatives. The study of Bakker et al. (2010) indicated that branched chain amino acids may be early and sensitive nutritional markers for modulation of glucose metabolism. Interestingly, Shah et al. (2012)(168)
showed that branched chain amino acids and derivatives could also be considered as markers for susceptibility to 42

successful dietary intervention.Conclusions Branched chain amino acids and derivatives are promising ‘new’ biomarkers for glucose intolerance, type 2
diabetes and nutritional modulation of glucose metabolism. These biomarkers were identified by applying metabolomics/metabolic profiling techniques in diverse cohorts and intervention studies. The laboratory methodology to measure them is currently not established enough to make these markers commonly accepted by a wide audience yet.
43

Specific field and related marker: Polyunsaturated fatty acid synthetic capacity – FADS1 Polymorphisms
Criteria Identified at the workshop Comments (what should be included)1) Analytical aspects
i. Method should be validated according to recognised guidelines.
ii. This should include for example: robustness, appropriate analytical sensitivity and specificity, reproducibility accuracy, quality assurance, standardization, traceability, stability (quality of the sample). These guidelines can be specific per marker, it apply equally well to biological markers, imaging, questionnaires, etc.
A Single Nucleotide Polymorphism (SNP) is a mutation where a single base in the DNA sequence differs from the usual base at that position. SNPs are the marker of choice in genetic analysis and also useful in locating genes associated with diseases. Recent advances in sequencing technology make it possible to comprehensively catalogue genetic variation in population samples, creating a foundation for understanding human disease, ancestry and evolution(169).
The enzyme δ-5 desaturase (D5D), encoded by the gene fatty acid desaturase 1 (FADS1), catalyzes one step of the pathway of conversion of linoleic acid (LA; an omega-6 fatty acid) into the long-chain polyunsaturated fatty acid (LC-PUFA) arachidonic acid (AA) and of α-linolenic acid (ALA; an omega-3 fatty acid) into the LC-PUFAs eicosapentaenoic acid (EPA) and docosahexaenoic acid (DHA). The minor alleles of SNPs rs174468, rs174537, rs174545, rs174546, rs174556 and rs174561 are associated with a decline in desaturase activity. This decline leads to increased levels of desaturase substrates (omega-6 LA, EDA, DGLA; omega-3 ALA) and decreased levels of desaturase products (omega-6 GLA, AA, Adrenic acid; omega-3 EPA, DPA, DHA). The minor allele frequencies of the SNP variants that result in a reduced δ-5 desaturase (D5D) activity range from 9-15% in the general population: rs174468-AA: 15%; rs174537-TT: 11%; rs174545-GG:11%; rs174546-TT:11%; rs174556-TT:9% and rs174561-CC:9%
Methods for SNP analysis are well established. There are many on-line and stand-alone tools to analyse the SNPs. The regulation of analytical validity is relatively straightforward and many countries have their own laboratory accreditation procedures that cover accuracy and reproducibility.
2) Reflect/mark an endpointi. Significant association between marker
and endpoint in a target population ii. Changes in the marker are associated
with consistent change in the endpoint
Only two direct associations between FADS1 polymorphisms and disease have been reported so far. The rs174537 minor T allele has been associated with a reduced cardiovascular risk (higher LA, lower AA, lower ratio AA/DGLA, lower ratio AA/LA; reduced total + LDL cholesterol and lipid peroxides) in a case-control study amongst 1646 Korean subjects(170). The rs174556 minor T-allele was shown to have a lower prevalence (lower Odds ratio) for atopic eczema in a cohort of 727 adults(171). These loss-of-function mutations are associated with a decline in FADS1 enzyme activity that results in lower levels of desaturase products AA, EPA and DHA, which are known to have a causal effect on disease outcome (172). PUFA status has been associated with several complex diseases, such as metabolic syndrome, cardiovascular disease, psychiatric diseases, cognitive development and immune-related diseases (173-178).Although there is a clear relationship between genetic variants of FADS1 and changes in PUFA concentrations, the underlying biological mechanism of any relationship between these genetic variants and health outcome (CVD, atopic diseases, child cognition) is complex(179-181). Besides, these are multifactorial diseases and FADS1 is
44

not the only influencing factor. AA can act as a substrate for inflammatory eicosanoids, and high concentrations of AA have been associated with an increased risk of CVD and allergic diseases; whereas higher concentrations of EPA and DHA have been demonstrated to reduce CVD risk factors and allergic diseases; and favour the cognitive development of children(182,183). To date, it is unclear whether mutations in FADS1 and consequently reduced LC-PUFA are risk factors for complex diseases in humans.
A relatively small increase of ≈20% in desaturase activity was associated with a ≈100% increase in the concentration of the inflammatory marker hs-CRP in a study of Martinelli et al. (2008)(178).
3) Must respond to a dietary intervention (Is sensitive to nutrition intervention?)
i. Do dietary intervention induce a meaningful change in the marker (meaningful refers to 2.ii )
ii. Do other lifestyle changes (which may include changes in the diet) induce a meaningful (meaningful refers to 2.ii) change in the marker?
Several studies show that plasma levels of PUFA, but also D5D activity can be modulated by a dietary intervention in subjects with the minor FADS1 loss-of-function variant alleles(184-188). Results of a controlled dietary intervention study indicate that hypercholesterolemic subjects homozygous for a minor allele (rs174537, rs174545, rs174561) have ~50% lower plasma EPA proportions and may be predisposed to increased CVD risk(185). An increase in intake of ALA of 10% of energy in the diet compensated for the lower apparent FADS activity and these individuals obtained higher EPA concentrations, beyond that of major allele carriers consuming a typical Western diet (high omega-6 LA)(185). In general, dietary approaches are designed to increase the omega-3/omega 6 ratio leading to less n-6 AA and higher levels of n-3 EPA and DHA. The benefit for individuals carrying the minor allele of increasing dietary intake of EPA and DHA seems plausible as the FADS1 enzyme increases the production of LC-omega-3-PUFA leading to relatively more anti-inflammatory eicosanoids and less pro-inflammatory eicosanoids (184,186). The dietary effects on the health outcome for subjects carrying the loss-of-function genetic variants of FADS1 is unknown. So far, no study have been performed that directly shows that a loss-of-function FADS1 carrier will improve long-term health outcome by maintaining a good omega-3/omega-6 balance and increasing the dietary intake of omega-3 LC-PUFA. In epidemiological and clinical trials it has been shown that omega-3 LC-PUFA EPA and DHA reduce the incidence of CVD(189), possibly modulate inflammatory responses(190); and play an important role in growth and function of nervous tissue(191).
Conclusions FADS1 polymorphisms are promising ‘new’ biomarkers for susceptibility to metabolic syndrome, cardiovascular disease, and other disease endpoints related to PUFA status. The susceptibility for these diseases can potentially be modulated by diet. Methods for SNP analysis are well established and accepted.
45

Specific field and related marker: Intestinal Barrier Function (Intestinal permeability) - Lactulose/mannitol ratio urinary test
Criteria Identified at the workshop Comments1) Analytical aspectsi. Method should be validated according to
recognised guidelines.ii. This should include for example:
robustness, appropriate analytical sensitivity and specificity, reproducibility accuracy, quality assurance, standardization, traceability, stability (quality of the sample). These guidelines can be specific per marker, it apply equally well to biological markers, imaging, questionnaires, etc.
Permeability of the gut barrier is commonly assessed by measuring the ratio of lactulose/mannitol in urine after ingestion of a given dose of both undigested sugars. Diffusion of molecules through the gut barrier is inversely related to the square root of their molecular weight, and depends on the diameter of the molecule. Mannitol has a smaller diameter than lactulose (0.8 vs 1 nm) and therefore the recovery of mannitol in urine (16-20%) is higher than that of lactulose (0.2 -0.8 %) in healthy humans and in most animal models (192). Increased urinary appearance of lactulose relative to mannitol represents abnormal permeability of the gut barrier. The main advantage of this method is to reduce the inter-individual variability of gut permeability itself by using a ratio with a physiological reference. This test was described for the first time in 1978(193)and became well-accepted thereafter(194) perhaps because of its ease of use in the field. Urinary concentrations of both lactulose and mannitol are measured by HPLC (High Pressure Liquid Chromatography) which can be considered as a validated method. Robustness is not reported in the literature. Analytical sensitivity is 5% for lactulose, and 1.3% for mannitol using HPLC. Specificity of HPLC is 99.9%(195). Repeatability within run is 10%, between run is 20%(196).There is a 97% linearity in analytical results with increasing doses from 3 to 100 mg/l using double logarithmic coordinates (195).A 30% change of the ratio was used to calculate the sample size in a trial investigating the effects of alanyl-glutamine in HIV patients(197).
The dose of sugars to be used in the test are not yet harmonised. A commonly used protocol in adults is as follows: Ingestion of 5 g of lactulose and 2 g of mannitol in 150 ml water. Urine is collected from 0-2 hours, or 0-4 hours after ingestion. Lactulose and mannitol passing through the intestinal barrier enter the systemic circulation do not undergo any metabolism (as demonstrated by intravenous injection of labelled lactulose and mannitol in humans(198)) and are excreted unchanged in the urine. Short urine collection periods (≤ 4 h) are optimal as there is a good correlation (r=0.88) between blood and urine concentration (Fleming et al., 1996). Samples can be frozen and are stable at -40°.
The lactulose/mannitol test replaces two earlier markers: One is the use of a radio-labelled compound (Chromium)(199) and the other is the use of a non-absorbable marker, PEG(200) (See review by Mishra et al., (2012)(201). The main improvement provided by the lactulose/mannitol ratio is to reduce inter-subject variability to 12 % (from 65-90%), because part of the individual physiological variability affects the “referent” sugar and is not affecting the ratio. However the test also offers practical advantages; radio-labelled markers are less easy to use, and PEG is not easy to measure or to use in foods.
46

2) Reflect/mark an endpointiii. Significant association between marker
and endpoint in a target population iv. Changes in the marker are associated
with consistent change in the endpoint
Abnormal permeability of the gut barrier is expected in many diseases, and an abnormal test has been reported in many of these including irritable bowel disease (IBD), irritable bowel syndrome (IBS), coeliac disease, colon cancer, diabetes, food allergy, and diarrhoea. The marker (i.e. the ratio) directly reflects the end-point (i.e. gut permeability). However the marker does not represent gut permeability in its broadest sense since it does not assess aspects such as microbial, microbial product or antigen permeability.It is used for colonic assessment although fermentation may reduce the amount of available substrate.
For active coeliac disease, specificity is 54%, sensitivity 89%, and negative predictive value 95% (202). Similarly Johnston et al. (2000)(203) reported a sensitivity of 87%. Vogelsang et al. (1998)(204) reported a low specificity (no value) as many diseases are associated with an increased permeability, and a high sensitivity, near 100%.In Crohn’s disease, Andre et al. (1988)(205) reported a sensitivity of 84% with a cut-off point at 0.018 when healthy controls are around 0.012. The inter-subject variability is expressed by a SEM of 0.003 around a mean value of 0.02 in groups of 30 to 50 healthy subjects.
The range for use is not dependent on aging(206) and the test is valid in children(207).
Values reported for normal controls are (mean or median): 0.014 to 0.020 depending on teams and laboratories.Values reported for diseases are: Coeliac Disease: median: 0.038, mean: 0.163Cut-off point (for malabsorption syndrome, including Coeliac disease) suggested at 0.049 (208) using NMR spectroscopy analysisCrohn’s Disease: mean in remission: 0.021; active: 0.0763Cut-off point proposed at 0.022(209)
Liver cirrhosis: mean: 0.0517
Cut-off for IBS: 0.020(210).
Common use(s):It is used in clinical practice to assess the severity of a disease, and/or the efficacy of a treatment and/or for the prognostic of a disease.It is used also to screen for Coeliac diseases, or in epidemiology.
3) Must respond to a dietary interventioni. Any dietary intervention should induce a
meaningful change in the marker (meaningful refers to 2.ii )
ii. Lifestyle changes (which may include
A gluten free diet improved the lactulose/mannitol ratio in patients with coeliac disease suggesting intestinal permeability had been decreased(211)
Before the test: 0.388, (0.062-0.804) n = 28,After the gluten-free diet: 0.085, (0.021-0.230) n = 19
47

changes in the diet) may also include a meaningful (meaningful refers to 2.ii ) change in the marker
A dietary supplement of either alanine/glutamine or zinc improved the lactulose/mannitol ratio in HIV patients (212)
Before the Zn supplement: 0.35 (0.16 -0.52) control: 0.29 (0.14 – 0.46)After the Zn supplement: 0.09 (0.08 -0.14)
Alanine/glutamine Before 0.02 (0 – 0.19) After control: 0.02 (0 – 0.24), n=17After die : 0.01 (0 – 0.41), n= 20
A probiotic mixture of S. thermophilus, L. bulgaricus, L. acidophilus and B. longum reduced significantly the lactulose/mannitol ratio from 0.038 (+ 0.024) to 0.023 (+ 0.020) in 30 IBS patients(213).
No report was found on effect of life-style on gut permeability as measured by the lactulose/mannitol ratio, but intensive sports activities are known to temporarily increase gut permeability.
48
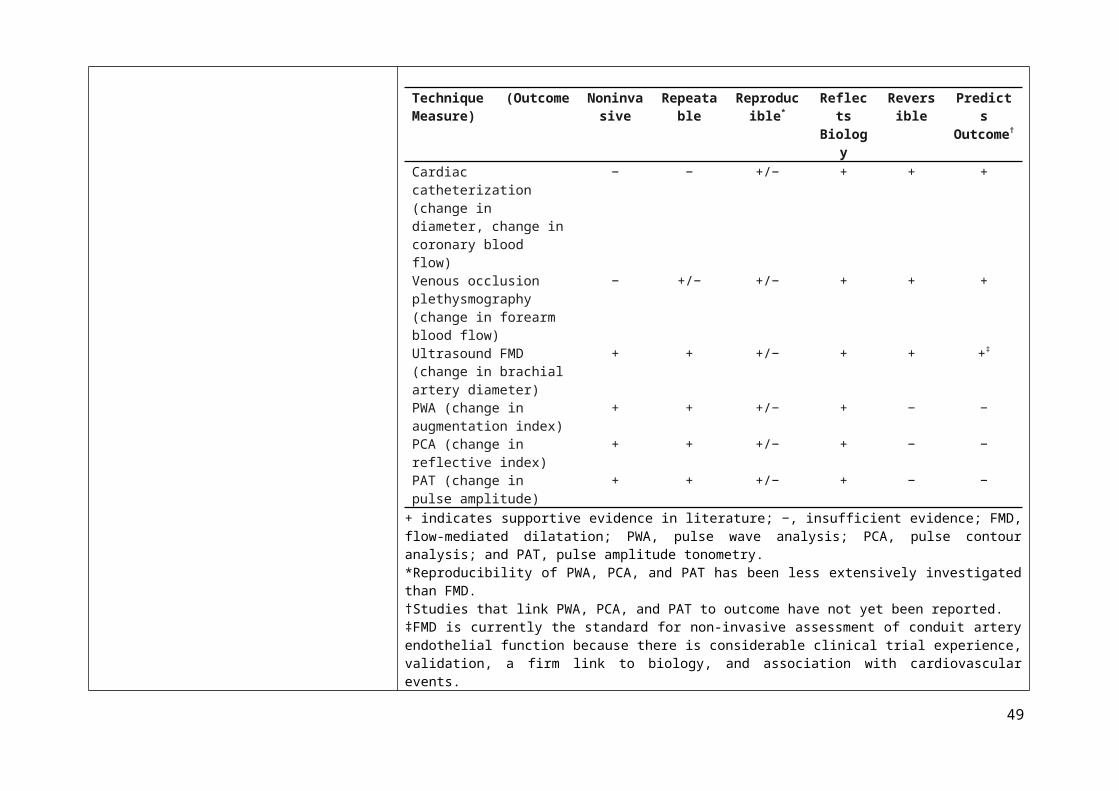
Specific field and related marker: Energetics/Obesity - Energy expenditure: Doubly labelled water
Criteria Identified at the workshop Comments1) Analytical aspectsi. A) Method should be validated according to
recognised guidelines.ii. This should include for example:
robustness, appropriate analytical sensitivity and specificity, reproducibility accuracy, quality assurance, standardization, traceability, stability (quality of the sample). These guidelines can be specific per marker, it apply equally well to biological markers, imaging, questionnaires, etc.
Doubly labelled water (DLW) refers to water (H2O) labelled with the heavy, non-radioactive forms of the elements deuterium and oxygen-18 (D2
18O). DLW can be used to determine metabolic rate (i.e. energy expenditure). This is done by administering a dose of DLW and then measuring the elimination rates of deuterium and 18O over time through the sampling of body water (e.g. saliva, urine, or blood). The minimum number of samples required is two, an initial sample after DLW intake when the isotopes have reached equilibrium in the body, and a second sample some time later. The time between the collecting of these samples depends on size of the animal involved.
Lifson et al. (1955)(214) first used stable isotope labelling to measure energy expenditure based on the exponential disappearance from the body of the stable isotopes ²H and 18O after a bolus dose of water labelled with both isotopes. The ²H is lost as water and the 18O both as water and CO2. After correction, the excess disappearance rate of 18O relative to ²H is a measure of the CO2 production rate. This rate can be converted to an estimate of total energy expenditure. The first application of this approach to humans was by Schoeller et al. (1982)(215). A review of existing data in 1999 provided the basis for validation of the method (216). The “gold standard” status of the method was confirmed in the 2001 FAO/WHO report on human energy requirements.
Although the sophistication of isotope ratio mass spectrometry provides a high level of precision, the limitation of the approach is the equation used to extrapolate energy expenditure from CO2 appearance, as burning fat or sugar produces different amounts of CO2 for the same amount of energy production. The Atwater energy equivalents of 16.7, 16.7 and 37.7 kJ/g of protein, carbohydrate and fat, respectively, are the standard values used. Therefore the precise contribution of different macronutrients, including alcohol, to energy expenditure will have an influence on the conversion rate of CO² to energy, and this “fuel mix” will differ in different physiological and pathological states(217, 218).
The FAO/WHO report on “Human energy requirements: where are we now? Issues emerging from the 2001 Expert Consultation on Energy in Human Nutrition”(219) stated that the DLW method is a gold standard. It mentions also that it could be used to assess energy intake as a surrogate marker when weight is stable. It reconfirmed the view that estimates of energy requirement refer to groups and not to the individual per se and that these recommendations for energy requirements of individuals are the mean of the group with no safe margin as with other nutrients.
The DLW technique has a reported precision of ± 3%; thus the method serves as a reference for validating other instruments or methods designed to measure energy expenditure.
49

The marker can be assessed in a wide range of individuals, from infancy to adulthood and the elderly, from underfed to overfed subjects, over lengthy time periods, usually between 4 and 21 days, which is advantageous for capturing habitual energy expenditure patterns. However, the cost of materials and expertise required to analyse the isotope concentrations via mass spectrometry prohibits the use of DLW in large epidemiological studies.
A typical study protocol using the DLW method starts with a urine collection before the dose to determine baseline values for the hydrogen and oxygen isotopes. The subject is given a single oral bolus dose of heavy water (D2
18O). Generally, adults are given a dose consisting of 0.15 g D218O /kg body weight and 0.06 g H2
18O/kg body weight. Children and neonates are given higher doses due to their faster water turnover rates. Following the administration of the dose, urine is collected during the observation period. Two study designs have been validated to measure energy expenditure. One protocol design extensively tested by Schoeller et al. is the two-point method, urine samples at the beginning and end of the observation period are used to determine the isotope elimination rates. Another protocol reported by Klein et al. (1984)(220) and Coward et al. (1985)(221), calculates the isotopic elimination rates from regression analysis of multiple samples collected periodically throughout the metabolic period rather than from just the initial and final samples. Recently, Coward has reported that the two methods give equivalent estimates of energy expenditure.
All urine samples should be collected in non-acidified plastic bottles. The urine should be aliquoted immediately into smaller plastic tubes (about 5 ml urine) and stored frozen (-20 °C) until analysis. It is preferable that plastic tubes which have been specifically designed for storage at low temperatures be used.
The long term reproducibility of fractionation turnover rates of H² and O18 has been reported recently to be within 1% and 5% respectively(222)
The marker has been validated against in-door calorimetry. Validation against direct calorimetry in a closed chamber: -14 to + 4%(223).
The DLW method provides an estimate of energy expenditure over a period of 10–20 days but it is not capable of discerning day-to-day changes(224). Regardless of the protocol design, a urine or saliva sample is collected within the first six hours to determine total body water (TBW). A second dose of doubly labelled water is administered at the end of the study period and urine or saliva collected after 3 to 6 hours for a second determination of TBW. DLW is the first technique to measure energy expenditure outside of direct or indirect calorimetric chambers.
50

2) Reflect/mark an endpointi. Significant association between marker
and endpoint in a target population
ii. Marker changes consistently with a change in the endpoint
Results of the DLW technique provide a measure of total energy expenditure and can be used to measure energy intake when weight is stable. However the macronutrient mix being used as a fuel can change over time, with physiological state and with illness or disease and this can impact the Respiratory Quotient.
O2 consumption and energy expenditure are correlated.
Inter-laboratory variability is “substantial”(225)
Intra-individual variability is 7.8 % (Schoeller et al., 1996)
The Table below summarises advantages and limitations of the doubly-labelled water technique.
3) Must respond to a dietary intervention i. Any dietary intervention should induce a
meaningful change in the marker (meaningful refers to 2.ii )
ii. Lifestyle changes (which may include changes in the diet) may also include a meaningful (meaningful refers to 2.ii ) change in the marker
Weight loss induced by dietary restriction decreased daily energy expenditure by 0.6±0.4 MJ in a group of 66 overweight people(226).A significant increase of resting energy expenditure was reported after overfeeding with protein intake in 25 young adults consuming either a low (5 %), normal (15%) or high (25 %) protein dietary supplement. With the 5 % supplement there was no significant change: mean = 0 – 1000 to + 2000 KJ/d), for the normal (-200 to + 4000 KJ/d ) and high (+ 1500 to + 3800 KJ/d) protein supplement there was a significant increase: mean + 2000 KJ/d, (n= 8)(227).Total energy expenditure (short sleep: 2589.2 ± 526.5 kcal/d; habitual sleep: 2611.1 ± 529.0 kcal/d; P = 0.832) did not differ significantly between sleep phases in a group of 30 subjects(228).
An energy intake restriction significantly reduced energy expenditure in normal subjects from 200 to 300 ± 100 Kcal/d (229).
Conclusions The measurement of O² consumption is useful in groups of subjects for a “long” period of time from 2 to 4 weeks, but not in individual, or for short (one day) periods.It is sensitive to the fat mass of people.It is the best method for free-living energy expenditure assessment.The main use is epidemiology, and energy intake assessment.
51

Table S9. Advantages and limitations of doubly-labelled water techniqueAdvantages Limitations
Provides an estimate of habitual TEE in free-living individuals Does not provide data on day-to-day changes in TEE
Provides an estimate of cumulative TEE over a period of time Does not provide data on the daily pattern of physical activity
Safe (non-radioactive) for studies in pregnancy, infancy and the elderly Stable isotope expensive and in short supply
Easy to administer to infants and the very elderly Analytical equipment and infrastructure expensive
Easy collection of samples (saliva or urine) for analysis
Easy sample storage and transport for analysis
Provides a measure of body composition of the subject
Can be used to estimate maternal breast milk output and milk consumption by
breastfed infants
52
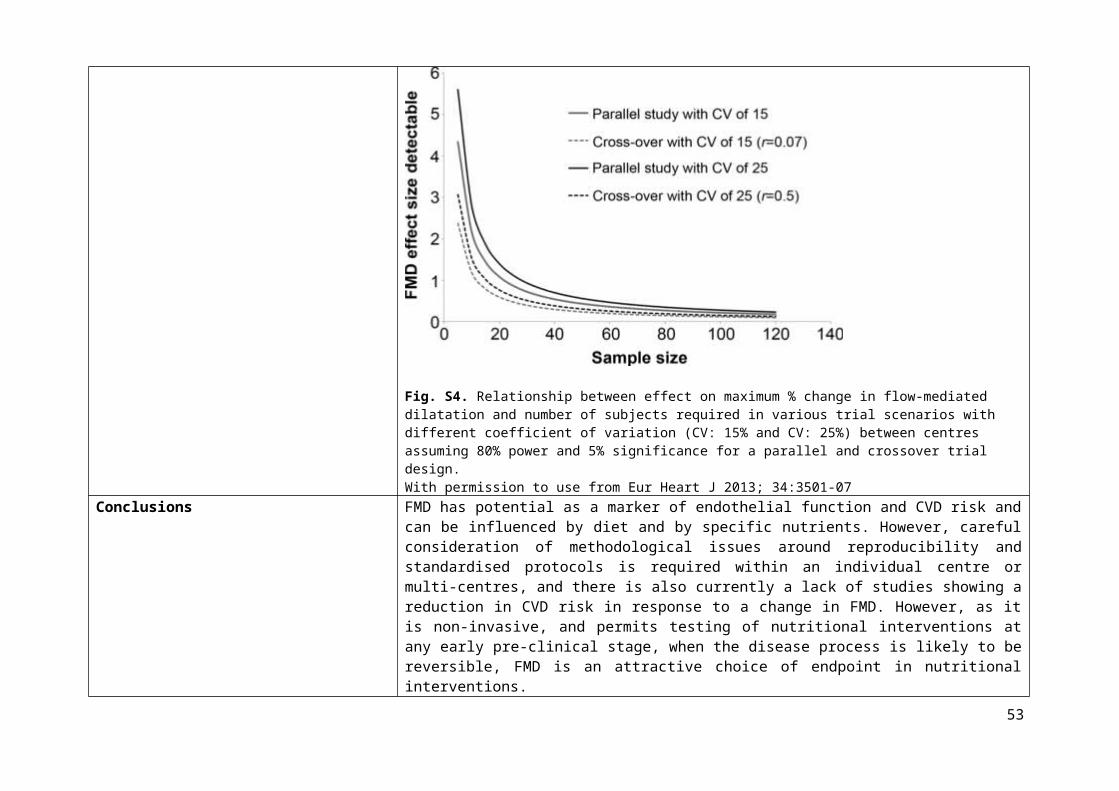
Reference List
1. Willett WC, Sampson L, Stampfer MJ, et al. (1985) Reproducibility and validity of a semiquantitative food frequency questionnaire. Am J Epidemiol 122, 51-65.
2. Block G, Hartman AM, Dresser CM, et al. (1986) A data-based approach to diet questionnaire design and testing. Am J Epidemiol 124, 453-469.
3. Bingham SA, Gill C, Welch A, et al. (1994) Comparison of dietary assessment methods in nutritional epidemiology: weighed records v. 24 h recalls, food-frequency questionnaires and estimated-diet records. Br J Nutr 72, 619-643.
4. Medical Research Council (2014) DAPA Toolkit. Available online at http://dapa-toolkit.mrc.ac.uk/. Accessed on 21 August 2015.
5. Brunner E, Juneja M & Marmot M (2001) Dietary assessment in Whitehall II: Comparison of 7 d diet diary and food-frequency questionnaire and validity against biomarkers. Br J Nutr 86, 405-414.
6. McKeown NM, Day NE, Welch AA, et al. (2001) Use of biological markers to validate self-reported dietary intake in a random sample of the European Prospective Investigation into Cancer United Kingdom Norfolk cohort. Am J Clin Nutr 74, 188-196.
7. Bingham SA, Welch AA, McTaggart A, et al. (2001) Nutritional methods in the European prospective investigation of cancer in Norfolk. Public Health Nutr 4, 847-858.
8. Bingham SA, Gill C, Welch A, et al. (1997) Validation of dietary assessment methods in the UK arm of EPIC using weighed records, and 24-hour urinary nitrogen and potassium and serum vitamin C and carotenoids as biomarkers. Int J Epidemiol 26, S137-S151.
9. Cade J, Thompson R, Burley V, et al. (2002) Development, validation and utilisation of food-frequency questionnairesa review. Public Health Nutr 5, 567-587.
10. Bingham S, Luben R, Welch A, et al. (2008) Associations between dietary methods and biomarkers, and between fruits and vegetables and risk of ischaemic heart disease, in the EPIC Norfolk Cohort Study. Int J Epidemiol 37, 978-987.
11. Vioque J, Weinbrenner T, Asensio L, et al. (2007) Plasma concentrations of carotenoids and vitamin C are better correlated with dietary intake in normal weight than overweight and obese elderly subjects. Br J Nutr 97, 977-986.
53

12. Miller JW, Garrod MG, Rockwood AL, et al. (2006) Measurement of total vitamin B12 and holotranscobalamin, singly and in combination, in screening for metabolic vitamin B12 deficiency. Clin Chem 52, 278-285.
13. Karmi O, Zayed A, Baraghethi S, et al. (2011) Measurement of vitamin B12 concentration: a review on available methods. IIOAB J 2, 23-32.
14. Herrmann W & Obeid R (2013) Utility and limitations of biochemical markers of vitamin B12 deficiency. Eur J Clin Invest 43, 231-237.
15. Oberley MJ & Yang DT (2013) Laboratory testing for cobalamin deficiency in megaloblastic anemia. Am J Hematol 88, 522-526.
16. Stabler SP (2013) Vitamin B12 deficiency. N Engl J Med 368, 149-160.
17. Amos RJ, Dawson DW, Fish DI, et al. (1994) Guidelines on the investigation and diagnosis of cobalamin and folate deficiencies. Clin Lab Haematol 16, 101-115.
18. Lindenbaum J, Savage DG, Stabler SP, et al. (1990) Diagnosis of cobalamin deficiency: II. Relative sensitivities of serum cobalamin, methylmalonic acid, and total homocysteine concentrations. Am J Hematol 34, 99-107.
19. Metz J, Bell AH, Flicker L, et al. (1996) The significance of subnormal serum vitamin B12 concentration in older people: a case control study. J Am Geriatr Soc 44, 1355-1361.
20. Moelby L, Rasmussen K, Jensen MK, et al. (1990) The relationship between clinically confirmed cobalamin deficiency and serum methylmalonic acid. J Intern Med 228, 373-378.
21. Norman EJ & Morrison JA (1993) Screening elderly populations for cobalamin (vitamin B12) deficiency using the urinary methylmalonic acid assay by gas chromatography mass spectrometry. Am J Med 94, 589-594.
22. Snow CF (1999) Laboratory diagnosis of vitamin B12 and folate deficiency: a guide for the primary care physician. Arch Intern Med 159, 1289-1298.
23. Allen LH (2012) Vitamin B-12. Adv Nutr 3, 54-55.
24. Hughes CF, Ward M, Hoey L, et al. (2013) Vitamin B12 and ageing: current issues and interaction with folate. Ann Clin Biochem 50, 315-329.
25. Hoey L, Strain JJ & McNulty H (2009) Studies of biomarker responses to intervention with vitamin B-12: a systematic review of randomized controlled trials. Am J Clin Nutr 89, 1981S-1996S.
54

26. Siev M, Yu X, Prados-Rosales R, et al. (2011) Correlation between serum and plasma antibody titers to mycobacterial antigens. Clin Vaccine Immunol 18, 173-175.
27. Nauta JJ, Beyer WE & Osterhaus AD (2009) On the relationship between mean antibody level, seroprotection and clinical protection from influenza. Biologicals 37, 216-221.
28. Fulop T, Pawelec G, Castle S, et al. (2009) Immunosenescence and vaccination in nursing home residents. Clin Infect Dis 48, 443-448.
29. Goodwin K, Viboud C & Simonsen L (2006) Antibody response to influenza vaccination in the elderly: a quantitative review. Vaccine 24, 1159-1169.
30. Agarwal S & Busse PJ (2010) Innate and adaptive immunosenescence. Ann Allergy Asthma Immunol 104, 183-190.
31. Pawelec G, Larbi A & Derhovanessian E (2010) Senescence of the human immune system. J Comp Pathol 142, S39-S44.
32. Albers R, Antoine JM, Bourdet-Sicard R, et al. (2005) Markers to measure immunomodulation in human nutrition intervention studies. Br J Nutr 94, 452-481.
33. Albers R, Bourdet-Sicard R, Braun D, et al. (2013) Monitoring immune modulation by nutrition in the general population: identifying and substantiating effects on human health. Br J Nutr 110, S1-S30.
34. Lomax AR & Calder PC (2009) Prebiotics, immune function, infection and inflammation: a review of the evidence. Br J Nutr 101, 633-658.
35. Lomax AR & Calder PC (2009) Probiotics, immune function, infection and inflammation: a review of the evidence from studies conducted in humans. Curr Pharm Des 15, 1428-1518.
36. Maidens C, Childs C, Przemska A, et al. (2013) Modulation of vaccine response by concomitant probiotic administration. Br J Clin Pharmacol 75, 663-670.
37. Boge T, Rémigy M, Vaudaine S, et al. (2009) A probiotic fermented dairy drink improves antibody response to influenza vaccination in the elderly in two randomised controlled trials. Vaccine 27, 5677-5684.
38. Langkamphenken B, Wood SM, Herlinger-Garcia KA, et al. (2006) Nutritional formula improved immune profiles of seniors living in nursing homes. J Am Geriatr Soc 54, 1861-1870.
55

39. Langkampenken B, Bender BS, Gardner EM, et al. (2004) Nutritional formula enhanced immune function and reduced days of symptoms of upper respiratory tract infection in seniors. J Am Geriatr Soc 52, 3-12.
40. US Food and Drug Administration (2014) Guidance for Industry - Review Criteria for Assessment of C Reactive Protein (CRP), High Sensitivity C-Reactive Protein (hsCRP) and Cardiac C-Reactive Protein (cCRP) Assays.
41. Ridker PM, Buring JE, Shih J, et al. (1998) Prospective study of C-reactive protein and the risk of future cardiovascular events among apparently healthy women. Circulation 98, 731-733.
42. Ridker PM, Buring JE, Shih J, et al. (1998) C-reactive protein adds to the predictive value of total and HDL cholesterol in determining risk of first myocardial infarction. Circulation 97, 2007-2011.
43. Ridker PM, Rifai N, Rose L, et al. (2002) Comparison of C-reactive protein and low-density lipoprotein cholesterol levels in the prediction of first cardiovascular events. N Engl J Med 347, 1557-1565.
44. Pearson TA, Mensah GA, Alexander RW, et al. (2003) Markers of inflammation and cardiovascular disease application to clinical and public health practice: a statement for healthcare professionals from the centers for disease control and prevention and the American Heart Association. Circulation 107, 499-511.
45. Oda E, Oohara K, Abe A, et al. (2006) The optimal cut-off point of C-reactive protein as an optional component of metabolic syndrome in Japan. Circ J 70, 384-388.
46. Ridker PM, Glynn RJ & Hennekens CH (1998) C-reactive protein adds to the predictive value of total and HDL cholesterol in determining risk of first myocardial infarction. Circulation 97, 2007-2011.
47. Boon N, Boyle R, Bradbury K, et al. (2014) Joint British Societies' consensus recommendations for the prevention of cardiovascular disease (JBS3). Heart 100, ii1-ii67.
48. Shah T, Casas JP, Cooper JA, et al. (2009) Critical appraisal of CRP measurement for the prediction of coronary heart disease events: new data and systematic review of 31 prospective cohorts. Int J Epidemiol 38, 217-231.
49. Ballou S, Lozanski G, Hodder SAL, et al. (1996) Quantitative and qualitative alterations of acute-phase proteins in healthy elderly persons. Age Ageing 25, 224-230.
50. Harris TB, Ferrucci L, Tracy RP, et al. (1999) Associations of elevated interleukin-6 and C-reactive protein levels with mortality in the elderly. Am J Med 106, 506-512.
56

51. Reuben DB, Cheh AI, Harris TB, et al. (2002) Peripheral blood markers of inflammation predict mortality and functional decline in highfunctioning communitydwelling older persons. J Am Geriatr Soc 50, 638-644.
52. Cook DG, Mendall MA, Whincup PH, et al. (2000) C-reactive protein concentration in children: relationship to adiposity and other cardiovascular risk factors. Atherosclerosis 149, 139-150.
53. Visser M, Bouter LM, McQuillan GM, et al. (1999) Elevated C-reactive protein levels in overweight and obese adults. JAMA 282, 2131-2135.
54. Calder PC, Ahluwalia N, Brouns F, et al. (2011) Dietary factors and low-grade inflammation in relation to overweight and obesity. Br J Nutr 106, S1-S78.
55. Heilbronn LK & Clifton PM (2002) C-reactive protein and coronary artery disease: influence of obesity, caloric restriction and weight loss. J Nutr Biochem 13, 316-321.
56. Johnson JB, Summer W, Cutler RG, et al. (2007) Alternate day calorie restriction improves clinical findings and reduces markers of oxidative stress and inflammation in overweight adults with moderate asthma. Free Radic Biol Med 42, 665-674.
57. Madsen EL, Rissanen A, Bruun JM, et al. (2008) Weight loss larger than 10% is needed for general improvement of levels of circulating adiponectin and markers of inflammation in obese subjects: a 3-year weight loss study. Eur J Endocrinol 158, 179-187.
58. Plat J, Jellema A, Ramakers J, et al. (2007) Weight loss, but not fish oil consumption, improves fasting and postprandial serum lipids, markers of endothelial function, and inflammatory signatures in moderately obese men. J Nutr 137, 2635-2640.
59. Lakka TA, Lakka HM, Rankinen T, et al. (2005) Effect of exercise training on plasma levels of C-reactive protein in healthy adults: the HERITAGE Family Study. Eur Heart J 26, 2018-2025.
60. Milani RV, Lavie CJ & Mehra MR (2004) Reduction in C-reactive protein through cardiac rehabilitation and exercise training. J Am Coll Cardiol 43, 1056-1061.
61. Rey A (1964) L'examen clinique en psychologie: Paris: Presses universitaires de France.
62. Wechsler D, Pearson Education I & PsychCorp (Firm) (2009) WMS-IV.: Wechsler Memory Scale-fourth Edition. Administration and scoring manual: Psychological Corporation.
63. Wilson BA, Cockburn J, Baddeley AD, Thames Valley Test Company & Thames Valley Test Company Staff (2003) The Rivermead Behavioural Memory Test: II: Manual, Third ed. Bury St Edmunds: Thames Valley Test Company.
57

64. Poirier M & Saint-Aubin J (1995) Memory for related and unrelated words: Further evidence on the influence of semantic factors in immediate serial recall. Q J Exp Psychol A 48, 384-404.
65. Folstein MF, Folstein SE & McHugh PR (1975) "Mini-mental state": a practical method for grading the cognitive state of patients for the clinician. J Psychiatr Res 12, 189-198.
66. Singh-Manoux A, Kivimaki M, Glymour MM, et al. (2012) Timing of onset of cognitive decline: results from Whitehall II prospective cohort study. BMJ 344, d7622.
67. Delis D, Kramer J, Kaplan E & Ober B (1993) The California Verbal Learning Test for Children. San Antonio: The Psychological Corporation.
68. Wilson B, Ivani-Chalian C & Aldrich F (1991) Rivermead Behavioural Memory Test for Children. Bury St. Edmunds: Thames Valley Test Company.
69. Park DC, Lautenschlager G, Hedden T, et al. (2002) Models of visuospatial and verbal memory across the adult life span. Psychol Aging 17, 299.
70. Vadikolias K, Tsiakiri-Vatamidis A, Tripsianis G, et al. (2012) Mild cognitive impairment: effect of education on the verbal and nonverbal tasks performance decline. Brain Behav 2, 620-627.
71. Rapport LJ, Axelrod BN, Theisen ME, et al. (1997) Relationship of IQ to verbal learning and memory: test and retest. J Clin Exp Neuropsychol 19, 655-666.
72. Kramer JH, Yaffe K, Lengenfelder J, et al. (2003) Age and gender interactions on verbal memory performance. J Int Neuropsychol Soc 9, 97-102.
73. Powell MR, Smith GE, Knopman DS, et al. (2006) Cognitive measures predict pathologic Alzheimer disease. Arch Neurol 63, 865-868.
74. Hedden T & Park D (2001) Aging and interference in verbal working memory. Psychol Aging 16, 666.
75. Gathercole SE, Service E, Hitch GJ, et al. (1999) Phonological short-term memory and vocabulary development: further evidence on the nature of the relationship. Appl Cogn Psychol 13, 65-77.
76. Miller GA (1956) The magical number seven, plus or minus two: some limits on our capacity for processing information. Psychol Rev 63, 81.
58

77. Kreijkamp-Kaspers S, Kok L, Grobbee DE, et al. (2004) Effect of soy protein containing isoflavones on cognitive function, bone mineral density, and plasma lipids in postmenopausal women: a randomized controlled trial. JAMA 292, 65-74.
78. Foster JK, Lidder PG & Sünram SI (1998) Glucose and memory: fractionation of enhancement effects? Psychopharmacology 137, 259-270.
79. Kaplan RJ, Greenwood CE, Winocur G, et al. (2000) Cognitive performance is associated with glucose regulation in healthy elderly persons and can be enhanced with glucose and dietary carbohydrates. Am J Clin Nutr 72, 825-836.
80. Yamamoto N, Yamanaka G, Takasugi E, et al. (2009) Lifestyle intervention reversed cognitive function in aged people with diabetes mellitus: two-year follow up. Diabetes Res Clin Pract 85, 343-346.
81. Sarter M, Givens B & Bruno JP (2001) The cognitive neuroscience of sustained attention: where top-down meets bottom-up. Brain Res Rev 35, 146-160.
82. Manly T, Robertson IH, Galloway M, et al. (1999) The absent mind: further investigations of sustained attention to response. Neuropsychologia 37, 661-670.
83. Rosvold HE, Mirsky AF, Sarason I, et al. (1956) A continuous performance test of brain damage. J Consult Psychol 20, 343-350.
84. Wesnes K & Warburton DM (1984) Effects of scopolamine and nicotine on human rapid information processing performance. Psychopharmacology 82, 147-150.
85. Wesnes K, Simmons D, Rook M, et al. (1987) A doubleblind placebocontrolled trial of tanakan in the treatment of idiopathic cognitive impairment in the elderly. Hum Psychopharmacol 2, 159-169.
86. Teichner WH (1974) The detection of a simple visual signal as a function of time of watch. Hum Factors 16, 339-352.
87. Robertson IH, Manly T, Andrade J, et al. (1997) Oops!': performance correlates of everyday attentional failures in traumatic brain injured and normal subjects. Neuropsychologia 35, 747-758.
88. Klee SH & Garfinkel BD (1983) The computerized continuous performance task: A new measure of inattention. J Abnorm Child Psychol 11, 487-495.
89. Fray PJ, Robbins TW & Sahakian BJ (1996) Neuorpsychiatyric applications of CANTAB. Int J Geriatr Psychiatry 11, 329-336.
59

90. Brice C & Smith A (2001) The effects of caffeine on simulated driving, subjective alertness and sustained attention. Hum Psychopharmacol 16, 523-531.
91. Edkins GD & Pollock CM (1997) The influence of sustained attention on railway accidents. Accid Anal Prev 29, 533-539.
92. Tucker P (2003) The impact of rest breaks upon accident risk, fatigue and performance: a review. Work Stress 17, 123-137.
93. Reay JL, Kennedy DO & Scholey AB (2006) Effects of Panax ginseng, consumed with and without glucose, on blood glucose levels and cognitive performance during sustained 'mentally demanding' tasks. J Psychopharmacol 20, 771-781.
94. Foxe JJ, Morie KP, Laud PJ, et al. (2012) Assessing the effects of caffeine and theanine on the maintenance of vigilance during a sustained attention task. Neuropharmacology 62, 2320-2327.
95. Scholey AB, French SJ, Morris PJ, et al. (2009) Consumption of cocoa flavanols results in acute improvements in mood and cognitive performance during sustained mental effort. J Psychopharmacol. 24, 1505-1514.
96. Allen AP, Jacob TJ & Smith AP (2014) Effects and after-effects of chewing gum on vigilance, heart rate, EEG and mood. Physiol Behav. 133, 244-251.
97. Johnson AJ, Muneem M & Miles C (2013) Chewing gum benefits sustained attention in the absence of task degradation. Nutr Neurosci 16, 153-159.
98. Duffy R, Wiseman H & File SE (2003) Improved cognitive function in postmenopausal women after 12 weeks of consumption of a soya extract containing isoflavones. Pharmacol Biochem Behav 75, 721-729.
99. Hasenfratz M & B+ñttig K (1994) Acute dose-effect relationships of caffeine and mental performance, EEG, cardiovascular and subjective parameters. Psychopharmacology 114, 281-287.
100. Hasenfratz M & Bättig K (1992) Action profiles of smoking and caffeine: Stroop effect, EEG, and peripheral physiology. Pharmacol Biochem Behav 42, 155-161.
101. Warburton DM (1995) Effects of caffeine on cognition and mood without caffeine abstinence. Psychopharmacology 119, 66-70.
102. Rees K, Allen D & Lader M (1999) The influences of age and caffeine on psychomotor and cognitive function. Psychopharmacology 145, 181-188.
60
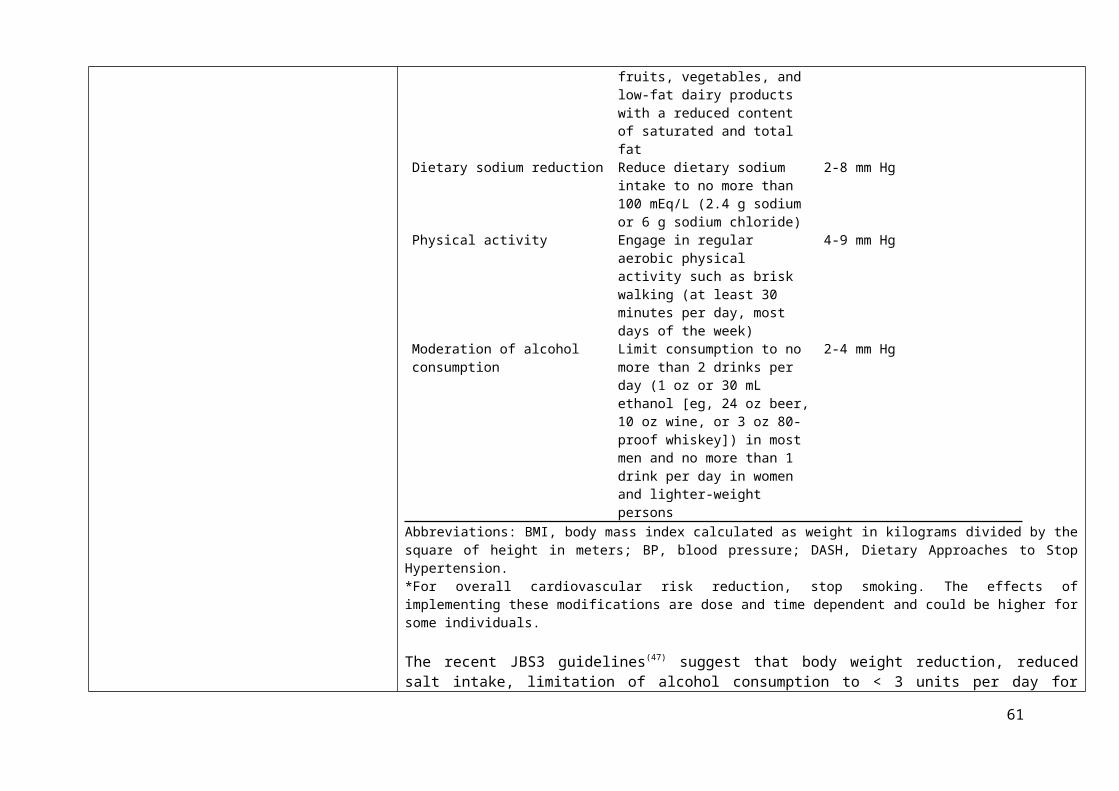
103. Smit HJ & Rogers PJ (2000) Effects of low doses of caffeine on cognitive performance, mood and thirst in low and higher caffeine consumers. Psychopharmacology 152, 167-173.
104. Yeomans MR, Ripley T, Davies LH, et al. (2002) Effects of caffeine on performance and mood depend on the level of caffeine abstinence. Psychopharmacology 164, 241-249.
105. James JE & Rogers PJ (2005) Effects of caffeine on performance and mood: withdrawal reversal is the most plausible explanation. Psychopharmacology 182, 1-8.
106. Maridakis V, Herring MP & O'Connor PJ (2009) Sensitivity to change in cognitive performance and mood measures of energy and fatigue in response to differing doses of caffeine or breakfast. Int J Neurosci 119, 975-994.
107. Haskell CF, Kennedy DO, Milne AL, et al. (2008) The effects of L-theanine, caffeine and their combination on cognition and mood. Biol Psychol 77, 113-122.
108. Owen GN, Parnell H, De Bruin EA, et al. (2008) The combined effects of L-theanine and caffeine on cognitive performance and mood. Nutr Neurosci 11, 193-198.
109. Maridakis V, Herring MP & O'Connor PJ (2009) Sensitivity to change in cognitive performance and mood measures of energy and fatigue in response to morning caffeine alone or in combination with carbohydrate. Int J Neurosci 119, 1239-1258.
110. Smith A, Kendrick A & Maben A (1992) Use and effects of food and drinks in relation to daily rhythms of mood and cognitive performance Effects of caffeine, lunch and alcohol on human performance, mood and cardiovascular function. Proc Nutr Soc 51, 325-333.
111. Smith A, Kendrick A, Maben A, et al. (1994) Effects of breakfast and caffeine on cognitive performance, mood and cardiovascular functioning. Appetite 22, 39-55.
112. Smith A, Whitney H, Thomas M, et al. (1997) Effects of caffeine and noise on mood, performance and cardiovascular functioning. Hum Psychopharmacol 12, 27-33.
113. Smith A, Sturgess W & Gallagher J (1999) Effects of a low dose of caffeine given in different drinks on mood and performance. Hum Psychopharmacol 14, 473-482.
114. Smith A, Brice C, Nash J, et al. (2003) Caffeine and central noradrenaline: effects on mood, cognitive performance, eye movements and cardiovascular function. J Psychopharmacol 17, 283-292.
61

115. Smith A, Sutherland D & Christopher G (2005) Effects of repeated doses of caffeine on mood and performance of alert and fatigued volunteers. J Psychopharmacol 19, 620-626.
116. Smith A (2009) Effects of caffeine in chewing gum on mood and attention. Hum Psychopharmacol 24, 239-247.
117. Smith AP, Christopher G & Sutherland D (2006) Effects of caffeine in overnight-withdrawn consumers and non-consumers. Nutr Neurosci 9, 63-71.
118. Smith AP, Kendrick AM & Maben AL (1992) Effects of breakfast and caffeine on performance and mood in the late morning and after lunch. Neuropsychobiology 26, 198-204.
119. Christopher G, Sutherland D & Smith A (2005) Effects of caffeine in non-withdrawn volunteers. Hum Psychopharmacol 20, 47-53.
120. Hewlett P & Smith A (2006) Acute effects of caffeine in volunteers with different patterns of regular consumption. Hum Psychopharmacol 21, 167-180.
121. Hewlett P & Smith A (2007) Effects of repeated doses of caffeine on performance and alertness: new data and secondary analyses. Hum Psychopharmacol 22, 339-350.
122. Kelemen WL & Creeley CE (2001) Caffeine (4 mg/kg) influences sustained attention and delayed free recall but not memory predictions. Hum Psychopharmacol 16, 309-319.
123. Tieges Z, Snel J, Kok A, et al. (2009) Caffeine does not modulate inhibitory control. Brain Cogn 69, 316-327.
124. Haskell CF, Kennedy DO, Wesnes KA, et al. (2005) Cognitive and mood improvements of caffeine in habitual consumers and habitual non-consumers of caffeine. Psychopharmacology 179, 813-825.
125. Green DJ, Dawson EA, Groenewoud HM, et al. (2014) Is flow-mediated dilation nitric oxide mediated? A meta-analysis. Hypertension 63, 376-382.
126. Corretti MC, Anderson TJ, Benjamin EJ, et al. (2002) Guidelines for the ultrasound assessment of endothelial-dependent flow-mediated vasodilation of the brachial artery: a report of the International Brachial Artery Reactivity Task Force. J Am Coll Cardiol 39, 257-265.
127. Thijssen DH, Black MA, Pyke KE, et al. (2011) Assessment of flow-mediated dilation in humans: a methodological and physiological guideline. Am J Physiol Heart Circ Physiol 300, H2-H12.
62

128. Al-Qaisi M, Kharbanda RK, Mittal TK, et al. (2008) Measurement of endothelial function and its clinical utility for cardiovascular risk. Vasc Health Risk Manag 4, 647-652.
129. McCall DO, McKinley MC, Noad R, et al. (2011) The assessment of vascular function during dietary intervention trials in human subjects. Br J Nutr 106, 981-994.
130. Charakida M, de Groot E, Loukogeorgakis SP, et al. (2013) Variability and reproducibility of flow-mediated dilatation in a multicentre clinical trial. Eur Heart J 34, 3501-3507.
131. Ghiadoni L, Faita F, Salvetti M, et al. (2012) Assessment of flow-mediated dilation reproducibility: a nationwide multicenter study. J Hypertens 30, 1399-1405.
132. Deanfield JE, Halcox JP & Rabelink TJ (2007) Endothelial function and dysfunction testing and clinical relevance. Circulation 115, 1285-1295.
133. Inaba Y, Chen JA & Bergmann SR (2010) Prediction of future cardiovascular outcomes by flow-mediated vasodilatation of brachial artery: a meta-analysis. Int J Cardiovasc Imaging 26, 631-640.
134. Ras RT, Streppel MT, Draijer R, et al. (2013) Flow-mediated dilation and cardiovascular risk prediction: a systematic review with meta-analysis. Int J Cardiol 168, 344-351.
135. Peters SA, den Ruijter HM & Bots ML (2012) The incremental value of brachial flow-mediated dilation measurements in risk stratification for incident cardiovascular events: a systematic review. Ann Med 44, 305-312.
136. Yeboah J, Folsom AR, Burke GL, et al. (2009) Predictive value of brachial flow-mediated dilation for incident cardiovascular events in a population-based study the multi-ethnic study of atherosclerosis. Circulation 120, 502-509.
137. Egert S & Stehle P (2011) Impact of n3 fatty acids on endothelial function: results from human interventions studies. Curr Opin Clin Nutr Metab Care 14, 121-131.
138. Chong MFF, Macdonald R & Lovegrove JA (2010) Fruit polyphenols and CVD risk: a review of human intervention studies. Br J Nutr 104, S28-S39.
139. Basu A, Rhone M & Lyons TJ (2010) Berries: emerging impact on cardiovascular health. Nutr Rev 68, 168-177.
140. Beavers DP, Beavers KM, Miller M, et al. (2012) Exposure to isoflavone-containing soy products and endothelial function: A Bayesian meta-analysis of randomized controlled trials. Nutr Metab Cardiovasc Dis 22, 182-191.
63

141. Kay CD, Hooper L, Kroon PA, et al. (2012) Relative impact of flavonoid composition, dose and structure on vascular function: A systematic review of randomised controlled trials of flavonoidrich food products. Mol Nutr Food Res 56, 1605-1616.
142. Moore RJ, Jackson KG & Minihane AM (2009) Green tea (Camellia sinensis) catechins and vascular function. Br J Nutr 102, 1790-1802.
143. Ras RT, Zock PL & Draijer R (2011) Tea consumption enhances endothelial-dependent vasodilation; a meta-analysis. PloS one 6, e16974.
144. Dickinson KM, Clifton PM & Keogh JB (2014) A reduction of 3 g/day from a usual 9 g/day salt diet improves endothelial function and decreases endothelin-1 in a randomised cross-over study in normotensive overweight and obese subjects. Atherosclerosis 233, 32-38.
145. Stephens JW, Khanolkar MP & Bain SC (2009) The biological relevance and measurement of plasma markers of oxidative stress in diabetes and cardiovascular disease. Atherosclerosis 202, 321-329.
146. Liu W, Morrow JD & Yin H (2009) Quantification of F2-isoprostanes as a reliable index of oxidative stress in vivo using gas chromatographymass spectrometry (GC-MS) method. Free Radic Biol Med 47, 1101-1107.
147. Milne GL, Yin H, Brooks JD, et al. (2007) Quantification of F2Isoprostanes in Biological Fluids and Tissues as a Measure of Oxidant Stress. Methods Enzymol 433, 113-126.
148. Davies SS & Roberts II LJ (2011) F2 isoprostanes as an indicator and risk factor for coronary heart disease. Free Radic Biol Med 50, 559-566.
149. Dorjgochoo T, Gao YT, Chow WH, et al. (2012) Major metabolite of F2-isoprostane in urine may be a more sensitive biomarker of oxidative stress than isoprostane itself. Am J Clin Nutr 96, 405-414.
150. Petrosino JM, DiSilvestro D & Ziouzenkova O (2014) Aldehyde dehydrogenase 1A1: friend or foe to female metabolism? Nutrients 6, 950-973.
151. Chobanian AV, Bakris GL, Black HR, et al. (2003) The seventh report of the joint national committee on prevention, detection, evaluation, and treatment of high blood pressure: the JNC 7 report. JAMA 289, 2560-2571.
152. National Institute for Health and Care Excellence (2011) Hypertension: Clinical management of primary hypertension in adults.
64

153. Law MR, Morris JK & Wald NJ (2009) Use of blood pressure lowering drugs in the prevention of cardiovascular disease: meta-analysis of 147 randomised trials in the context of expectations from prospective epidemiological studies. BMJ 338, 1-19.
154. Lewington S FAU - Clarke R, Clarke RF, Qizilbash NF, et al. (2002) Age-specific relevance of usual blood pressure to vascular mortality: a meta-analysis of individual data for one million adults in 61 prospective studies. Lancet 360, 1903-1913.
155. Dickinson HO, Mason JM, Nicolson DJ, et al. (2006) Lifestyle interventions to reduce raised blood pressure: a systematic review of randomized controlled trials. J Hypertens 24, 215-233.
156. Scalbert A, Brennan L, Fiehn O, et al. (2009) Mass-spectrometry-based metabolomics: limitations and recommendations for future progress with particular focus on nutrition research. Metabolomics 5, 435-458.
157. Fiehn O, Garvey WT, Newman JW, et al. (2010) Plasma metabolomic profiles reflective of glucose homeostasis in non-diabetic and type 2 diabetic obese African-American women. PloS one 5, e15234.
158. Gall WE, Beebe K, Lawton KA, et al. (2010) -hydroxybutyrate is an early biomarker of insulin resistance and glucose intolerance in a nondiabetic population. PloS one 5, e10883.
159. Suhre K, Meisinger C, Dõring A, et al. (2010) Metabolic footprint of diabetes: a multiplatform metabolomics study in an epidemiological setting. PloS one 5, e13953.
160. Wang TJ, Larson MG, Vasan RS, et al. (2011) Metabolite profiles and the risk of developing diabetes. Nat Med 17, 448-453.
161. Menni C, Fauman E, Erte I, et al. (2013) Biomarkers for type 2 diabetes and impaired fasting glucose using a non-targeted metabolomics approach. Diabetes 62, 4270-4276.
162. Xu F, Tavintharan S, Sum CF, et al. (2013) Metabolic signature shift in type 2 diabetes mellitus revealed by mass spectrometry-based metabolomics. J Clin Endocrinol Metab 98, E1060-E1065.
163. Shaham O, Wei R, Wang TJ, et al. (2008) Metabolic profiling of the human response to a glucose challenge reveals distinct axes of insulin sensitivity. Mol Syst Biol 4, 214.
164. Laferrère B, Reilly D, Arias S, et al. (2011) Differential metabolic impact of gastric bypass surgery versus dietary intervention in obese diabetic subjects despite identical weight loss. Sci Transl Med 3, 80re2.
165. Lindqvist A, Spégel P, Ekelund M, et al. (2013) Effects of ingestion routes on hormonal and metabolic profiles in gastric-bypassed humans. J Clin Endocrinol Metab 98, E856-E861.
65

166. Lien LF, Haqq AM, Arlotto M, et al. (2009) The STEDMAN project: biophysical, biochemical and metabolic effects of a behavioral weight loss intervention during weight loss, maintenance, and regain. Omics 13, 21-35.
167. Bakker GC, Van Erk MJ, Pellis L, et al. (2010) An antiinflammatory dietary mix modulates inflammation and oxidative and metabolic stress in overweight men: a nutrigenomics approach. Am J Clin Nutr 91, 1044-1059.
168. Shah SH, Crosslin DR, Haynes CS, et al. (2012) Branched-chain amino acid levels are associated with improvement in insulin resistance with weight loss. Diabetologia 55, 321-330.
169. DePristo MA, Banks E, Poplin R, et al. (2011) A framework for variation discovery and genotyping using next-generation DNA sequencing data. Nat Genet 43, 491-498.
170. Kwak JH, Paik JK, Kim OY, et al. (2011) FADS gene polymorphisms in Koreans: association with ω6 polyunsaturated fatty acids in serum phospholipids, lipid peroxides, and coronary artery disease. Atherosclerosis 214, 94-100.
171. Schaeffer L, Gohlke H, Müller M, et al. (2006) Common genetic variants of the FADS1 FADS2 gene cluster and their reconstructed haplotypes are associated with the fatty acid composition in phospholipids. Hum Mol Genet 15, 1745-1756.
172. Dumont J, Huybrechts I, Spinneker A, et al. (2011) FADS1 Genetic Variability Interacts with Dietary -Linolenic Acid Intake to Affect Serum Non-HDLCholesterol Concentrations in European Adolescents. J Nutr 141, 1247-1253.
173. Berenson GS, Srinivasan SR, Bao W, et al. (1998) Association between multiple cardiovascular risk factors and atherosclerosis in children and young adults. N Engl J Med 338, 1650-1656.
174. Harris WS (1997) n-3 fatty acids and serum lipoproteins: human studies. Am J Clin Nutr 65, 1645S-1654S.
175. Kark JD, Kaufmann NA, Binka F, et al. (2003) Adipose tissue n6 fatty acids and acute myocardial infarction in a population consuming a diet high in polyunsaturated fatty acids. Am J Clin Nutr 77, 796-802.
176. Kiecolt-Glaser JK, Belury MA, Porter K, et al. (2007) Depressive symptoms, omega-6: omega-3 fatty acids, and inflammation in older adults. Psychosom Med 69, 217-224.
177. Lauritzen L, Hansen HS, Jørgensen M, et al. (2001) The essentiality of long chain n-3 fatty acids in relation to development and function of the brain and retina. Prog Lipid Res 40, 1-94.
178. Martinelli N, Girelli D, Malerba G, et al. (2008) FADS genotypes and desaturase activity estimated by the ratio of arachidonic acid to linoleic acid are associated with inflammation and coronary artery disease. Am J Clin Nutr 88, 941-949.
66

179. Cormier H, Rudkowska I, Paradis AM, et al. (2012) Association between polymorphisms in the fatty acid desaturase gene cluster and the plasma triacylglycerol response to an n-3 PUFA supplementation. Nutrients 4, 1026-1041.
180. Standl M, Lattka E, Stach B, et al. (2012) FADS1 FADS2 gene cluster, PUFA intake and blood lipids in children: results from the GINIplus and LISAplus studies. PloS one 7, e37780.
181. Zietemann V, Kröger J, Enzenbach C, et al. (2010). Br J Nutr 104, 1748-1759.
182. Baylin A & Campos H (2004) Arachidonic acid in adipose tissue is associated with nonfatal acute myocardial infarction in the central valley of Costa Rica. J Nutr 134, 3095-3099.
183. Duchén K & Björkstén B (2001) Polyunsaturated n-3 fatty acids and the development of atopic disease. Lipids 36, 1033-1042.
184. Al-Hilal M, AlSaleh A, Maniou Z, et al. (2013) Genetic variation at the FADS1-FADS2 gene locus influences delta-5 desaturase activity and LC-PUFA proportions after fish oil supplement. J Lipid Res 54, 542-551.
185. Gillingham LG, Harding SV, Rideout TC, et al. (2013) Dietary oils and FADS1-FADS2 genetic variants modulate [13C] -linolenic acid metabolism and plasma fatty acid composition. Am J Clin Nutr 97, 195-207.
186. Lu Y, Feskens EJ, Dollé ME, et al. (2010) Dietary n3 and n-6 polyunsaturated fatty acid intake interacts with FADS1 genetic variation to affect total and HDL-cholesterol concentrations in the Doetinchem Cohort Study. Am J Clin Nutr 92, 258-265.
187. Moltó-Puigmartí C, Plat J, Mensink RP, et al. (2010) FADS1 FADS2 gene variants modify the association between fish intake and the docosahexaenoic acid proportions in human milk. Am J Clin Nutr 91, 1368-1376.
188. Porenta SR, Ko YA, Raskin L, et al. (2013) Interaction of fatty acid genotype and diet on changes in colonic fatty acids in a Mediterranean diet intervention study. Cancer Prev Res 6, 1212-1221.
189. Kris-Etherton PM, Harris WS & Appel LJ (2003) Fish consumption, fish oil, omega-3 fatty acids, and cardiovascular disease. Arterioscler Thromb Vasc Biol 23, e20-e30.
190. Calder PC (2006) n3 polyunsaturated fatty acids, inflammation, and inflammatory diseases. Am J Clin Nutr 83, S1505- S1519.
191. Innis SM (2007) Dietary (n-3) fatty acids and brain development. J Nutr 137, 855-859.
192. Bijlsma PB, Peeters RA, Groot JA, et al. (1995) Differential in vivo and in vitro intestinal permeability to lactulose and mannitol in animals and humans: a hypothesis. Gastroenterology 108, 687-696.
67

193. Menzies IS, Mount JN & Wheeler MJ (1978) Quantitative estimation of clinically important monosaccharides in plasma by rapid thin layer chromatography. Ann Clin Biochem 15, 65-76.
194. Bjarnason I, Macpherson A & Hollander D (1995) Intestinal permeability: an overview. Gastroenterology 108, 1566-1581.
195. Marsilio R, D'Antiga L, Zancan L, et al. (1998) Simultaneous HPLC determination with light-scattering detection of lactulose and mannitol in studies of intestinal permeability in pediatrics. Clin Chem 44, 1685-1691.
196. Camilleri M, Nadeau A, Lamsam J, et al. (2010) Understanding measurements of intestinal permeability in healthy humans with urine lactulose and mannitol excretion. Neurogastroenterol Motil 22, e15-e26.
197. Leite RD, Lima NL, Leite CAC, et al. (2013) Improvement of intestinal permeability with alanyl-glutamine in HIV patients: a randomized, double blinded, placebo-controlled clinical trial. Arq Gastroenterol 50, 56-63.
198. Elia M, Goren A, Behrens R, et al. (1987) Effect of total starvation and very low calorie diets on intestinal permeability in man. Clin Sci 73, 205-210.
199. Behrens RH, Szaz KF, Northrop C, et al. (1987) Radionuclide tests for the assessment of intestinal permeability. Eur J Clin Invest 17, 100-105.
200. van Wijck K, Bessems BA, van Eijk HM, et al. (2012) Polyethylene glycol versus dual sugar assay for gastrointestinal permeability analysis: is it time to choose? Clin Exp Gastroenterol 5, 139-150.
201. Mishra A & Makharia GK (2012) Techniques of functional and motility test: how to perform and interpret intestinal permeability. J Neurogastroenterol Motil 18, 443-447.
202. Juby LD, Rothwell J & Axon AT (1989) Cellobiose/mannitol sugar test‒a sensitive tubeless test for coeliac disease: results on 1010 unselected patients. Gut 30, 476-480.
203. Johnston SD, Smye M, Watson RP, et al. (2000) Lactulose-mannitol intestinal permeability test: a useful screening test for adult coeliac disease. Ann Clin Biochem 37, 512-519.
204. Vogelsang H, Schwarzenhofer M & Oberhuber G (1998) Changes in Gastrointestinal Permeability in Celiac Disease. Dig Dis 16, 333-336.
205. Andre F, Andre CF, Emery Y, et al. (1988) Assessment of the lactulose-mannitol test in Crohn's disease. Gut 29, 511-515.
68

206. Saltzman JR, Kowdley KV, Perrone G, et al. (2001) Changes in small-intestine permeability with aging. J Am Geriatr 43, 160-164.
207. Nathavitharana KA, Lloyd DR, Raafat F, et al. (1988) Urinary mannitol: lactulose excretion ratios and jejunal mucosal structure. Arch Dis Child 63, 1054-1059.
208. Jayalakshmi K, Ghoshal UC, Kumar S, et al. (2009) Assessment of small intestinal permeability using 1H-NMR spectroscopy. J Gastrointestin Liver Dis 18, 27-32.
209. Dastych M, Dastych M, Jr., Novotna HF, et al. (2008) Lactulose/mannitol test and specificity, sensitivity, and area under curve of intestinal permeability parameters in patients with liver cirrhosis and Crohn's disease. Dig Dis 53, 2789-2792.
210. Marshall JK, Thabane M, Garg AX, et al. (2006) Incidence and epidemiology of irritable bowel syndrome after a large waterborne outbreak of bacterial dysentery. Gastroenterology 131, 445-450.
211. Uil JJ, van Elburg RM, van Overbeek FM, et al. (1996) Follow-up of treated coeliac patients: sugar absorption test and intestinal biopsies compared. Eur J Gastroenterol Hepatol 8, 219-224.
212. Alam AN, Sarker SA, Wahed MA, et al. (1994) Enteric protein loss and intestinal permeability changes in children during acute shigellosis and after recovery: effect of zinc supplementation. Gut 35, 1707-1711.
213. Zeng J, Li YQ, Zuo XL, et al. (2008) Clinical trial: effect of active lactic acid bacteria on mucosal barrier function in patients with diarrhoealpredominant irritable bowel syndrome. Aliment Pharmacol Ther 28, 994-1002.
214. Lifson N, Gordon GB & McClintock R (1955) Measurement of Total Carbon Dioxide Production by Means of D2O18. J Appl Physiol 7, 704-710.
215. Schoeller DA & Van Santen E (1982) Measurement of energy expenditure in humans by doubly labeled water method. J Appl Physiol 53, 955-959.
216. Schoeller DA (1999) Recent advances from application of doubly labeled water to measurement of human energy expenditure. J Nutr 129, 1765-1768.
217. Croci I, Borrani F, Byrne N, et al. (2014) Reproducibility of Fatmax and fat oxidation rates during exercise in recreationally trained males. PloS one 9, e97930.
218. Kruskall LJ (2003) The Atwater energy equivalents overestimate metabolizable energy intake in older humans: results from a 96-day strictly controlled feeding study. J Nutr 133, 2581-2584.
69

219. Shetty PS (2002) Human energy requirements: where are we now? Issues emerging from the 2001 Expert Consultation on Energy in Human Nutrition. Food Nutr Agric, 5-13.
220. Klein PD, James WP, Wong WW, et al. (1984) Calorimetric validation of the doubly-labelled water method for determination of energy expenditure in man. Hum Nutr Clin Nutr 38, 95-106.
221. Coward WA & Prentice AM (1985) Isotope method for the measurement of carbon dioxide production rate in man. Am J Clin Nutr 41, 659-663.
222. Wong WW, Roberts SB, Racette SB, et al. (2014) The Doubly Labeled Water Method Produces Highly Reproducible Longitudinal Results in Nutrition Studies. J Nutr 144, 777-783.
223. Ravussin E, Harper IT, Rising R, et al. (1991) Energy expenditure by doubly labeled water: validation in lean and obese subjects. Am J Physiol 261, E402-E409.
224. Fuller Z, Horgan G, O'Reilly LM, et al. (2008) Comparing different measures of energy expenditure in human subjects resident in a metabolic facility. Eur J Clin Nutr 62, 560-569.
225. Roberts SB, Dietz W, Sharp T, et al. (1995) Multiple laboratory comparison of the doubly labeled water technique. Obes Res 3, 3-13.
226. Bonomi AG, Soenen S, Goris AH, et al. (2013) Weight-loss induced changes in physical activity and activity energy expenditure in overweight and obese subjects before and after energy restriction. PloS one 8, e59641.
227. Bray GA, Smith SR, de Jonge L, et al. (2012) Effect of dietary protein content on weight gain, energy expenditure, and body composition during overeating: a randomized controlled trial. JAMA 307, 47-55.
228. St-Onge MP, Roberts AL, Chen J, et al. (2011) Short sleep duration increases energy intakes but does not change energy expenditure in normal-weight individuals. Am J Clin Nutr 94, 410-416.
229. Martin CK, Das SK, Lindblad L, et al. (2011) Effect of calorie restriction on the free-living physical activity levels of nonobese humans: results of three randomized trials. J Appl Physiol 110, 956-963.
70


![static.cambridge.orgcambridge.org:id:... · Web view[page break—case studies randomly presented—Vignette 1: Owls] In the Pacific Northwest, decades of habitat loss have caused](https://static.fdocuments.in/doc/165x107/5cab5a2a88c993fb328c513e/cambridgeorgid-web-viewpage-breakcase-studies-randomly-presentedvignette.jpg)