© BP 2005 BP Statistical Review of World Energy 20051 Primary energy consumption per capita.
39
BP Statistical Review of World Energy 2005 1 © BP 2005 Primary energy consumption per capita
-
Upload
emil-patrick -
Category
Documents
-
view
224 -
download
2
Transcript of © BP 2005 BP Statistical Review of World Energy 20051 Primary energy consumption per capita.
BP Statistical Review of World Energy 2005 1 © BP 2005
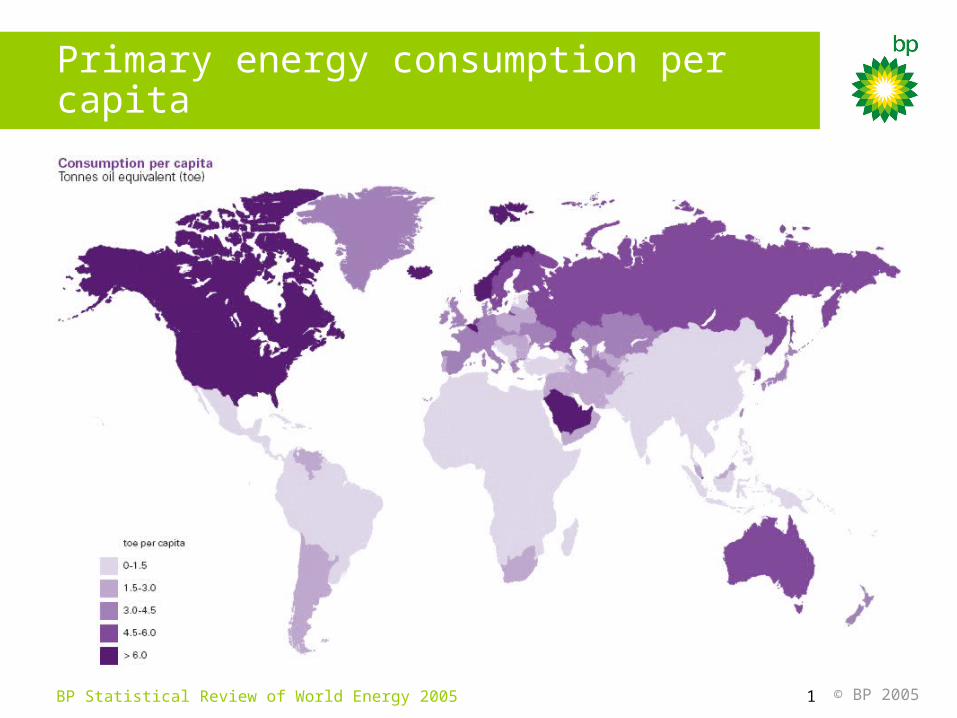
Primary energy consumption per capita
2BP Statistical Review of World Energy 2005
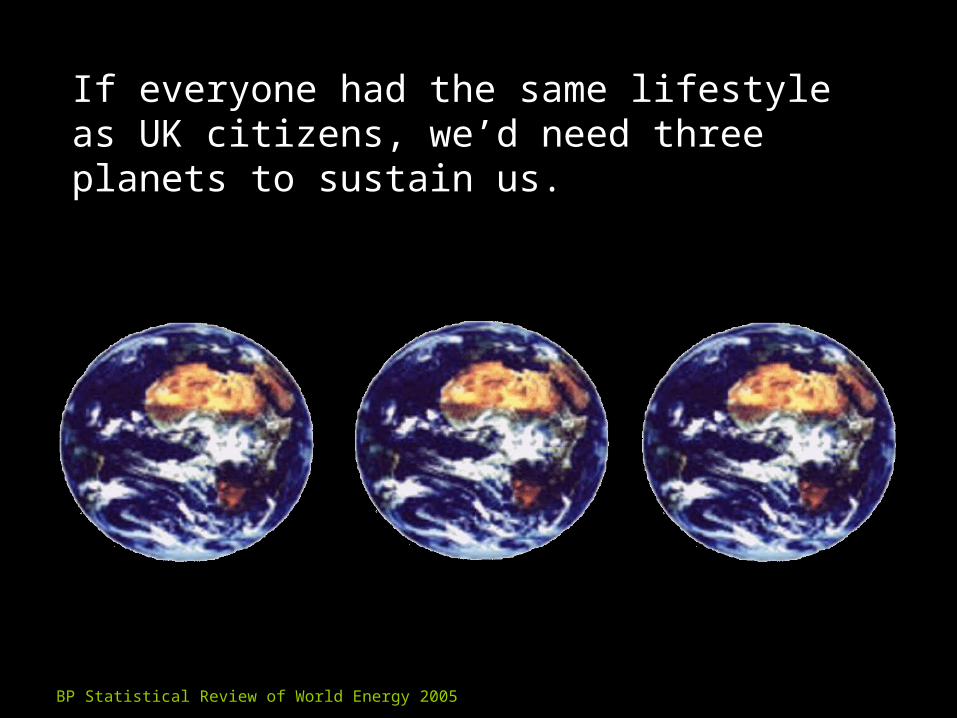
If everyone had the same lifestyle as UK citizens, we’d need three planets to sustain us.
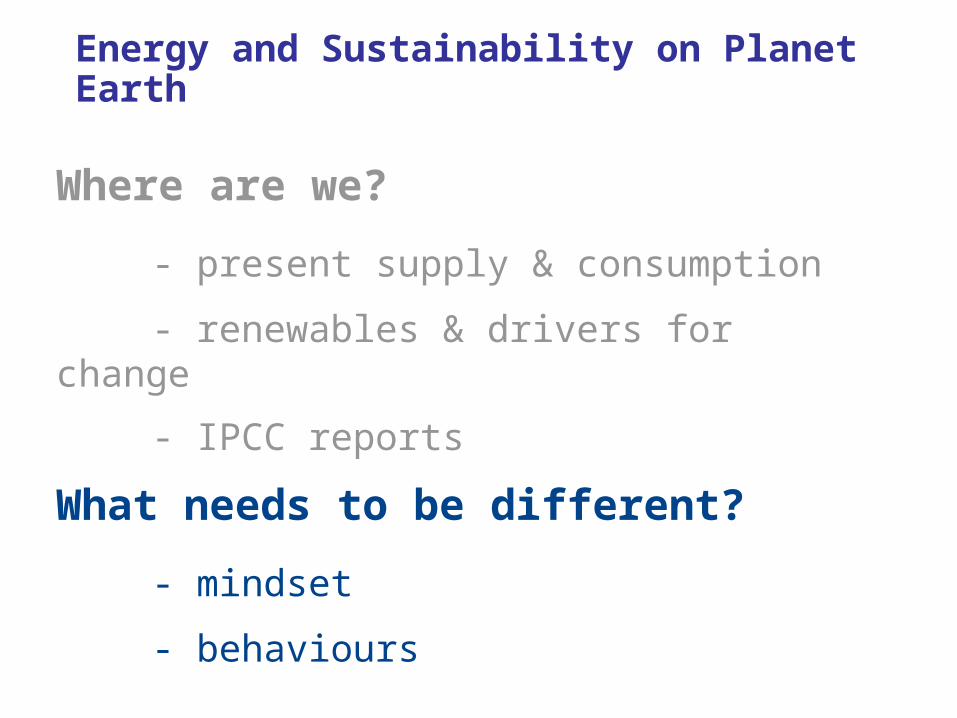
Energy and Sustainability on Planet Earth
Where are we?
- present supply & consumption
- renewables & drivers for change
- IPCC 2007 reports
What needs to be different?
- mindset
- behaviours

© BP 2005
Reliable data on renewable energy usage
worldwide is difficult to find. The following slides
should be treated with caution.
Caution on renewable statistics which follow . . .
Y
BP Statistical Review of World Energy 2005 6 © BP 2005
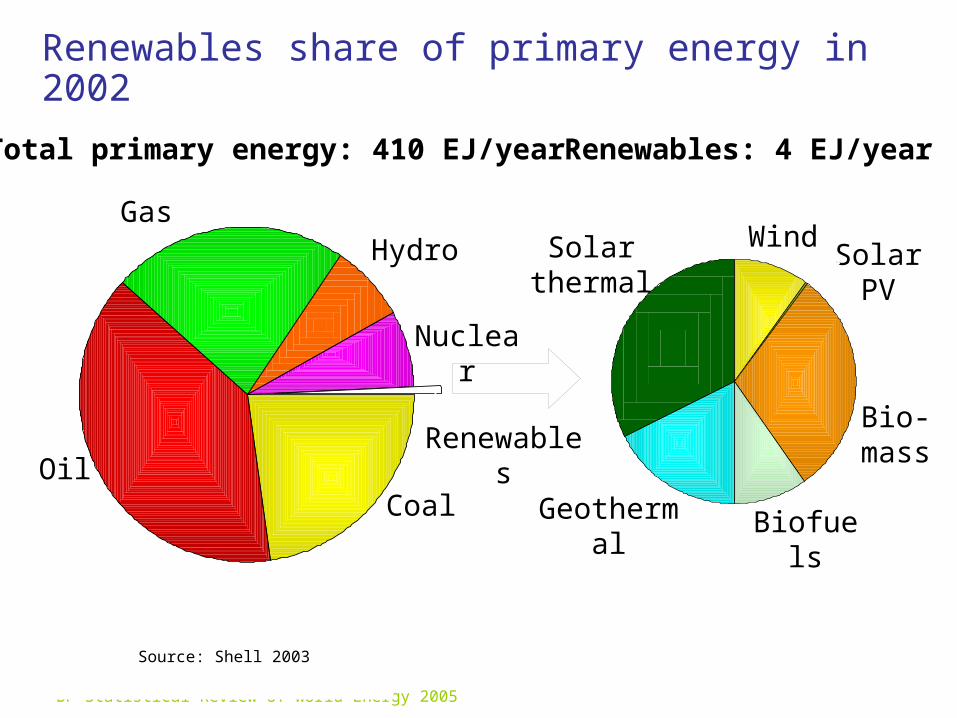
Renewables share of primary energy in 2002
Total primary energy: 410 EJ/year Renewables: 4 EJ/year
OilCoal
GasHydro
Nuclear
Renewables
WindSolar PV
Bio-mass
BiofuelsGeothermal
Solar thermal
Source: Shell 2003
BP Statistical Review of World Energy 2005 © BP 2005
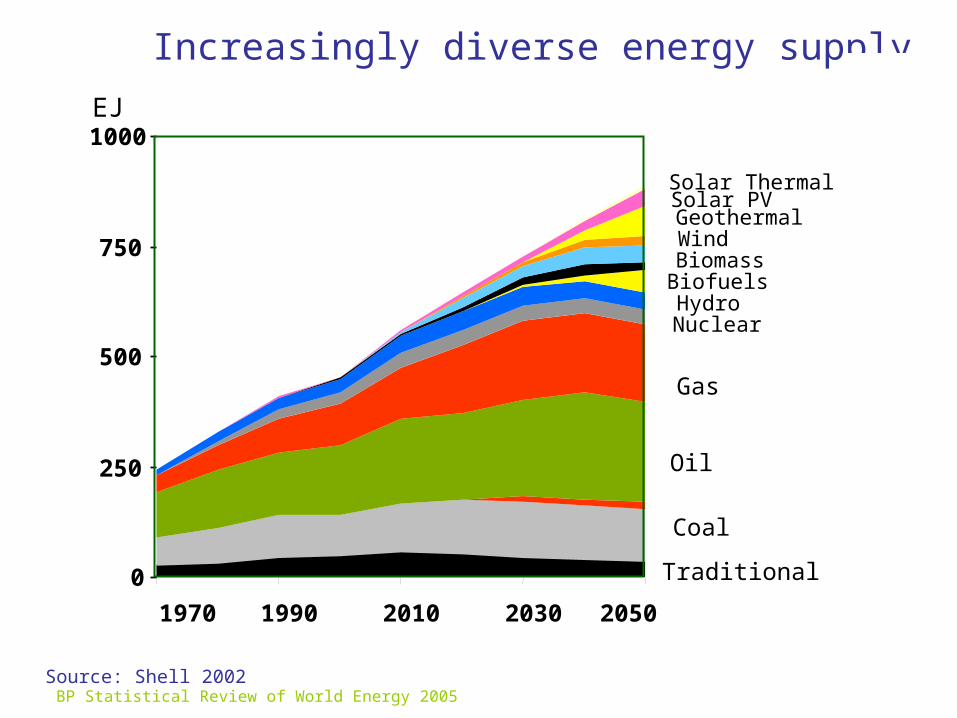
Increasingly diverse energy supply
EJ
HydroNuclear
Gas
Biofuels
Oil
Coal
Traditional
Solar Thermal
GeothermalSolar PV
WindBiomass
0
250
500
750
1000
1970 1990 2010 2030 2050
Source: Shell 2002
BP Statistical Review of World Energy 2005 8 © BP 2005
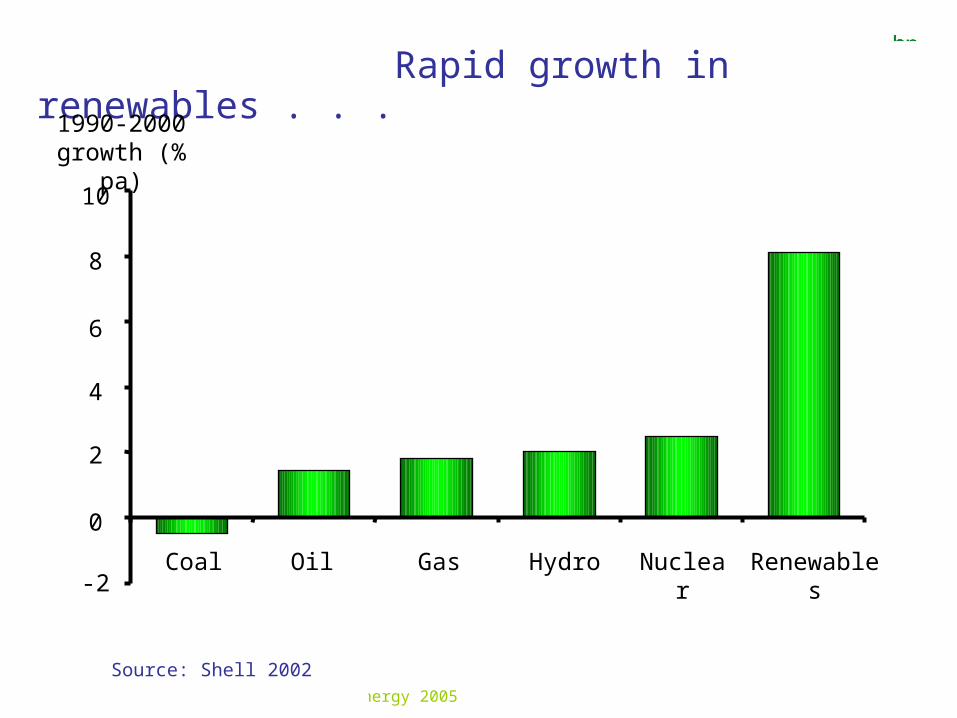
Rapid growth in renewables . . .
RenewablesCoal Oil HydroGas Nuclear
1990-2000growth (% pa)
-2
0
2
4
6
8
10
Source: Shell 2002
BP Statistical Review of World Energy 2005 9 © BP 2005
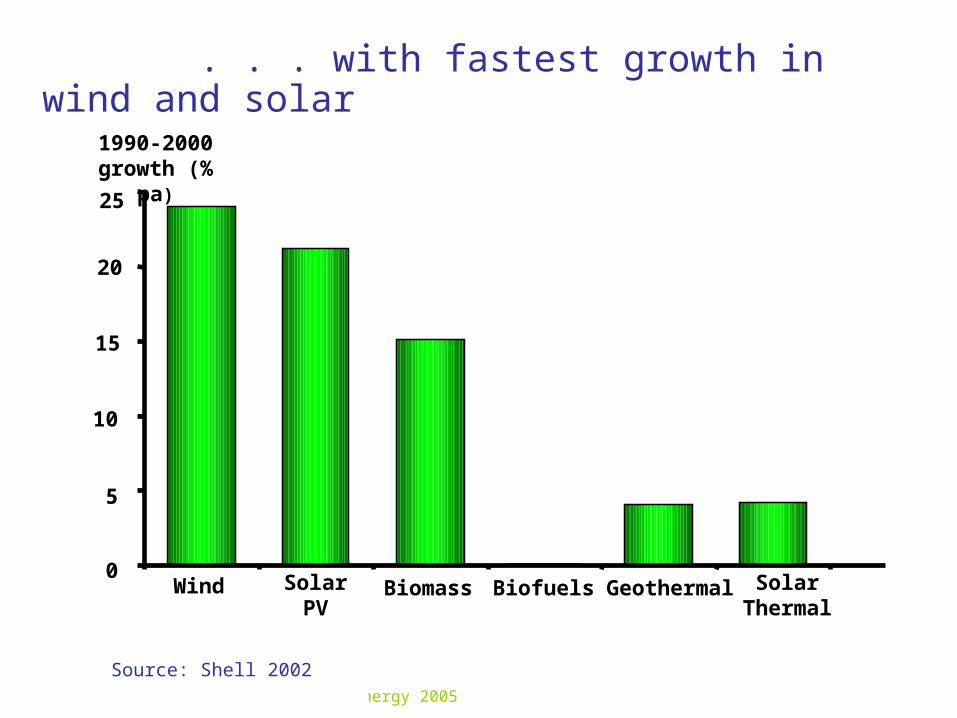
. . . with fastest growth in wind and solar
Source: Shell 2002
Solar PV
Solar Thermal
1990-2000growth (% pa)
Wind Biomass Biofuels Geothermal0
5
10
15
20
25
BP Statistical Review of World Energy 2005 10
© BP 2005
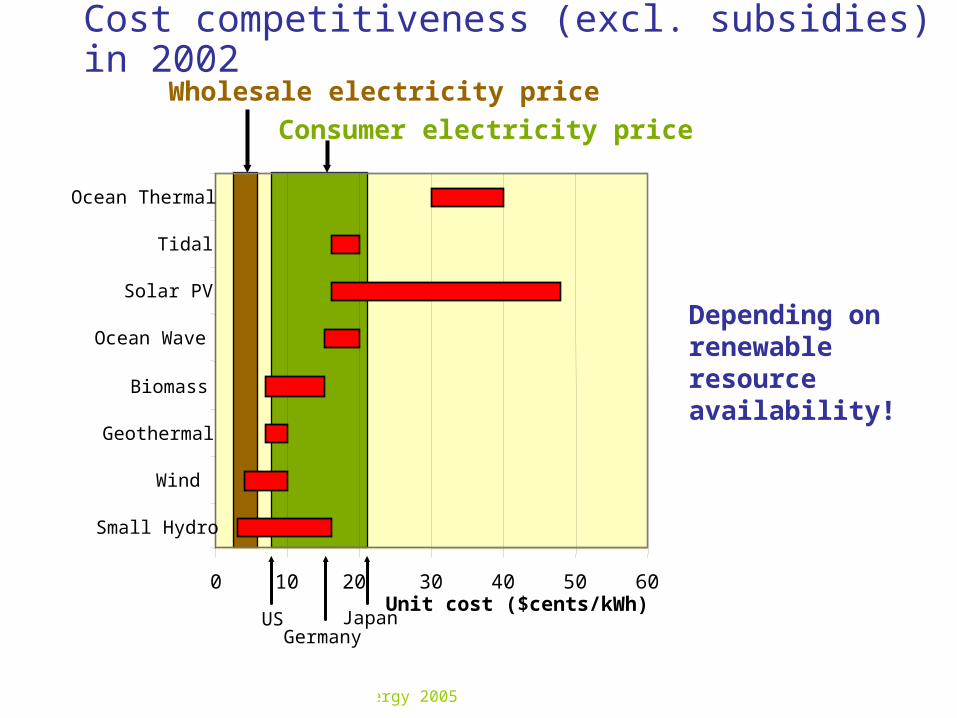
Consumer electricity price
US JapanGermany
Wholesale electricity price
Cost competitiveness (excl. subsidies) in 2002
0 10 20 30 40 50 60
Small Hydro
Wind
Geothermal
Biomass
Ocean Wave
Solar PV
Tidal
Ocean Thermal
Unit cost ($cents/kWh)
Depending onrenewable resourceavailability!
BP Statistical Review of World Energy 2005 © BP 2005
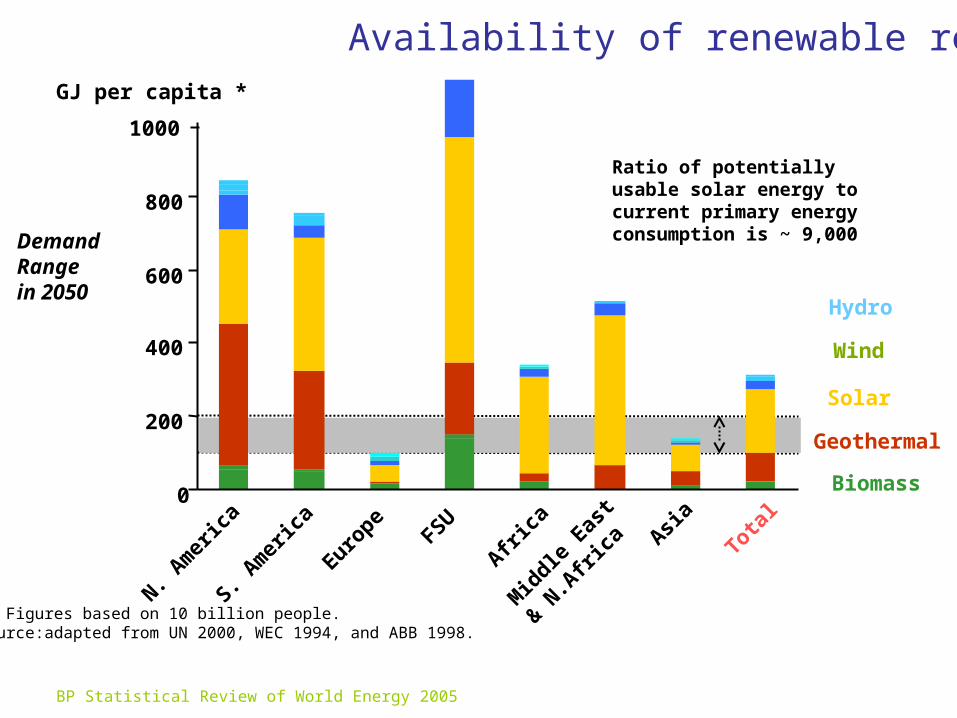
* Figures based on 10 billion people.Source:adapted from UN 2000, WEC 1994, and ABB 1998.
GJ per capita *
Solar
Wind
Biomass
Hydro
Geothermal
DemandRange in 2050
0
200
400
600
800
1000
N. A
mer
ica
S. A
mer
ica
Euro
pe F
SU
Afri
ca
Mid
dle Eas
t
& N
.Afri
ca Asia
Tot
al
Availability of renewable resources
Ratio of potentially usable solar energy to current primary energy consumption is ~ 9,000

BP Statistical Review of World Energy 2005 12
© BP 2005
Source: Shell 2002
Driver
• Environmental:
• Supply issues:
• Technology dev:
• Market structure:
Renewables growth is driven by:
1970’s
Air quality
Security of supply
R&D
Utility supplied
2000+
+ Climate change
+ Self reliance
+ Deployment
Personal choice
Y
y
An energy summary . . .-We are likely to be dependent upon fossil fuels for several decades
- New technologies (CCS, clean coal etc.) can limit CO2 damage, but they’re expensive
- Nuclear might be part of the solution but costs, risks & consequences may outweigh benefits
- Renewables might fill the gap if we re-think our entire energy systems and take energy-saving seriously

Energy and Sustainability on Planet Earth
Where are we?
- present supply & consumption
- renewables & drivers for change
- IPCC 2007 reports
What needs to be different?
- mindset
- behaviours

BP Statistical Review of World Energy 2005 15
© BP 2005Source: IPCC, 2001
Variations in Earth’s surface temperature
Climate Change 2007: The Physical Science Basis
Working Group I Contribution to the IPCC Fourth Assessment Report Presented by R.K. Pachauri, IPCC Chairand Bubu Jallow, WG 1 Vice Chair
Nairobi, 6 February 2007
Climate Change 2007: The Physical Science Basis
Working Group I Contribution to the IPCC Fourth Assessment Report
Presented by R.K. Pachauri, IPCC Chair
andBubu Jallow, WG 1 Vice Chair
Nairobi, 6 February 2007
BP Statistical Review of World Energy 2005 17
© BP 2005
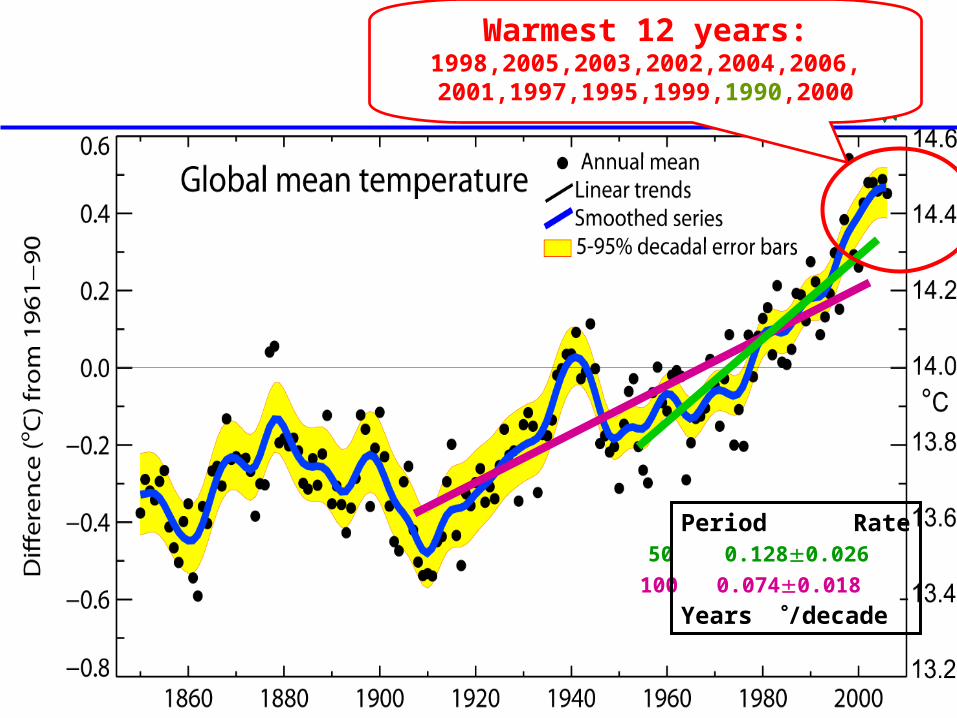
100 0.0740.018
50 0.1280.026
Warmest 12 years:1998,2005,2003,2002,2004,2006, 2001,1997,1995,1999,1990,2000
Period Rate
Years /decade

BP Statistical Review of World Energy 2005 18
© BP 2005
Changes in Precipitation, Increased Drought
• Significantly increased precipitation in eastern parts of North and South America, northern Europe and northern and central Asia
• The frequency of heavy precipitation events has increased over most land areas
• Drying in the Sahel, the Mediterranean, southern Africa and parts of southern Asia
• More intense and longer droughts observed since the 1970s, particularly in the tropics and subtropics.
• Source: IPCC 2007
Changes in Precipitation, Increased Drought
• Significantly increased precipitation in eastern parts of North and South America, northern Europe and northern and central Asia.
• The frequency of heavy precipitation events has increased over most land areas - consistent with warming and increases of atmospheric water vapour
• Drying in the Sahel, the Mediterranean, southern Africa and parts of southern Asia.
• More intense and longer droughts observed since the 1970s, particularly in the tropics and subtropics.
© BP 2005
“Imagination is more important than knowledge”
Albert Einstein
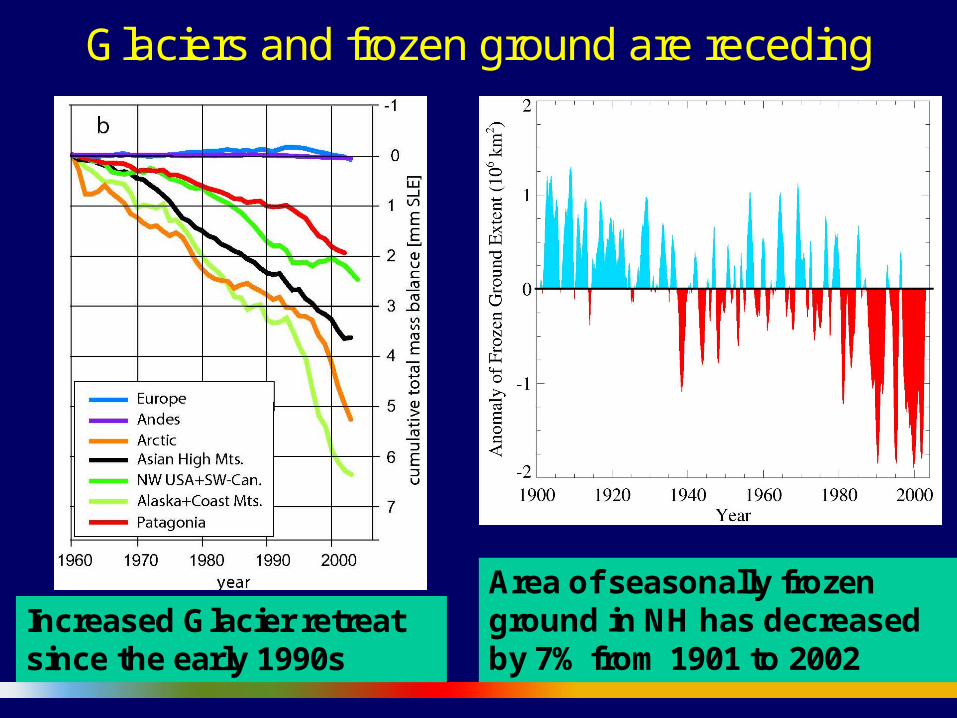
YGlaciers and frozen ground are receding
Area of seasonally frozen ground in NH has decreasedby 7% from 1901 to 2002
Increased Glacier retreat since the early 1990s

© BP 2005
“Imagination is more important than knowledge”
Albert Einstein
Y
Attribution
• are observed changes consistent with
expected responses to forcings
inconsistent with alternative explanations
Observations
All forcing
Solar+volcanic
© BP 2005
“Imagination is more important than knowledge”
Albert Einstein
Y
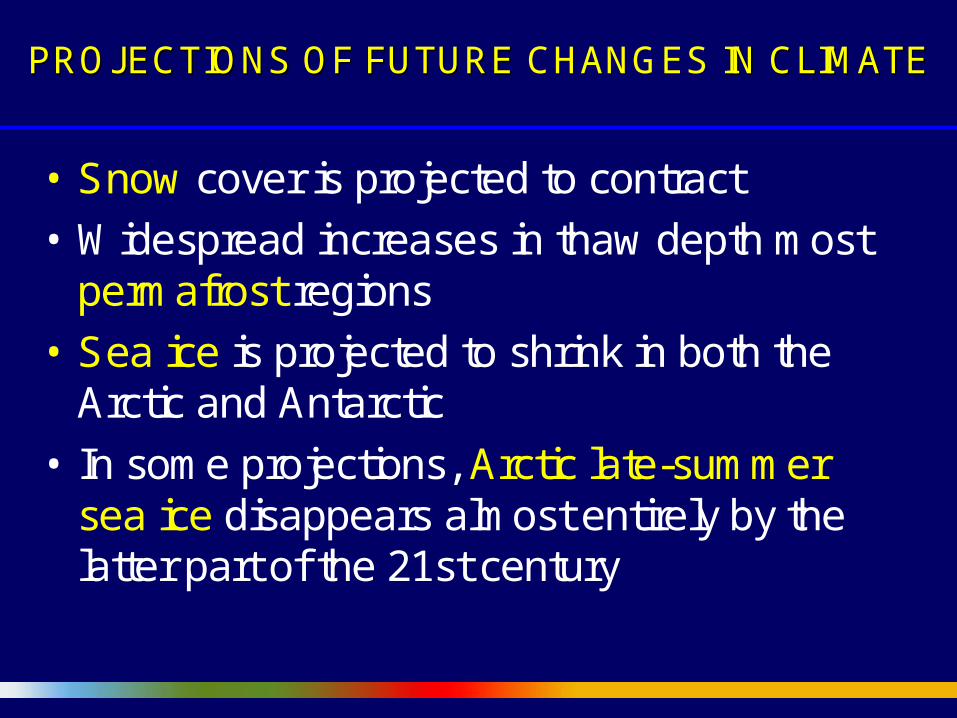
• Snow cover is projected to contract
• Widespread increases in thaw depth most permafrost regions
• Sea ice is projected to shrink in both the Arctic and Antarctic
• In some projections, Arctic late-summer sea ice disappears almost entirely by the latter part of the 21st century
PROJECTIONS OF FUTURE PROJECTIONS OF FUTURE CHANGES IN CLIMATEIN CLIMATE
© BP 2005
“Imagination is more important than knowledge”
Albert Einstein
Y
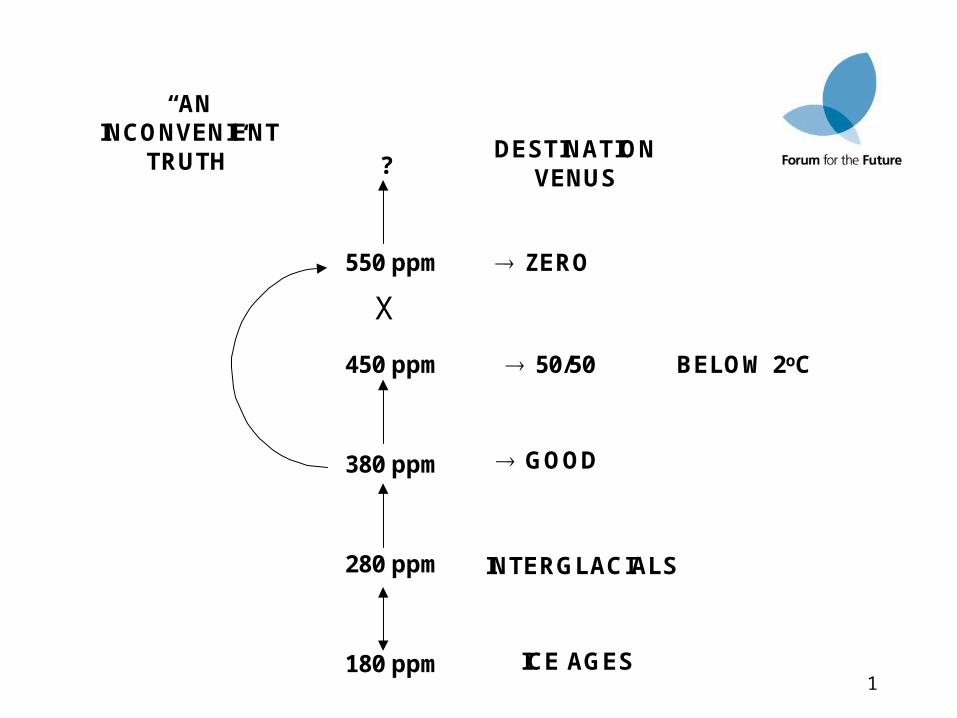
1180 ppm ICE AGES
280 ppm INTERGLACIALS
GOOD
50/50
ZERO
BELOW 2oC
DESTINATIONVENUS
“AN INCONVENIENT
TRUTH”
380 ppm
450 ppm
?
X
550 ppm
© BP 2005
“Imagination is more important than knowledge”
Albert Einstein
Y
9
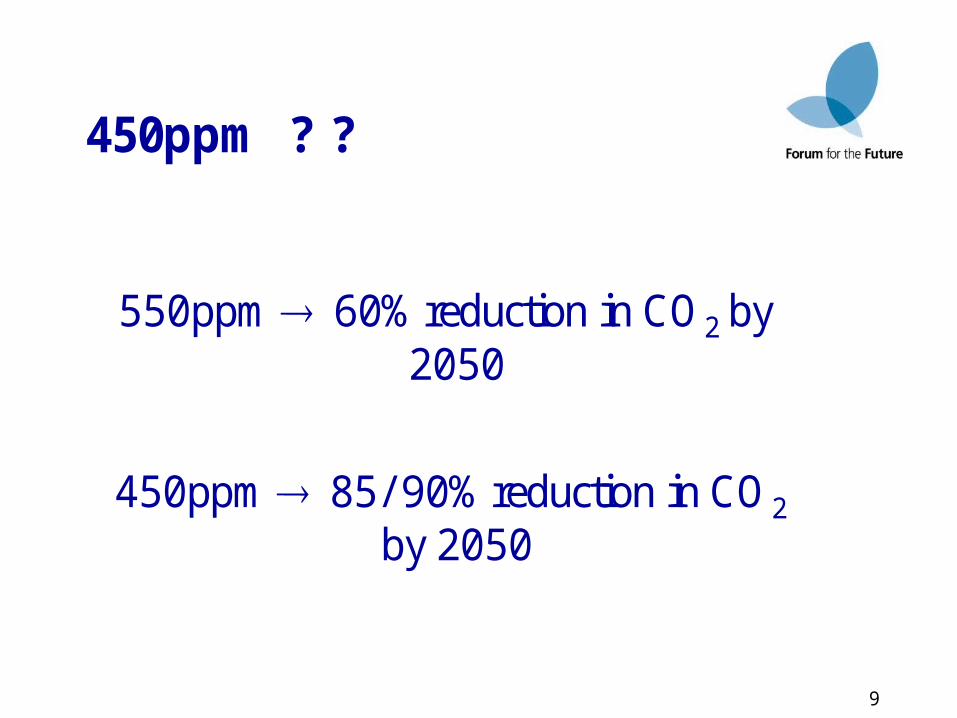
450ppm ? ?
550ppm 60% reduction in CO2 by 2050
450ppm 85/ 90% reduction in CO2 by 2050

© BP 2005
“Imagination is more important than knowledge”
Albert Einstein
Y
36
“The world is on the brink of a vast and mostly
unpleasant change that may mark the end of our
present civilization.”
Jim Lovelock

© BP 2005
“Imagination is more important than knowledge”
Albert Einstein
Y
37
Destination Venus?
96% CO2
© BP 2005
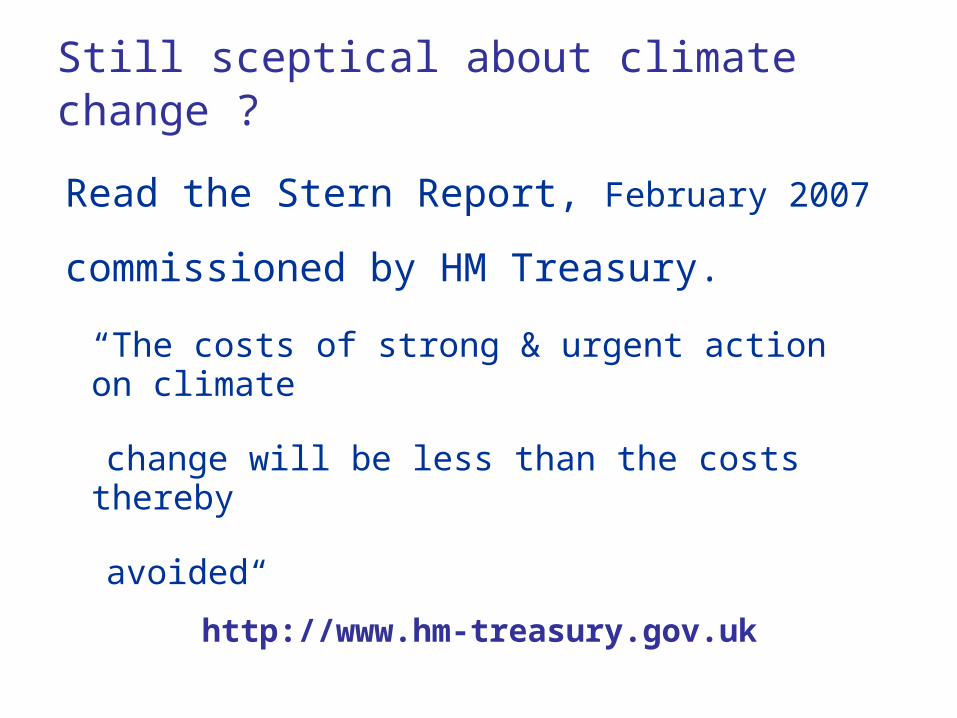
Read the Stern Report, February 2007
commissioned by HM Treasury.
“The costs of strong & urgent action on climate
change will be less than the costs thereby
avoided“
Still sceptical about climate change ?
Y
http://www.hm-treasury.gov.uk
Energy and Sustainability on Planet Earth
Where are we?
- present supply & consumption
- renewables & drivers for change
- IPCC reports
What needs to be different?
- mindset
- behaviours

© BP 2005
“Imagination is more important than knowledge”
Albert Einstein
Y
What needs to be different?
Mindset
- radical changes in western lifestyles are possible & desirable
- there are enormous opportunities (as well as threats for those not prepared to change)
What needs to be different?
Mindset
- radical change is possible & desirable
- there are enormous opportunities (as well as threats for those not prepared to change)
AND
a coherent lead from governments, businesses and individuals is
required

A different mindset . . .
- A low carbon society is achievable & desirable
(Energy has only been cheap because we’ve ignored many of the costs)
- Define long-term goals (e.g. reduce CO2 by at least 20% by 2020 and 60% by 2050) and set policy and management to achieve them
A different mindset . . .
- A low carbon society is achievable & desirable
(Energy has only been cheap because we’ve ignored many of the costs)
- Define long-term goals (e.g. reduce CO2 by at least 20% by 2020 and 60% by 2050) and set policy and management to achieve them
- Illuminate & connect consumers and producers
- Tackle behavioural as well as technical issues
A different mindset . . .
Discard out-dated ideas, myths and habits
For example:
- economic growth is a sine qua non
- energy and water are cheap
- wealth = happiness
- car purchase choices are mainly about transportation
- cheap air travel is desirable
A different mindset . . .
Discard out-dated ideas, myths and habits
(e.g. economic growth is a sine qua non; energy and water are cheap; wealth=happiness; car purchase choices are mainly about transportation; cheap air travel is desirable etc.),
Apply systems (holistic or SD) thinking to all policies and major decisions, and
A different mindset . . .
Discard out-dated ideas, myths and habits
(e.g. economic growth is a sine qua non; energy is cheap; car purchase choices are mainly about transportation; cheap air travel is desirable etc.),
Apply systems (SD) thinking to all policies and major decisions, and
Work on BOTH individual consumer choices AND government & business action.
© BP 2005
We are all part of the problem.
We ALL need to get engaged in being part
of the solution.
TODAY
ConclusionY
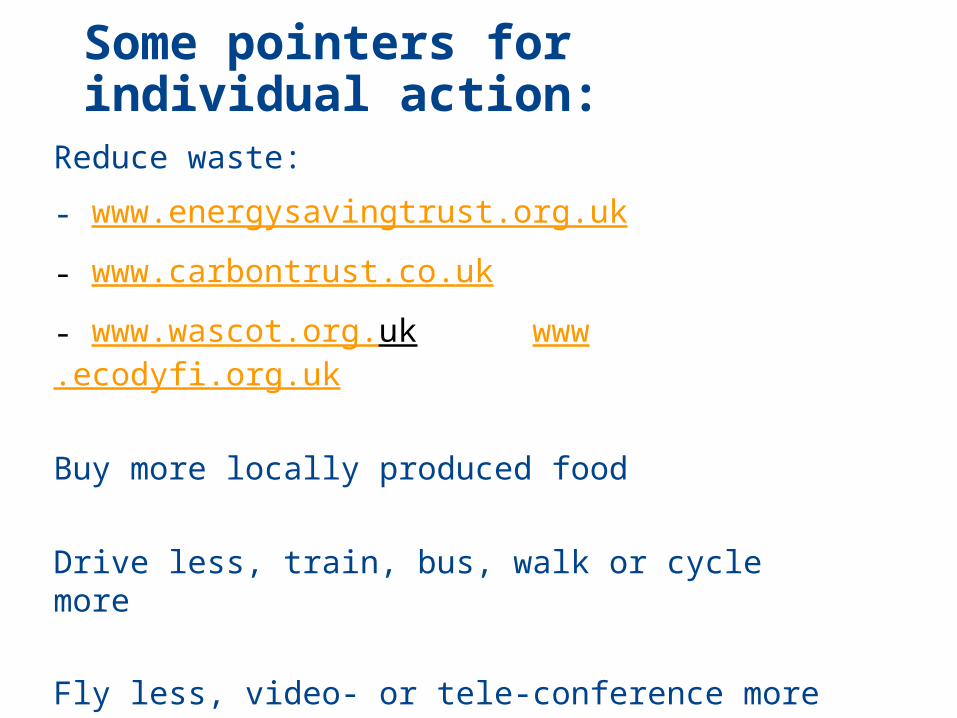
Some pointers for individual action:
Reduce waste:
- www.energysavingtrust.org.uk
- www.carbontrust.co.uk
- www.wascot.org.uk www.ecodyfi.org.uk
Buy more locally produced food
Drive less, train, bus, walk or cycle more
Fly less, video- or tele-conference more
Holiday in Scotland – nowhere is more beautiful.
© BP 2005
www.ipcc.ch www.realclimate.org
www.climatecrisis.net
www.sd-commission.org.uk www.forumforthefuture.org
www.hm-treasury.gov.uk/independent_reviews/
www.solonline.org www.thinking.net
www.bp.com www.shell.com
Some useful reference points . . .
Energy and Sustainability on Planet Earth
Where are we?
- present supply & consumption
- renewables & drivers for change
- IPCC reports
What needs to be different?
- mindset
- behaviours
D I S C U S S I O N