Biology · • Attempt ONE question from ... indicate the correct answer by writing the word...
34
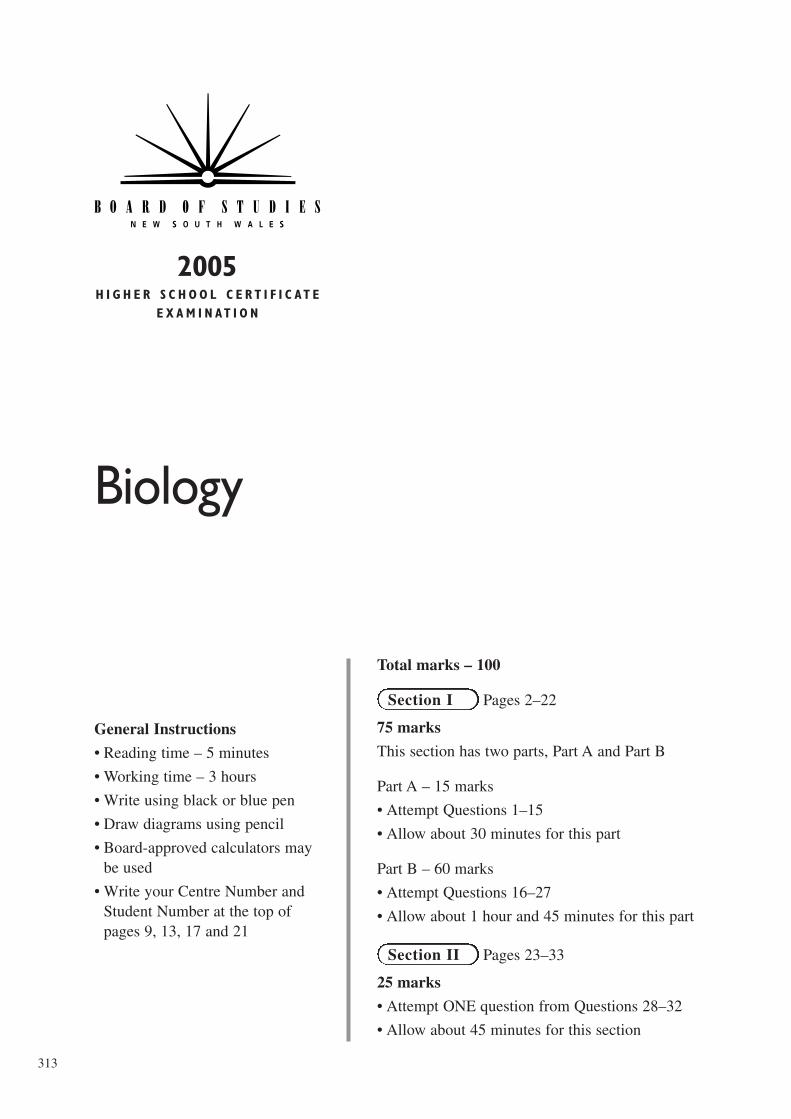
General Instructions • Reading time – 5 minutes • Working time – 3 hours • Write using black or blue pen • Draw diagrams using pencil • Board-approved calculators may be used • Write your Centre Number and Student Number at the top of pages 9, 13, 17 and 21 Total marks – 100 Pages 2–22 75 marks This section has two parts, Part A and Part B Part A – 15 marks • Attempt Questions 1–15 • Allow about 30 minutes for this part Part B – 60 marks • Attempt Questions 16–27 • Allow about 1 hour and 45 minutes for this part Pages 23–33 25 marks • Attempt ONE question from Questions 28–32 • Allow about 45 minutes for this section Section II Section I Biology 313 2005 HIGHER SCHOOL CERTIFICATE EXAMINATION
Transcript of Biology · • Attempt ONE question from ... indicate the correct answer by writing the word...
General Instructions
• Reading time – 5 minutes
• Working time – 3 hours
• Write using black or blue pen
• Draw diagrams using pencil
• Board-approved calculators maybe used
• Write your Centre Number andStudent Number at the top ofpages 9, 13, 17 and 21
Total marks – 100
Pages 2–22
75 marks
This section has two parts, Part A and Part B
Part A – 15 marks
• Attempt Questions 1–15
• Allow about 30 minutes for this part
Part B – 60 marks
• Attempt Questions 16–27
• Allow about 1 hour and 45 minutes for this part
Pages 23–33
25 marks
• Attempt ONE question from Questions 28–32
• Allow about 45 minutes for this section
Section II
Section I
Biology
313
2005H I G H E R S C H O O L C E R T I F I C AT E
E X A M I N AT I O N

– 2 –
Section I75 marks
Part A – 15 marksAttempt Questions 1–15Allow about 30 minutes for this part
Use the multiple-choice answer sheet.
Select the alternative A, B, C or D that best answers the question. Fill in the response ovalcompletely.
Sample: 2 + 4 = (A) 2 (B) 6 (C) 8 (D) 9
A B C D
If you think you have made a mistake, put a cross through the incorrect answer and fill in thenew answer.
A B C D
If you change your mind and have crossed out what you consider to be the correct answer, thenindicate the correct answer by writing the word correct and drawing an arrow as follows.
correct
A B C D

1 What is a function of haemoglobin?
(A) Fights disease
(B) Transports oxygen
(C) Gives blood its colour
(D) Carries salts in the blood
2 Which TWO scientists were able to crystallise DNA to develop the first model of DNA?
(A) Beadle and Tatum
(B) Darwin and Wallace
(C) Franklin and Wilkins
(D) Koch and Pasteur
3 Lung cancer is one of the diseases linked to smoking.
To what category of disease does lung cancer belong?
(A) Environmental
(B) Infectious
(C) Nutritional
(D) Viral
4 Gregor Mendel described the physical traits in pea plants as being controlled by two‘factors’.
What term is now used to describe the factors Mendel identified?
(A) Chromosomes
(B) Genes
(C) Hybrids
(D) Polypeptides
5 How is the pathogen for malaria transmitted?
(A) Anopheles mosquito
(B) Direct human contact
(C) Particles in air
(D) Plasmodium falciparum
– 3 –

– 4 –
6 Which of the following best describes the main focus of epidemiology?
(A) Diseases related to the skin
(B) Changes in the characteristics of a species
(C) Factors involved in the occurrence, prevalence and spread of disease
(D) How the body maintains its functions in response to variations in the environment
7 The features of leaves shown in the diagram are adaptations found in some Australianplants.
What is the function of these adaptations?
(A) Assist in plant growth
(B) Allow the transport of water
(C) Assist in reducing water loss
(D) Reduce the impact of predators
8 Recycling of sewage so that it can be used as drinking water is one possible solution tothe current water shortages in Australia.
Which of the following would health authorities be concerned about?
(A) The change to the taste of the water
(B) The risk of infection from pathogens would increase
(C) The reluctance of the general public to drink treated sewage
(D) The effect that water with sediments could have on plumbing systems
I II III
Vertically hanging
leaves
Hairs on leaf
Reduced leaves

9 The graph models the effect of an environmental stimulus on temperature control inmammals.
What does this graph represent?
(A) A reflex action
(B) An immune response
(C) An impulse pathway
(D) A feedback mechanism
10 The diagram represents a model of DNA replication. The steps are NOT in the correctorder.
Which of the following is the correct order?
(A) 1, 2, 3, 4
(B) 2, 3, 4, 1
(C) 2, 4, 3, 1
(D) 4, 3, 2, 1
Two identicalDNA strandsare formed
1
DNA
2
New nucleotidesmove in to copythe DNA strand
3
DNA unzips
4
Stimulus
+
−
ni se gn ahC
e ruta repm et ydo b
Time
– 5 –
Reproduced by permission of Oxford University Press Australia from Biology: The Spectrum of Life, 2nd edition, by Peter aubussonet al (c) Oxford University Press, www.oup.com.au
Reproduced by permission of Oxford University Press Australia from Biology: The Spectrum of Life, 2nd edition, by Peter aubussonet al (c) Oxford University Press, www.oup.com.au

11 How do vaccines prevent disease?
(A) Vaccines stop antigens triggering an immune response.
(B) Vaccines stimulate the production of specific antibodies.
(C) Vaccines will inhibit the inflammation response in the body.
(D) Vaccines restrict the vector’s ability to inhabit a variety of environments.
12 The diagram is a model of an important biological process.
What prediction can be made using the model?
(A) Salt ions move by osmosis into an area of low solute concentration from an area ofhigh solute concentration.
(B) Salt ions move by diffusion from an area of high solute concentration to an area oflow solute concentration.
(C) Water molecules move by diffusion from an area of high solute concentration to anarea of low solute concentration.
(D) Water molecules move by osmosis from an area of low solute concentration to anarea of high solute concentration.
Selectively permeablemembrane
Watermolecules
Saltions
– 6 –

13 The diagram represents red and white blood cells seen under a light microscope.
What do X, Y and Z represent on the scale?
(A) 0, 10, 20 nm
(B) 0, 10, 20 µm
(C) 0, 50, 100 µm
(D) 0, 50, 100 mm
14 A geneticist was studying coat colour in a herd of Shorthorn cattle. She performed thefollowing cross:
The results of the cross are shown in the table below.
The roan coat colour was the result of which type of inheritance?
(A) Co-dominance
(B) Dominant/recessive
(C) Heterozygous parents
(D) Hybridisation
Offspring number
0
0
157
157
Phenotype
White coat
Red coat
Red and white coat (roan)
Total
Red coat White coat
×
X Y Z
Scale
– 7 –

15 The two animals pictured are not closely related. They burrow and live most of their lifeunderground.
Which of the following explains how these two animals can be used to illustrateDarwin/Wallace’s theory of evolution by natural selection and isolation?
(A) They demonstrate comparative anatomy.
(B) They must have evolved from a common ancestor.
(C) They demonstrate that an organism can change its characteristics to suit its currentenvironment.
(D) They have evolved similar structures in response to similar environmentalconditions.
European placental mole(Talpa europaea)
Australian marsupial mole(Notorcytes caurinus)
– 8 –
© Board of Studies NSW 2005

2005 HIGHER SCHOOL CERTIFICATE EXAMINATION
Biology
Section I (continued)
Part B – 60 marksAttempt Questions 16–27Allow about 1 hour and 45 minutes for this part
Answer the questions in the spaces provided.
MarksQuestion 16 (3 marks)
(a) Define the term pathogen.
...............................................................................................................................
...............................................................................................................................
(b) Complete the table below to distinguish between bacteria and viruses.
Characteristic / feature of organism
Bacteria
Virus
2
1
– 9 –314
Centre Number
Student Number

Question 17 (3 marks)
Use an example to outline the role of the nervous system in maintaining homeostasis.
.........................................................................................................................................
.........................................................................................................................................
.........................................................................................................................................
.........................................................................................................................................
.........................................................................................................................................
.........................................................................................................................................
.........................................................................................................................................
.........................................................................................................................................
3
– 10 –
Marks

Question 18 (4 marks)
This flow chart represents a model of polypeptide production.
In the table below, name and outline what occurs in Processes 1 and 2.
Outline of process
.................................................................................
.................................................................................
.................................................................................
.................................................................................
.................................................................................
.................................................................................
.................................................................................
.................................................................................
.................................................................................
.................................................................................
Name of process(word or phrase)
Process 1
...........................................
Process 2
...........................................
Informationin
DNA
Polypeptidewith correctamino acidsequence
Process 1 Process 2
4
– 11 –
Marks

Question 19 (4 marks)
During your study of Biology you have been required to gather and analyseinformation on an infectious disease.
Fill in the table below for ONE infectious disease.
Name of the disease .......................................................................................................
Description
..................................................................................................
..................................................................................................
..................................................................................................
..................................................................................................
..................................................................................................
..................................................................................................
..................................................................................................
..................................................................................................
..................................................................................................
..................................................................................................
..................................................................................................
..................................................................................................
..................................................................................................
..................................................................................................
..................................................................................................
..................................................................................................
Feature
Cause
Symptoms
Treatment
Prevention
4
– 12 –
Marks
© Board of Studies NSW 2005

2005 HIGHER SCHOOL CERTIFICATE EXAMINATION
Biology
Section I — Part B (continued)
MarksQuestion 20 (3 marks)
This table shows the results of the analysis of urine samples of three organisms.
Using information from the table, explain the differences in urine concentration ofthese three organisms.
.........................................................................................................................................
.........................................................................................................................................
.........................................................................................................................................
.........................................................................................................................................
.........................................................................................................................................
.........................................................................................................................................
Marine fish
concentrated
urea
Freshwaterfish
dilute
ammonia
Terrestrialmammal
concentrated
urea
Organism
Urine concentration
Form of nitrogen waste
3
– 13 –315
Centre Number
Student Number

Question 21 (8 marks)
Carbon dioxide is one of the substances carried in mammalian blood.
(a) Why is it necessary for excess carbon dioxide to be removed from blood?
...............................................................................................................................
...............................................................................................................................
...............................................................................................................................
(b) In what forms is carbon dioxide transported in blood?
...............................................................................................................................
...............................................................................................................................
...............................................................................................................................
(c) You performed a first-hand investigation to demonstrate the effect of dissolvedcarbon dioxide on the pH of water.
Outline your method, identifying the variables AND account for how youensured the reliability of your data.
...............................................................................................................................
...............................................................................................................................
...............................................................................................................................
...............................................................................................................................
...............................................................................................................................
...............................................................................................................................
...............................................................................................................................
...............................................................................................................................
...............................................................................................................................
...............................................................................................................................
...............................................................................................................................
...............................................................................................................................
...............................................................................................................................
...............................................................................................................................
5
2
1
– 14 –
Marks

Question 22 (4 marks)
Lifetime traceable tags as shown in the diagram are now required on all cattle inAustralia.
Discuss the use of this strategy in dealing with diseases.
.........................................................................................................................................
.........................................................................................................................................
.........................................................................................................................................
.........................................................................................................................................
.........................................................................................................................................
.........................................................................................................................................
.........................................................................................................................................
.........................................................................................................................................
• Calf’s ear is tagged at birth.
• Movement of cattle from oneplace to another is tracked.
• Information is recorded in anational database.
National livestockidentification
scheme tag
4
– 15 –
Marks
Department of Primary Industries, Victoria, ‘National Livestock Identification Scheme (NLIS)’ on http://wwdpi.vic.gov.au/dpi

Question 23 (5 marks)
The flow diagram below is a representation of one pair of homologous chromosomesin a cell during meiosis.
(a) Identify ONE characteristic of the cells labelled D.
...............................................................................................................................
(b) Identify what occurs in Process 1.
...............................................................................................................................
(c) Identify where crossing over would occur, and explain how crossing over affectsthe inheritance of genes.
...............................................................................................................................
...............................................................................................................................
...............................................................................................................................
...............................................................................................................................
...............................................................................................................................
...............................................................................................................................
3
1
1
Process 1 Process 2
Process 3
KEY
Chromosome
A B
C
D
– 16 –
Marks
© Board of Studies NSW 2005

2005 HIGHER SCHOOL CERTIFICATE EXAMINATION
Biology
Section I – Part B (continued)
MarksQuestion 24 (6 marks)
Nick’s wife Maria has a history of red-green colour blindness in her family. Jack, theirtwo-year old son, may be red-green colour blind. Maria’s brothers, Vincent and Paul,are colour blind but her brother, James, is not. Maria’s mother Anne, is a carrier ofred-green colour blindness. Her father, John, is unaffected.
(a) Construct a family pedigree to show the inheritance of this sex-linked geneticdisorder.
(b) Predict whether Jack will be colour blind. Justify your answer.
...............................................................................................................................
...............................................................................................................................
...............................................................................................................................
...............................................................................................................................
...............................................................................................................................
...............................................................................................................................
2
4
– 17 –316
Centre Number
Student Number

Question 25 (8 marks)
Use the information provided to answer the following questions.
(a) Identify ONE appropriate method to estimate how widespread a locustinfestation might be.
...............................................................................................................................
(b) State ONE other valid piece of information that could be collected about locusts,and identify how this information is useful in developing a method forcontrolling the pest.
...............................................................................................................................
...............................................................................................................................
...............................................................................................................................
Question 25 continues on page 19
2
1
The Locust Plague
The Australian plague locust is a damaging, recurring, insect pest ofpastures and crops throughout south-eastern Australia. The greatest activityis when locusts feed and move, usually from spring to autumn. Locustoccurrence depends entirely on weather and feed conditions. Locustsreproduce rapidly, migrate hundreds of kilometres overnight and destroylarge areas of pastures and crops.
– 18 –
Marks
Adapted from David Croft, ‘Plague Locusts and Spring’, IREC Farmers’ Newsletter, No. 167, Winter 2004, p18.

Question 25 (continued)
Media release about fighting locust plagues
(c) Assess the impacts of these alternative strategies of locust control on society andthe environment.
...............................................................................................................................
...............................................................................................................................
...............................................................................................................................
...............................................................................................................................
...............................................................................................................................
...............................................................................................................................
...............................................................................................................................
...............................................................................................................................
...............................................................................................................................
...............................................................................................................................
...............................................................................................................................
...............................................................................................................................
...............................................................................................................................
...............................................................................................................................
...............................................................................................................................
...............................................................................................................................
5
Fungus to fight locust plague
A biological control, based on anaturally occurring Australianfungus, has been developed by theCSIRO. It is effective againstlocusts and grasshopper pests.The fungal spores have noenvironmental effects on aquaticorganisms and are suitable for usein organic-beef-growing areas.Costs are low. The fungus is anAustralian native species.
Pesticide to fight locust plague
Spraying pesticide is effective inkilling the locusts before theyhatch. Costs are low and theprocedures for spraying are welldeveloped. Spraying close toharvest times is illegal and strictrules also prevent spraying nearhouses, roads and watercourses,as well as in national parks andendangered species’ habitats.
– 19 –
Marks
Adapted from Steve Letts, ‘Australia’s largest locust plague’, 12 November 2005, Landline, ABC Online, by permission of ABC Content Sales.

Question 26 (4 marks)
The graph illustrates the relative distribution of two species of mangrove growing onthe margin of an estuary.
The main characteristics of the leaves of these mangrove plants are:
Complete the KEY in the boxes provided above, to identify which line representsSpecies A and which line represents Species B. Justify your answer.
.........................................................................................................................................
.........................................................................................................................................
.........................................................................................................................................
.........................................................................................................................................
.........................................................................................................................................
.........................................................................................................................................
Land Sea
Relative abundance
Meanhigh water mark
Meanlow water mark
KEY
Characteristics
Leaves covered with salt crystals
Leaves with thick waxy cuticles
Mangrove
Species A
Species B
4
– 20 –
Marks
© Board of Studies NSW 2005

2005 HIGHER SCHOOL CERTIFICATE EXAMINATION
Biology
Section I — Part B (continued)
MarksQuestion 27 (8 marks)
The influenza virus has a high rate of mutation which can lead to changes of the viralsurface antigens that contain protein.
Analyse the impact of high mutation rates for this virus and the implications forhuman health.
.........................................................................................................................................
.........................................................................................................................................
.........................................................................................................................................
.........................................................................................................................................
.........................................................................................................................................
.........................................................................................................................................
.........................................................................................................................................
.........................................................................................................................................
.........................................................................................................................................
.........................................................................................................................................
.........................................................................................................................................
.........................................................................................................................................
.........................................................................................................................................
.........................................................................................................................................
.........................................................................................................................................
.........................................................................................................................................
.........................................................................................................................................
.........................................................................................................................................
Question 27 continues on page 22
8
– 21 –317
Centre Number
Student Number

Question 27 (continued)
.........................................................................................................................................
.........................................................................................................................................
.........................................................................................................................................
.........................................................................................................................................
.........................................................................................................................................
.........................................................................................................................................
.........................................................................................................................................
.........................................................................................................................................
.........................................................................................................................................
.........................................................................................................................................
.........................................................................................................................................
.........................................................................................................................................
.........................................................................................................................................
.........................................................................................................................................
.........................................................................................................................................
.........................................................................................................................................
.........................................................................................................................................
.........................................................................................................................................
.........................................................................................................................................
.........................................................................................................................................
.........................................................................................................................................
.........................................................................................................................................
.........................................................................................................................................
.........................................................................................................................................
.........................................................................................................................................
.........................................................................................................................................
End of Question 27
– 22 –
© Board of Studies NSW 2005

2005 HIGHER SCHOOL CERTIFICATE EXAMINATION
Biology
Section II
25 marksAttempt ONE question from Questions 28–32Allow about 45 minutes for this section
Answer the question in a writing booklet. Extra writing booklets are available.
Pages
Question 28 Communication .................................................................... 24–25
Question 29 Biotechnology ............................................................................ 26
Question 30 Genetics: The Code Broken? ............................................... 27–29
Question 31 The Human Story ................................................................. 30–31
Question 32 Biochemistry ........................................................................ 32–33
– 23 –318

Question 28 — Communication (25 marks)
(a) The diagram provided is of the human eye.
(i) Identify the part of the organ labelled A.
(ii) Using TWO labelled diagrams, show how the eye accommodates thefocus of near and far objects.
(b) Two of your elderly relations have developed loss of sight. One case is due tocataracts and the other is due to myopia.
(i) Describe each of these conditions.
(ii) Compare the technologies available to correct these conditions.
(c) Hearing aids and cochlear implants are technological advances that have beendeveloped to assist people with hearing difficulties.
Evaluate the benefits and limitations of BOTH technologies.
Question 28 continues on page 25
7
4
2
3
1
A
– 24 –
Marks

Question 28 (continued)
(d) The diagram provides a pictorial representation of the structure of neurones.
(i) From the diagram, identify TWO differences between neurones.
(ii) Assess the use of prepared slides or micrographs when gatheringinformation about the structure of neurones.
(iii) Explain why NOT all stimuli generate an action potential.
End of Question 28
3
3
2
A
B
C
– 25 –
Marks

Question 29 — Biotechnology (25 marks)
(a) The equation for fermentation in the production of alcohol is
(i) What is the name of the product A in the above word equation?
(ii) Name and describe a modern industrial fermentation process thatproduces large quantities of consistent product.
(b) (i) Define the term recombinant DNA technology, and give an example.
(ii) Compare recombinant DNA technology and artificial selection.
(c) Research into biotechnology including medicine, animal biotechnology, andaquaculture, has led to the development of a variety of applications.
Evaluate the limitations and expected benefits of particular applications that youpresented in TWO of your case studies.
(d) The diagram represents the DNA profiles from a murder case.
(i) Justify which one of the suspects could have been the murderer.
(ii) Explain why a sample would be taken from the victim as well as thesuspects.
(iii) Outline the use of DNA fingerprinting as an investigation tool inforensic cases.
3
3
2
Victim
Suspect 1
Suspect 2
Evidence
DNA profile
7
4
2
3
1
Sugar alcoholyeast
A+
– 26 –
Marks

Question 30 — Genetics: The Code Broken? (25 marks)
(a) During your study of this option you constructed a model of DNA. The diagramrepresents a model made by a student.
(i) In this model, name TWO of the parts labelled X, Y and Z.
(ii) Is this a useful model of a DNA molecule? Support your choice withTWO reasons.
Question 30 continues on page 28
2
2
X
Z
Y
– 27 –
Marks

Question 30 (continued)
(b) The diagram shows the arrangement of human chromosomes. A chromosomalabnormality is circled.
(i) Determine how many chromosomes this person has, and name the typeof chromosomal disorder.
(ii) Compare the effect of germ line and somatic mutations on a species.
(c) The Human Genome Project has identified the DNA-base sequence of all humanchromosomes. A significant amount of work still needs to be done so that thisinformation can be used to benefit humans.
Using examples, evaluate the limitations and expected benefits of the HumanGenome Project.
Question 30 continues on page 29
7
4
2
1
6 7 8 9 10 11 12
2 3 4 5
13 14 15 16 17 18
19 20 21 22 X Y
– 28 –
Marks

Question 30 (continued)
(d) Indian corn has four grain types that involve combinations of colour (b) andappearance (r).
Four genes are involved, which are located on two pairs of homologouschromosomes (each gene on a separate chromosome). The alleles are:
B = black b = yellow R = round r = wrinkled
(i) The table below shows the results of a dihybrid cross between twoheterozygous parents, (BbRr × BbRr).
Using this data, calculate the ratio of phenotypes in this cross.
(ii) If, however, B and r are on one chromosome and b and R are on another,draw a Punnett square of a dihybrid cross (BbRr × BbRr). Include thephenotypic and genotypic ratios of the offspring.
(iii) Explain how cross-breeding experiments can identify the relativepositions of linked genes.
End of Question 30
4
3
1
Observed numberof offspring
144
48
48
16
256
Grain phenotype
Black and round
Black and wrinkled
Yellow and round
Yellow and wrinkled
Total
– 29 –
Marks

Question 31 — The Human Story (25 marks)
(a) A student was investigating evolutionary relationships between humans andother primates. The diagram models the data collected.
Chromosome 5 in apes and humans
(i) What is this type of analysis called?
(ii) Identify THREE ways in which this model is useful in showingevolutionary relationships.
(b) (i) Outline ONE feature for any TWO of the following groups into whichhumans are classified.
• primate
• hominid
• Homo sapiens
(ii) Discuss the difficulty of interpreting the past using only fossil records.
Question 31 continues on page 31
4
2
3
1
– 30 –
Marks
Awaiting Copyright Clearance

Question 31 (continued)
(c) Analyse future trends in biological evolution in terms of increased populationmobility, modern medicine and genetic engineering.
(d) In 2004 a team of Australian and Indonesian researchers outlined the discoveryof the remains of dwarf-sized people who lived on the island of Flores in CentralIndonesia. They belong to a species new to science and have been namedHomo floresiensis. Dating techniques suggest that the remains are up to 95 000years old.
Homo floresiensis were island people, no more than one-metre tall, with brainsthe size of newborn modern humans. However, they exhibited behaviouralsophistication and intelligence. Their discovery suggests that instead offollowing a simple evolutionary path, culminating in Homo sapiens, (Figure 1)human evolution developed more varied forms than previously thought(Figure 2).
Figure 1 Figure 2
(i) Distinguish between relative and absolute dating technique, and outlinean absolute dating technique that could be used to date the fossils ofHomo floresiensis.
(ii) Outline a mechanism that led to the development of Homo floresiensisas a distinct species.
(iii) Name the TWO models of human evolution shown in Figure 1 andFigure 2 and compare the evidence that supports them.
End of Question 31
3
2
3
H. neanderthalensis(Europe/Western Asia)
H. sapiens(worldwide)
H. heidelbergensis(Germany)
H. antecessor(Spain)
H. floresiensis(Indonesia)
H. erectus(Africa/Asia/Europe)
H. ergaster(Africa)
H. rudolfensis(Africa)
H. habilis(Africa)
0
1
2
Mill
ion
year
s ag
o
H. sapiens
↑
H. neanderthalensis
↑
H. heidelbergensis
↑
H. erectus
↑
H. ergaster
7
– 31 –
Marks
© NewScientist

Question 32 — Biochemistry (25 marks)
(a) In the late 1770s the Dutch scientist Jan Ingen-Housz performed a series ofexperiments shown in the diagrams.
(i) Name ONE pigment that can be extracted from leaves.
(ii) Identify THREE pieces of information that can be obtained from theseexperiments.
(b) Two species of plants, X and Y, have been selected for studies on photosynthesis.The plants are two months old, 30 cm tall and 900 g in weight. It is found thattheir oxygen production varies as shown in the table below.
(i) Based on the information provided, identify TWO microscopic structuraldifferences between plants X and Y. Support your answer using examples.
(ii) You processed information from secondary sources about lightabsorption and the Calvin cycle. Identify the sites of light absorption andthe Calvin cycle and explain their locations.
Question 32 continues on page 33
3
3
Volume of oxygen produced by species Y
(mL)
5
10
15
20
25
Volume of oxygen produced by species X
(mL)
2
4
6
8
10
Time(hour)
1
2
3
4
5
3
1
– 32 –
Marks
Awaiting Copyright Clearance

Question 32 (continued)
An understanding of photosynthetic biochemical pathways has impacted on thedevelopment of new technologies.
Evaluate the potential uses of photosynthesis in replacing at least THREEnamed materials presently obtained from other non-renewable resources.
(d) The following figure shows the absorption spectrum of chlorophyll-a.
The owners of a glasshouse are covering the glass with a filter to produce a cropin the shortest possible time.
(i) Explain which filter you would suggest.
(ii) Describe photosystems I and II and explain their role in photosynthesis.
End of paper
5
3
Chlorophyll-a
150
100
50
0400 700600500
Abs
orpt
ion
of li
ght
(arb
itrar
y un
its)
Blue Green Red
Wavelength (nm)
7
Green algae have had their photosyntheticpathways reprogrammed to produce hydrogenwhich can be used as an alternative energy source.
Wired Magazine, Issue 10.04, April 2002
(c)
– 33 –
Marks
M Rowland, 1992, Biology, Thomas Nelson and Sons Ltd, Walton-on-Thames, Surrey, p 145.

BLANK PAGE
© Board of Studies NSW 2005
– 34 –