:. APNs. LOS ANGELES, CALIFORNIA GEOBASE Inc..pdfPRELIMINARY GEOTECHNICAL EVALUATION WATIS TOWERS...
72
I i. ! j I l I I I I I I I I t ........ .. PRELIMINARY GEOTECHNICAL: EVALUATION WATTSTOWERS-.CULTURALCFlESCENT··. ... • :. < :.". • • : • • •• ' • APNs. 6065-.023-SOO; 906; 6065,.034-900 LOS ANGELES, CALIFORNIA ···GEOBASE SOIUROCK MECHANICS AND FOUNDATION ENGINEERING - ! ' ' :. ; ,, •'·· I . ·-. j ' . ·· .. :.,_ -;.
Transcript of :. APNs. LOS ANGELES, CALIFORNIA GEOBASE Inc..pdfPRELIMINARY GEOTECHNICAL EVALUATION WATIS TOWERS...

I i. ! j I
l I I I I I I I I
t
........ ~c-.
.. ~-
PRELIMINARY GEOTECHNICAL: EVALUATION
WATTSTOWERS-.CULTURALCFlESCENT··. ... ~-- • :. < :.". • • : • • •• ' •
APNs. 6065-.023-SOO; 906; 6065,.034-900
LOS ANGELES, CALIFORNIA
···GEOBASE SOIUROCK MECHANICS AND FOUNDATION ENGINEERING
- !
' ' :. ;
,, •'·· I
. ·-. j
'
. ·· .. :.,_ -;.

PRELIMINARY GEOTECHNICAL EVALUATION
WATIS TOWERS CULTURAL CRESCENT
APNs 6065-023-900, 906; 6065-034-900
Los Angeles, California
Prepared for:
Community Redevelopment Agency
City of Los Angeles, California
By:
GEOBASE, INC.
23362 Peralta, Units 4 and 6
Laguna Hills, California
(714) 770-1643
January 1998
Project No. P .279.02.00

TABLE OF CONTENTS
I. INTRODUCTION 1.1 General 1.2 Objectives and Scope of Services
II. SITE AND PROJECT DESCRIPTION 2.1 Site Description 2.2 Project Description
Ill. SITE INVESTIGATIONS 3.1 Field Program 3.2 Laboratory Testing
IV. GEOLOGY 4.1 Geological Setting 4.2 Site Geologic Conditions 4.3 Subsoil Conditions 4.4 Groundwater Conditions 4.5 Test Pits
V. SEISMOLOGICAL CONDITIONS 5.1 Faulting 5.2 Earthquake Effects
5.2.1 Site Accelerations 5.2.2 Tsunamis/Seiche 5.2.3 Settlement 5.2.4 Liquefaction 5.2.5 Surface Rupture 5.2.6 Landsliding
5.3 Seismic Risk Analysis 5.4 Design Response Spectra 5.5 Site Coefficient 5.6 Soil Profile Type and Seismic Source Type
VI. CONCLUSIONS
VII. SITE DEVELOPMENT RECOMMENDATIONS 7.1 General 7.2 Clearing 7.3 Excavatability 7.4 Fill Placement
7.4.1 Preparation of Surface Soils 7.4.2 Compaction 7.4.3 Fill Material
7.5 Subgrade Preparation 7.6 Drainage
·?.?·Temporary Excavations 7.7.1 Unsupported Excavations
- i -
1 1 1
2 2 2
2 2 3
4 4 4 5 5 5
6 6 6 6 9 9 9 9 10 10 10 11 11
11
11 11 12 12 12 12 12 13 13 13 14 14

TABLE OF CONTENTS continued ...
VII. SITE DEVELOPMENT RECOMMENDATIONS continued ... 7.7.2 Shored Excavations
. 7.8 Trench Backfill
VIII. PRELIMINARY FOUNDATION RECOMMENDATIONS 8.1 General · 8.2 Foundations 8.3 Retaining/Basement Walls
8.3.1 Earth Pressures 8.3.2 Wall Backfill.
8.4 Floor Slabs 8.5 Pavement Areas
IX. SOIL CORROSIVITY -- IMPLICATIONS
X. RECOMMENDATION FOR ADDITIONAL WORK
XI. LIMITATIONS
REFERENCES
IMPORTANT INFORMATION ABOUT YOUR GEOTECHNICAL REPORT
LIST OF TABLES
Table I -- Earthquake Parameters Table II -- Historic Earthquake Epicenters
- ii -
Page
14 16
16 16 16 17 17 17 18 18
18
19
19
20
7 8

LIST OF APPENDICES
APPENDIX A
'=igure A-1 Location Map Figure A-2 Boring and Test Pit Locations Plan Figure A-3 California Fault Map Figure A-4 Historic Earthquakes -- 1800 to 1997 Figure A-5 Seismic Recurrence Curve Figure A-6 Seismic Risk Analysis Results -- Probability of Exceedance Figure A-7 Seismic Risk Analysis Results --Average Return Period Figure A-8 · Horizontal Design Response Spectra-- Acceleration 0.32g Figure A-9 Horizontal Design Response Spectra -- Acceleration 0.21 g Figure A-1 0 Earth Pressures and Tieback Geometry for Shoring Figure A-11 Additional Lateral Earth Pressures on Shoring Figure A-12 Typical Wall Backfill Detail
APPENDIX B
Figure B-1 Explanation of Terms and Symbols Used Figure B-2 Log of Boring B-1 Figure B-3 Log of Boring B-2 Figure B-4 Log of Boring B-3 Figure B-5 Log of Boring B-4 Figure B-6 Log of Boring B-5 Figure B-7 Log of Boring B-6 Figure B-8 Log of Boring B-7 -:igure B-9 Log of Boring B-8 rigure B-1 0 Log of Boring B-9 Figure B-11 Log of Boring B-1 0 Figure B-12 Log of Boring B-11 Figure B-13 Log of Boring TP-1 Figure B-14 Log of Boring TP-2 Figure B-15 Log of Boring TP-3 Figure B-16 Log of Boring TP-4 Figure B-17 Log of Boring TP-5 Figure B-18 Log of Boring TP-6
APPENDIX C
Figure C-1 Summary of Laboratory Test Results Figure C-2 Direct Shear Test Results Figure C-3 Direct Shear Test Results Figure C-4 Direct Shear Test Results Figure C-5 Consolidation Test Results Figure C-6 Consolidation Test Results Figure C-7 Consolidation Test Results Figure C-8 Ex~ansion Potential, Corrosivity Series and Resistance ("R") Value Test Results
- iii -
GEOBASF INr

P.279.02.00 January 5, 1998
Page 1 of 20
I. INTRODUCTION
1.1 General
The City of Los Angeles is planning construction of the Watts Towers Cultural Crescent, in Los Angeles, California. GEOBASE, Inc. (GEOBASE) was authorized by the City of Los Angeles, Community Redevelopment Agency (LACRA) to carry out a preliminary geotechnical evaluation of the proposed site. The work was coordinated by Ms. Sandra Sunday, P.E., of the Community Redevelopment Agency. The site location is. shown on Figure A-1, Appendix A.
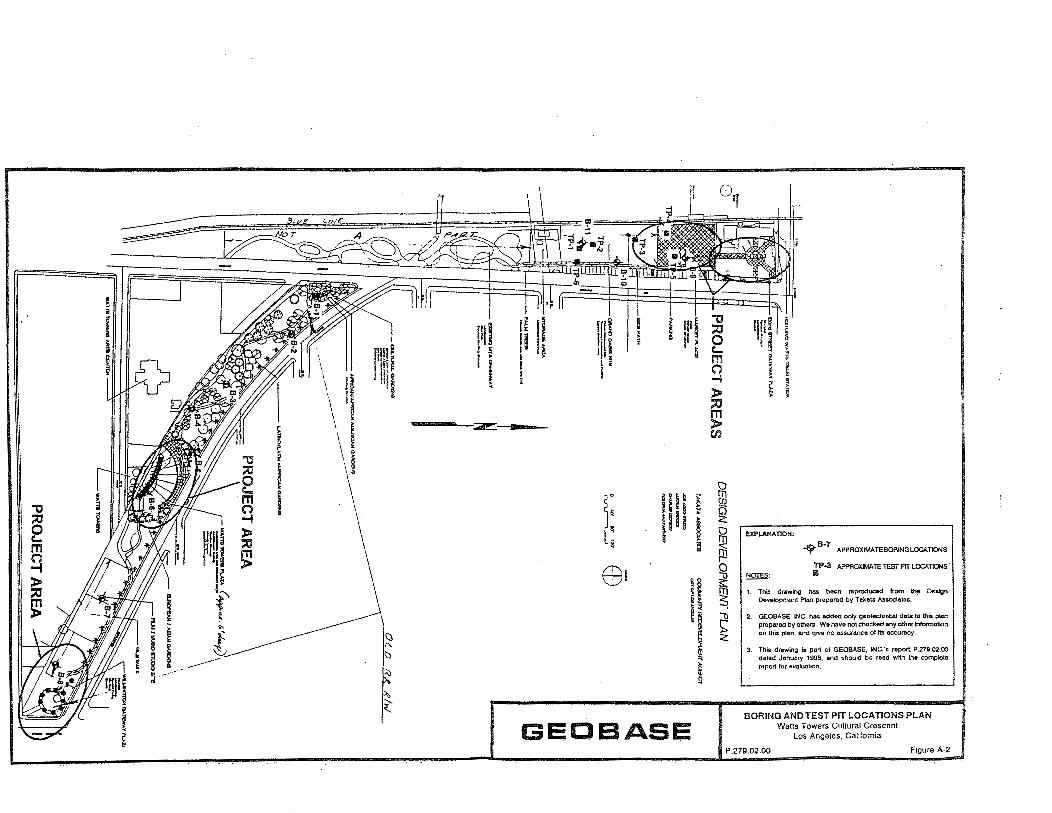
For this preliminary geotechnical evaluation, we were provided with the Design and Development Plan, prepared by Takata Associates. The Design and Development Plan is reproduced herein as Figure A-2, Appendix A, Boring and Test Pit Locations Plan.
This report describes the site investigation and summarizes the results of both field and laboratory testing .. These results are discussed with reference to the proposed development. General recommendations pertinent to suitable site de~elopment and preliminary foundation design recommendations are given. Construction guidelines related to the geotechnical aspects of the project are also addressed ..
1.2 Objectives and Scope of Services
The objectives of the geotechnical services were to evaluate the geological and seismological conditions at the site, and obtain preliminary information on the subsurface conditions in order to assist with an evaluation of the proposed site for the planned development. As part of the geotechnical services, six (6) test pits were excavated at the site to determine the thickness of the gravelly fill and locations of the existing railroad ties encountered during a previous investigation by others (reference 1 ).
The specific services provided during the course of this geotechnical investigation included:
Review of previous geological, geotechnical and seismological reports, and maps pertinent to the subject site;
Field exploration program consisting of drilling eleven (11) borings and excavating six (6) test pits. The borings were logged, and samples representative of the materials encountered were selected for laboratory testing;
Selection of appropriate laboratory tests and laboratory testing;
Evaluation and engineering analyses of site data, field observations, field test results and laboratory test results; and,
Preparation of this report describing the field investigation, and summarizing the results of both field and laboratory testing, and engineering analyses. A preliminary geotechnical assessment of the

P.279.02.00 January 5, 1998
Page 2 of 20
II.
2.1
site, and general recommendations for planing and preliminary design purposes are also provided in this report.
SITE AND PROJECT DESCRIPTION
Site Description
The proposed site for the Watts Towers Cultural Crescent development consists of two (2) parcels. The northern parcel is located between Graham Avenue and Metro B!ue Line. It is bounded by Department of Water and Power (DWP) Branch Office to the north and <"Xisnng MTA Urban Greenways to the south.
·The site is relatively flat, and currently vacant and unpaveL·. Scattered gravels and several concrete pieces, were observed at the surface of the site.
The southern parcel is located between the Watts Tower Art Center and Watts Towers, and Santa Ana Boulevard. It is bounded by the intersection of Graham avenue and Santa Ana Boulevard to the north, and 108th Street and Wilmington Avenue to the south. The area is relatively flat except for an earth mound running in a north south direction through the middle of the entire site. Based on the reference 1 report, the site has previously served a railroad track right-of-way. The elevated mound appears to be remnants of the railroad embankment.
2.2 Project Description
Bases on the information provided in the Design Development Plan and discussions with LACRA personnel, the proposed Watts Towers Cultural Crescent development is planned to consist of:
Ill.
3.1
commercial sites with underground parking approximately twenty-five (25) feet in depth and a market place at the northern parcel.
landscape areas, Watts Tower Plaza Amphitheater, approxim.ately four (4) to five (5) feet deep, and commercial sites with underground parking based approximately twenty-five (25) feet below grade at the southern parcel.
SITE INVESTIGATION
Field Program
The field work for this geotechnical investigation was carried out on December 12, 1997 and consisted of advancing eleven ( 11) borings and six (6) test pits at the site, at the approximate locations shown on the Boring and Test Pit Locations Plan, Figure A-2, Appendix A. The borings and test pits were located in the field utilizing cloth tape. Therefore, the boring and test pit locations should be considered accurate only to the degree implied by the method used.
l,FORASI= INr

\
P.279.02.00 January 5, 1998
Page 3 of 20
The borings were advanced to a maximum depth of fifty-one and one-half (51.5) feet using a CME-75 drill rig fitted with hdllow stem augers. The Log of Borings, together with an Explanation of Terms and Symbols used are given in Appendix 8, Figures 8-1 thru 8-12, inclusive. The test pits were excavated at the northern parcel with a backhoe and advanced to a maximum depth of four (4) feet. The !og of test pits are provided on Figures 8-13 thru 8-18, inclusive, Appendix B.
Field testing consisted of the Standard Penetration Test (SPT). The SPT test involves failure of the soil around the tip of a split spoon sampler for a condition of constant energy transmittal. The split spoon, two (2) inches outside diameterand one and three-eights (13/8) inches inside diameter, is driven eighteen (18) inches and the number of blows required to drive the sampler the last foot is recorded as the "N" value or SPT blow count. The driving energy is provided by a 140 pound weight dropping thirty (30) inches.
Sampling consisted of:
3.2
Collection of disturbed samples at selected locations retrieved from the auger and test pits;
Collection of samples retrieved from the Standard Penetration Test (SPT) split spoon; and,
Collection of soil samples at selected locations using a California Modified Sampler. The soil samples were retained in a series of brass rings, each having an inside diameter of 2.41 inches and a height of one (1) inch. These ring samples were placed in. close-fitting, moisture tight containers for shipment to the laboratory.
Laboratory Testing
The samples obtained during the field program were returned to the laboratory for visual examination and testing. The soils were classified in accordance with ASTM 0 2487 and 0 2488.
The laboratory testing program consisted of the following:
• Laboratory determination of water (moisture) content of soils, rock and soil-aggregate mixtures (ASTM 0 2216) and dry density;
Particle size analysis of soils (ASTM 0 422);
Direct shear test of soils (ASTM 0 3080);
Consolidation testing of soils (ASTM 0 2435);
A-Value test of soils (Cal.301);
• Expansion potential of soils (USC 29-2); and
• Water-soluble sulfates content of soils (CAL. 417 A), pH, electrical resistivity and soluble chlorides.
The field and laboratory test results are presented on the Log of Borings and Test Pits, Figures B-2 thru
GEOBASF_ INr

. P.279.02.00 Page 4 of 20 January 5, 1998
B-18, inclusive, Appendix B, where applicable, and in Appendix C.
IV. GEOLOGY
4.1 Geological Setting
The project site consists of two (2) parcels and is located in the northwest central portion of the Los Angeles Basin. The Los Angeles Basin is a broad alluvia ted, northwest trending structural trough- which is filled to capacity with a thick sequence of sedimentary bedrock and overlying alluvium ranging from late Cretaceous to Holocene age. In the site region, the sediment cover overlying the basement rock is approximately 30,000 feet thick. Structurally, the basin has slowly subsided as marine and non-marine sediments accumulate_d for many millions of years. Mountain ranges and series of low hills bound the basin on all sides with the exception of the westerly margin which is formed by the coast line. The closest uplands to the site are the Rosecrans and Dominguez Hills which lie approximately 1.9 miles ~o the southwest of the site.
The central portion of the basin is characterized as having very low relief with subdued drainages. Regionally the land surface grades down to the south-southeast at approximately fifteen (15) feet per mile and towards the Los Angeles River Channel. The improved flood control river channel lies approximately 3.8 miles to the east of the site. Compton Wash, a secondary flood control channel, drains south and lies 0.8 miles to the west/southwest of the site. Active oil fields lie approximately two {2) to three (3) miles to the southwest of the project site within the Rosecrans and Dominguez Hills. These hills consist of local faulted anticlines (petroleum reservoirs) which are associated with the Newport-Inglewood structural zone of deformation.
Tectonically, the Los Angeles Basin is an active region for faulting and earthquakes. Mapped active faults project along the base of many of the basin bounding uplands. Even at great depth, the basin is underlain by suspected low angle blind thrust faults which rupture infrequently (e.g. Whittier Narrows [1987] and Northridge [1994] earthquakes). This faulting and earthquake activity are in direct response to continued north-south compression across the basin. The compression is caused by movement along the active San Andreas Fault System which forms the boundary between the North American and Pacific tectonic plates.
4.2 Site Geologic Conditions
The project site is situated in an area which is totally urbanized by commercial and residential development. The land surface prior to development was one of very low and well rounded relief. Recent river alluvium mantles the area and was deposited by the Los Angeles River prior to its historic improvements. The project site lies between 100 and 105 feet above sea level.
The Holocene (recent) age· alluvium beneath the ground surface is approximately fifty (50) feet thick based on projected water well data (DWR, 1961 ). Exploratory borings, drilled at both sites to depths of fifty (50) feet, indicate that the recent alluvium consists mostly of unconsolidated, medium dense, thin layers and
GEOBASF_ INr

. P.279.02.00 Page 5 of 20 January 5, 1998
lenses of silty sands and sand sized materials. At a depth of approximately fifteen (15) feet interbedded clays and sands were encountered. Pleistocene age older river alluvium underlies the recent deposits to a depth of approximately 1 ,200 feet and consists of sands and gravel layers which form the basin groundwater aquifers. Bedrock assigned to the marine Pliocene age Pico Formation (siltstone) forms a thick section beneath the alluvial sequence.
· The project site lies within the central basin groundwater pressure area (Downey Plain). This is a zone where groundwater has been extracted from the confined aquifers within the Pleistocene age (older alluvium) deposits. Six (6) aquifers under hydrostatic conditions have been identified within the site region. The depth to groundwater for the deep aquifers averages about fifty (50) feet below sea level or onehundred and fifty (150) feet of depth below the ground surface (Los Angeles Co. Flood Control District, 1982). Prior to pumping in the basin, pressurized groundwater was within about fifty (50) feet of the surface.
4.3 Subsoil Conditions
The generalized stratigraphic profile consists of up to five (5) feet of fill soils (gravelly sands and silty sands) underlain by eleven (11) to eighteen feet of native sands and silty sands which are in turn underlain by interbeded silts, silty sands and clays.
Based on SPT test results at the boring locations, the underlying native soils are considered to be medium dense to very dense, and very stiff to hard for sands and clays, respectively.
4.4 Groundwater Conditions
Groundwater was encountered at approximately twenty-five (25) feet below existing grade at boring B-1 0 and B-11 locations (northern parcel) at the time of the site investigation; however, groundwater conditions may be altered by geologic detail away from the boring location, by seasonal and meteorological variations, and by construction activity.
As stated in subsection 4.2, the depth to groundwater is approximately 150 feet deep in the vicinity of the site. The indurated silts and clays encountered at boring B-1 0 and B-11 locations most likely form a relatively impermeable layer which causes groundwater to perch.
4.5 Test Pits
A total of six (6) test pits up to a depth of approximately four (4) feet were excavated at the northern parcel. The objectives of these test pits were to determine the locations and extent of existing railroad ties in this area.
Two and one-half (2.5) to four (4) feet of fill soils (gravelly sands) were encountered at all six (6) test pits locations at the northern parcel. The gravelly sands contain occasional cobbles, boulders and

.• P.279.02.00 January 5, 1998
Page 6 of 20
concrete/asphaltic concrete pieces up to eighteen (18) inches in largest dimension. No railroad ties were encountered at the test pit locations.
v. SEISMOLOGICAL CONDITIONS
5.1 Faulting
There are no known or mapped faults that if projected would trend directly towards or through the subject property;' however, due to the thick sequence of Pleistocene age sediments in the central portion of the basin, faults if present go undetected. Current thinking among seismologists is that most of the Los angeles Basin is underlain by more than one blind thrust fault. These are deeply buried, very low angle,
. probably north dipping faults that do not project to the ground surface. These thrust faults can produce major earthquakes anywhere beneath the basin surface but direct surface fault rupture is unlikely. The site does not lie within an Alquiest-Priolo Earthquake Fault Zone as designated by the California division of Mines and Geology. For these reasons, the possibility of direct surface fault rupture in proximity to the property is considered unlikely.
Damaging earthquakes of Magnitude M5.5 or greater occur on an average every two (2) years in Southern California. Most of these are associated with faults that have known Holocene (last 10,000 years) displacements or have produced historic earthquakes. Three (3) near field faults, namely the NewportInglewood (Avalon/Compton segment), Palos Verdes and Santa Monica-Hollywood will have the greatest effect on the site with regard to strong earthquake ground motions should they rupture opposite the property. At this time very little is known about the inferred blind thrust fault(s) that might underlie the basin. Their slip surfaces .(hypocenter locations) are at an assumed depth of greater than fifteen (15) miles and the ground motions created by such a blind thrust fault rupture, in theory, could be excessively high. If such an event was to occur directly below the site, ground motions may exceed those produced by the 1994, Magnitude M6.7 Northridge Earthquake. ·
Seismic hazards within the site can be attributed to ground shaking resulting from events on distant active faults. Listed on Table I are the active and potentially active faults which can significantly affect the site. Figure A-3, Appendix A, shows the geographic relationship of these faults to the site.
Historic earthquake epicenters from 1800 to 1997 within a sixty-five (65) mile radius of the site and exceeding a Magnitude of M4.0 on the Richter Scale are shown on Figure A-4, Appendix A. Historic earthquakes exceeding a Magnitude of M6.0 are tabulated on Table II. The seismic recurrence curve based on historical earthquakes is provided in Figure A-5, Appendix A.
5.2 Earthquake Effects
5.2.1 Site Accelerations
The Newport Inglewood and Palos Verdes faults, due to their proximity to the site, will have the greatest

P.279.0r 1 Page 7 ( )
January '998
TABLE I EARTHQUAKE PARAMETERS
Approximate Maximum Magnitude Peak Horizontal · -- -Repeatable -- --Duration Of Strong Ground
Fault Distance from Richter Scale Acceleration (g) Acceleration (g) Shaking (Sec)
Site (Mile) CRED. ·PROS. CRED. PROS. CRED. PROS. CRED. PROE3.
Newport-Inglewood-Offshore 4 7.0 6.5 0.42 0.32 0.27 0.21 26 21 Elysian Park Seismic Zone 7 6.75 6.0 0.26 0.18 0.17 0.12 23 15 Whittier-North Elsinore 10 7.0 6.5 0;23 0.18 0.15 0.12 26 21 Santa Monica - Hollywood 11 7.5 7.0 0.26 0.20 0.17 0.13 32 26 Raymond 12 6.75 6.25 0.17 0.13 0.11 0.08 23 18 Palos Verdes-Coron. B. - A. Blan 12 7.5 7.0 0.26 0.20 0.17 0.13 32 26 Verdugo 13 6.7 4.5 0.15 0.05 0.10 0.03 23 4 Sierra Madre-San Fernando 18 7.5 7.0 0.17 0.13 0.11 0.08 32 26 San Gabriel 19 7.0 5.75 0.12 0.06 0.08 0.04 26 12 Malibu Coast 20 7.5 6.5 0.15 0.09 0.10 0.06 32 21 Northridge Hills 24 6.5 5.0 0.07 0.03 0.05 0.02 21 4 Cucamonga 27 7.0 6.5 0.08 0.06 0.05 0.04 26 21 Chino 29 7.0 5.5 0.07 0.03 0.05 0.02 26 10 Santa Susana 29 7.0 6.0 0.07 0.04 0.05 0.03 26 15 Anacapa 30 7.0 5.0 0.07 0.02 0.05 0.01 26 4 Simi-Santa Rosa 35 7.0 5.25 0.06 0.02 0.04 0.01 26 7 Holser 37 6.6 5.75 0.04 0.03 0.03 0.02 22 12 San Andreas (Mojave) 41 8.3 8.0 0.09 0.08 0.06 0.04 40 37 Oak Ridge (On shore) 42 7.2 6.5 0.05 0.03 0.0~ 0.02 28 21 Glen. Helen - Lytle Cr.-Claremont 43 7.0 6.5 0.04 0.03 0.03 0.02 26 21 Elsinore 43 7.5 6.75 0.06 0.04 0.04 0.03 32 23 Catalina Escarpment 44 7.0 6.25 0.04 0.03 0.03 0.02 26 18 San Cayetano 45 7.5 6.25 0.05 0.03 0.03 0.02 32 18 Clearwater 45 7.0 3.0 0.04 0.01 0.03 0.01 26 4 San Andreas (S.Bem. Mtn.) 50 8.0 6.75 0.06 0.03 0.04 0.03 37 23 San Clemente - San Isidro 50 8.0 6.5 0.06 0.03 0.04 0.03 37 21 North Frontal Zone 51 7.7 5.75 0.05 0.02 0.03 0.01 34 12 Oak Ridge (Offshore) 56 7.2 5.5 0.03 0.01 0.02 0.01 28 10 Pine Mountain 56 7.0 4.25 0.03 0.01 0.02 0.01 26 4 Santa Ynez (East) 58 7.5 5.25 0.04 0.01 0.03 0.01 32 7 San Gorgonio - Banning 58 7.5 7.0 0.04 0.03 0.03 0.02 32 26 Ventura ~ Pitas Point 59 7.2 7.75 0.03 0.01 0.02 0.01 28 12
GEOBASE, INC.

. '
p .279.02.00 January 5, 1998
TABLE II HISTORIC EARTHQUAKE EPICENTERS - 1800 to 1997
Page 8 of 20
(exceeding six [6] on the Richter Scale of Magnitude within a sixty-five (65] mile radius of the project site)
DATE RICHTER MAGNITUDE APPROXIMATE DISTANCE SITE TO SITE ACCELERATION (mm/dd/yy) (M) EPICENTER {g)
{miles)
12/08/1812 7.0 45 0.04 .<'
09/24/1827 7.0 44 0.04
07/11/1855 6.3 14 0.12
12/16/1858 7.0 43 0.04
04/04/1893 6.0 32 0.04
07/30/1894 6.0 44 0.02
07/22/1899 6.5 49 0.03
09/03/1905 5.3* 5 0.15
05/15/1910 6.0 51 0.02
07/23/1923 6.25 57 0.02
03/11/1933 6.3 27 0.05
02/09/1971 6.4 34 0.04
10/01/1987 5.9 13 0.10
01/17/1994 6.7 19 0.10
* Largest Site Acceleration During Time Period
l,F()RASJ= INr

. P.279.02.00 Page 9 of 20 January 5, 1998
effect on the project site relative to strong ground shaking. Other more distant active faults may al~o produce
notable ground motions but not to the degree as the Newport-Inglewood fault. Table I was prepared to show the anticipated ground motions at the site from the various regional active faults. The maximum probable event is the highest magnitude based on a 100 year return period. The maximum credible is the highest possible magnitude based on the known tectonic framework of any one particular fault.
Based on calculated empirical deterministic data, the Newport-Inglewood fault could produce a Magnitude M6.5 (maximum probable) earthquake at a distance of approximately four (4) miles from the site. Peak horizontal ground. accelerations could range up to 0.32g with repeatable accelerations of 0.21 g lasting up to twenty-one (21) to twenty-six (26) seconds.
5.2.2 Tsunamis/Seiche
The property is far enough from the coast or large inland body of water to preclude damage from a tsunami or seiche wave, or inundation caused by the rupture of an up-gradient reservoir.
5.2.3 Settlement
A very strong earthquake conceivably could cause minor regional subsidence within the basin; however, such subsidence would not be expected to be differential across the site.
5.2.4 Liquefaction
Liquefaction occurs when the pore pressures generated within a soil mass equals the overburden pressure. This results in a loss of strength and the soil then possesses a certain degree of mobility.
Factors considered to evaluate liquefaction potential include groundwater conditions, soil type, particle size distribution, earthquake magnitude and acceleration, and soil density obtained through the Standard Penetration Test (SPT). Soils subject to liquefaction comprise saturated fine grained sands to coarse silts.
Coarser-grained soils are considered free-draining and therefore dissipate excess pore pressures, while finegrained soils possess undrained shear strength.
Liquefaction at this site is considered unlikely due to the clayey layers and the medium dense to dense
character of the granular soils below proposed foundation level (twenty-five [25] feet).
5.2.5 Surface Rupture
There are no known or mapped capable faults trending toward or through the site area. Therefore, the ;otential for direct surface rupture is considered low.
GEOBASE. INC_

P.279.02.00 January 5, 1998
.5.2.6 Landslic;ling
Page 10 of 20
The site is relatively flat and not near any upland slopes. This precludes the potential for seismically induced or static landsliding.
5.3 Seismic Risk Analysis
The risk analysis is based on the premise that moderate to large earthquakes occur on mappable Quaternary faults and that the occurrence rate of earthquakes on each fault is proportional to the Quaternary fault-sliprate. This analysis assumes that earthquakes are distributed uniformly and therefore does not consider when the last earthquake occurred on the fault. The length of rupture of the fault as a function of earthquake magnitude is accounted for, and ground motion estimates at' a site are made using the magnitude of the earthquake and the closest distance from the site to the rupture zone. The risk analysis summarized on Figure A-6, Appendix A, has explicitly taken into account uncertainties associated with:
• The earthquake magnitude;
• The rupture length given magnitude;
• The location of the rupture zone on the fault;
• The maximum possible magnitude of earthquakes; and,
• The acceleration at the site given magnitude of earthquake and distance from the rupture zone to the site.
It can be noted from Figure A-6, Appendix A, that the ten (1 0) percent probability of exceedance in fifty (50) years corresponds to the maximum probable earthquake acceleration. The ten (1 0) percent probability of exceedance is the acceleration that is recommended by the Los Angeles County Fire Department in their "RMPP Guide". This acceleration of 0.32g, as noted in Figure A-7, Appendix A, has an estimated average return period of 500 years.
5.4 Design Response Spectra
The seismic response of a structure or element is dependent upon its strength, damping characteristics, and the stress-strain relationship for the structure considered. Response design spectra for maximum probable (equal to ten [1 0] percent probability of exceedance in fifty [50] years) and repeatable accelerations are provided as Figures A-8 and A-9, Appendix A, respectively. The response spectrum is defined as a graphical relationship of maximum response of a single-degree-of-freedom elastic system with damping to dynamic motion or forces. The most usual measures of response are maximum displacement, D, which is a measure of the strain in the spring element of the system; maximum pseudo relative velocity, V, which is a measure
~f the energy absorption in the spring of the system; and maximum pseudo acceleration, A, which is a measure of the maximum force in the spring of the system.
GEOBASF_ INC:

P.279.02.00 January 5, 1998
Page 11 of 20
To account for large period motions and low frequencies (Newmark and Hall, 1982), the spectra provided in Figures A-8, A-9, and A-10, Appendix A, have been modified by taking the velocity spectral response value to vary as the period to the one-third (1/3) power. In addition, the spectrum was considered to correspond to a constant displacement equal to amplified ground displacements for periods longer than approximately six (6) seconds.
It is suggested that the design spectrum for vertical response be considered equal to two-thirds (2/3) that for horizontal respo,nse. The responses for motions in the various directions (horizontal and vertical) may not occur at the same time. It is reasonable to combine the effects of the several components of motion in a probabilistic manner, by taking the maximum stress, deflection, or other specific response as the square root of the sums of the squares of the corresponding responses to the individual components of motion.
5.5 Site Coefficient
Based on a review of the local soil and geologic conditions, the site may be classified as Soil Profile S2. Therefore, a site coefficient of 1.2 may be used for the Watts Towers Crescent project.
5.6 Soil Profile Type and Seismic Source Type
Based on the 1997 Uniform Building Code the project falls into the following categories:
VI.
Soil Profile Type: s0 Seismic Source Type: B
CONCLUSIONS
Based on the results of our site investigation, and geologic and seismicity study, it is our opinion that the site is suitable for the proposed development. From a geotechnical engineering standpoint, the following observations which may influence design and constru·ction decisions were noted.
• The subgrade soils at both the northern and southern parcels are saturated at proposed subgrade elevations. Further, groundwater was measured at the northern parcel at subgrade elevation, at the boring locations, immediately subsequent to drilling.
• Layers of silt and clay soils, above proposed subgrade elevation, with moisture contents above optimum were also noted· at both the northern and southern parcels.
VII. SITE DEVELOPMENT RECOMMENDATIONS.
7.1 General
The proposed Watts Towers Cultural Crescent will consist of commercial developments with underground ,Jarking, Watts Tower Plaza amphitheater and landscape areas. The underground parking will be based
GFORASI= INr

P.279.02.00 January 5, 1998
Page 12 of 20
· · approximately twenty-five (25) feet below existing grade and the amphitheater up to approximately four (4) to five (5) feet deep. Structural loads are not available at this time.
The proposed development is feasible from a geotechnical· engineering standpoint. Project plans and specifications should take into account the appropriate geotechnical features of the site and conform to the geotechnical recommendations.
7.2 . Clearing
All surface vegetation, asphaltic concrete, trash and debris should be cleared and removed from the proposed site. Soils with organic inclusions and particles over six (6) inches in largest dimension should be removed from the construction areas. Topsoil, if any, may be stockpiled for future use.
Underground facilities such as utilities, pipes or underground storage tanks may exist at the site. Removar of underground tanks is subject to state law as regulated by County or City Health and/or Fire Department agencies.· If storage tanks containing hazardous or unknown substances are encountered, the proper authorities must be notified prior to any attempts at removing such objects.
Septic tanks should be removed in their entirety. Cesspools or seepage pits should be pumped of their contents and removed in the.ir entirety.
Any water wells, if encountered during const,ruction, should be exposed and capped in accordance with the requirements of the regulating agencies.
Depressions resulting from the removal of buried obstructions· should be backfilled with properly compacted material.
7.3 Excavatability
All types of deposits encountered in the borings are considered economically rippable in open excavations with conventional grading and excavation equipment.
7.4 Fill Placement
7.4.1 Preparation of Surface Soils
Prior to placing any fill, the exposed surface soils should be scarified to a minimum depth of six (6) to eight· (8) inches, moisture conditioned or dried to near optimum moisture conte~t and compacted to a minimum of· ninety (90) percent relative compaction, based on ASTM D 1557.
7.4.2 Compaction
Cohesive soils should be placed in loose lifts not exceeding six (6) inches, moisture-conditioned or dried to
GE=ORASI= INr

. P.279.02.00 Page 13 of 20 January 5, 1998
.:1pproximately two (2) to four (4) percentage points above optimum, and compacted to a minimum of ninety (90) percent relative compaction (ASTM D 1557).
Granular fill materials should be placed in loose lifts of six (6) to eight (8) inches, moisture-conditioned or dried to near optimum, and compacted to a minimum of ninety (90) percent relative compaction (ASTM D 1557).
7.4.3 Fill Material
Based on observations at the boring locations, the upper sixteen {16) to twenty-four (24) feet of subsoils at the site consist of primarily granular soils. These on-site granular soils possess a "very low" expansion potential. These soils may be reused as compacted fill provided they are free of organics, deleterious materials, debris and particles over six (6) inches in largest dimension.
Any soils imported to the site for use as fill for subgrade materials should be predominantly granular and nonexpansive (Expansion Index less than twenty [20]), and approved by the Geotechnical Engineer prior to importing.
7.5 Subgrade Preparation
-rhe areas within the underground parking should be taken down to the subgrade elevation. The exposed subgrade should be observed by GEOBASE to verify the removal of all unsuitable soils. Areas where the subgrade soils have been disturbed should be reworked and the materials compacted as described in subsection 7.4. Due to the wet nature of the subgrade soils, stabilization of the subgrade may be required prior to recompaction. Stabilization may involve overexcavation and placement of a rock layer and filter fabric.
All existing fills within the construction areas should be removed and replaced asproperly compacted fill, unless certified. The lateral extent of removal beyond the construction areas should be at least equal to the depth of fill. Undocumented fills varying from one (1) to four (4) feet in thickness were encountered at various boring locations. If undocumented fills are observed to· extend deeper or at other locations during construction, they should be removed and replaced as properly compacted fill. The exposed subgrade should be observed to verify the removal of all unsuitable materials.
The amphitheater, walkways and flatwork areas and within two (2) feet of their proposed limits should be underlain by a uniformly compacted fill blanket a minimum of two (2) feet in thickness. Based on observations at the boring locations, the thickness of undocumented fill soils may vary from one (1) to four (4) feet. Therefore, overexcavation of the natural soils will be required in the amphitheater area.
7.6 Drainage
To enhance future site performance, it is recommended that all pad drainage be collected and directed away om proposed structures and temporary cut slopes to disposal areas off site. For soils areas, we recommend
that a minimum of two {2) percent gradient away from foundation elements be maintained. It is important that

t
P.279.02.00 Page 14 of 20 January 5, 1998
drainage be directed away from foundations and that proper drainage patterns be estciblished at the time of construction and maintained throughout the life of the structures.
Care should be exercised in controlling surface runoff into the temporary cut slopes, if used for the basement excavation, to prevent erosion of the slope surfaces.
7.7 Temporary Excavations
Temporary construction excavations are anticipated for construction of utility trenches, amphitheater and the underground parking areas. The following recommendations are provided for planning purposes only. Detailed investigations will be required to establish soil parameters for final design.
7.7.1 Unsupported Excavations
Temporary construction excavations in soils -may- be- made vertically without shoring to a depth of approximately three (3) to four (4) feet below adjacent surrounding grade. For deeper cuts in soils, the slopes should be properly shored as discussed in subsection 7.7.2 or sloped back at least 1 H:1 V (Horizontai:Vertical) or flatter. The exposed slope face should be kept moist (but not saturated) during construction to reduce local sloughing. No surcharge loads should be permitted. within a horizontal distance equal to the height of cut from the toe of excavation unless the cut is properly shored. Excavations that extend below an imaginary plane inclined at forty-five (45) degrees below the edge of any nearby adjacent existing site facilities should be properly shored to maintain foundation support of the adjacent structures.
All excavations and shoring systems should meet, as a minimum, the requirements given in the State of California Occupational Safety and H_ealth Standards. Stability of temporary slopes are the responsibility of the contractor.
7.7.2 Shored Excavations
In areas where space does not permit sloped excavations, temporary shoring may be used to support vertically cut excavations. In the following paragraphs, recommendations are provided for both cantilevered and braced/tied back shoring.
All shoring systems should meet minimal requirements given in the State of California Occupational Safety and Health Standards.
For excavation depths of ten (1 0) to fifteen (15) feet a cantilevered shoring system may be used only in areas where lateral movement of soils behind the wall can be tolerated. A braced or tieback shoring system should be used in areas where the performance of the adjacent structures are susceptible to movements and for excavation depths in excess of fifteen (15) feet.
remporary shoring walls supporting a horizontal surface should be designed to resist earth pressures, excluding surcharge loads, as follows:

,\ P.279.02.00 Page 15 of 20 January 5, 1998
For cantilever walls, use an equivalent fluid pressure of thirty-five (35) pcf (triangular pressure distribution).
• For braced/tieback wall, use a rectangular pressure distribution of twenty-five {25) H psf; where H is height of wall above base of excavation in feet.
Figure A-11, Appendix A, shows the active pressure distribution for a shoring wall supporting a horizontal surface. Surcharge effects for uniform surcharge loads may be computed using the pressure distribution provided in Figure A-12, Appendix A. It is recommended that a uniform surcharge pressure be included in the design where the localized effect of heavy equipment such as cranes or concrete trucks are anticipated within approximately fifteen (15) feet of the top of the shoring.
Lateral resistance for soldier piles may be assumed to be provided by passive pressure below the bottom of excavation. Allowable passive pressure equivalent to a fluid pressure of 300 pet may be used for soldier piles embedded in the dense to very dense sandy soils or very stiff clays. The allowable passive resistance is for soldier piles spaced not less than three (3) diameters center-to-center and includes the doubling effect for isolated piles.
Tie-backs may be designed for an allowable unit skin friction of 300 psf. A bond length sufficient to support the anticipated earth and surcharge loads should be installed behind a line rising at fifty-five (55) degrees from the horizontal starting at the base of the wall, as shown on Figure A-11. The anchors may be installed 1t angles between fifteen (15) degrees to forty-five (45) degrees below the horizontal. If caving occurs in the drilled shafts, casing should be used prior to concrete pour, but casing must be pulled as the shaft is poured. Structural concrete should be placed in the lower portion of the drilled shaft up to the assumed failure plane. Pouring of the anchors should be done by pumping the concrete through a tremie or pipe extending to the bottom to the shaft. The anchor shaft between the failure plane and the face of the shoring may be backfilled with sand after concrete placement. All of the anchors should be pre-tested for a minimum of fifteen (15) minutes and to at least 150 percent of the design load.
To limit local sloughing, we recommend that exposed soils between the'soldier piles be supported by timber lagging. All lumber to be left in the ground should be pressure-treated in accordance with the specifications of the American Wood Preservers Association (AWPA).
Adequate bearing capacity should be provided for the soldier piles. The design vertical load will be a function of the anchor loads and their inclination. These piles may be designed for vertical loads using an allowable unit skin friction of 600 psf. The unit skin friction may be applied to one-quarter of the soldier pile surface or one-half of the ·sheet pile surface above the base of the excavation, and to the full pile surface area below the base of excavation.
It is recommended that a licensed surveyor be retained to ·establish monuments on the shoring, the surrounding ground and adjacent structures prior to excavations. Such monuments should be monitored for horizontal and vertical movement during construction. Results of the monitoring program should be provided nmediately to the project structural (shoring) engineer and GEOBASE for review and evaluation.

't P.279.02.00 Page 16 of 20 January 5, 1998
.t is recommended that the plans and specifications for the proposed shoring system be reviewed by GEOBASE. The installation and monitoring of shoring should also be observed.
7.8 Trench Backfill
It is our opinion that utility trench backfill could be placed and compacted by mechanical means. Basement wall backfill is discussed in subsection 8.3.2.
If utility contractors indicate that it is undesirable to use compaction equipment in close proximity to a buried conduit, other methods of utility trench compaction may also be appropriate as approved by GEOBASE at the time of construction. Jetting or flooding of backfill material is not recommended.
VIII. PRELIMINARY FOUNDATION RECOMMENDATIONS
8.1 General
The following recommendations are provided for preliminary design and planing purposes, and are not intended for use for final design or construction. Detailed investigations with additional borings Within each of the proposed building areas will be required to establish soils parameters for final design. All proposed structures should be designed for the seismic factors discussed in Section V. Foundations and slabs reinforcement configurations should meet, as a minimum, the requirements of the governing agencies and .. 1e Uniform Building Code for low expansive soils. In this respect, additional expansion index tests should be performed on representative samples obtained from the detailed investigations.
8.2 Foundations
The following recommendations have been formulated from visual, physical and analytical considerations of existing site conditions and are believed to be applicable for the proposed development.
Spread or continuous footings may be used for support of the proposed subterranean parking structure. Footings should be based a minimum of three (3) feet, below lowest adjoining grade. Surface structures may also be supported on footings based eighteen (18) inches below lowest adjoining grade. Fill below footing bases should be compacted to ninety-five (95) percent re.lative compaction based on ASTM D 1557. In this respect, fills are not anticipated beneath the underground parking.
For the underground parking and shallow footings, allowable dead-plus-live load bearing pressures in the order of 4,000 psf and 1,500 psf, respectively, may be used, plus a one-third (1/3) increase for short-term wind or seismic loads; however, these parameters should be confirmed based on more detailed investigations.
· Lateral loads against structures may be resisted by friction between the bottom of foundations and the tpporting soils. An allowable friction coefficient of 0.3 is recommended. alternatively, an allowable lateral
uearing pressure equal to an equivalent fluid weight of 300 pounds per cubic foot acting against the
GEOBASE_ INC
• P.279.02.00 Page 17 of 20 January 5, 1998
;oundations may be used, provided the foundations are poured tight against undisturbed or compacted soil. The aforementioned equivalent fluid weight should be reduced by one-third (1/3) if lateral bearing and friction are combined.
8.3 Retaining/Basement Walls
8.3.1 Earth Pressures
All parameters outlined in the following should be confirmed based on detailed investigations.
Walls which are fixed at the top should be designed to resist lateral earth pressures imposed by the .surrounding soils and surcharge loads such as soil cover and traffic loads. For static loading conditions, a lateral pressure equivalent to that imposed by a fluid weighing sixty (60) pcf may be used. In addition, a uniform surcharge pressure of one-half (1/2) any vertical pressure adjacent to the structure should be assumed to act on the walls. These aforementioned pressures assume positive drainage such as placement of a backdrain and crushed rock at the lower third of the wall height. Alternatively, hydrostatic pressures should be added.
For static loading conditions, walls which are free to rotate at the top may be designed to resist a lateral pressure imposed by an equivalent fluid weighing thirty-five (35) pcf. In addition, a uniform pressure on onethird (1/3) of any vertical pressure adjacent to the structure should be assumed to act on the walls. Drainage ,·ecommendations outlined in subsection 8.3.2 should be used.
Wall pressures resulting from earthquakes may be taken as twenty-one (21) percent of static loading conditions, including surcharge. It is emphasized that for triangular pressure distribution the triangular pressure resulting from earthquake loading should be inverted when computing loads on the wall.
8.3.2 Wall Backfill
Placement of wall backfill should conform to the reco-mmendations presented in subsection 7.4. The wall backfill should be well-drained to relieve possible hydrostatic pressures on the wall. Prior to backfill placement, a backdrain consisting of a four (4) inch diameter perforated PVC Schedule 40 pipe should be installed. This drainage pipe may discharge by gravity. Wall backfill may then be placed. At least the lower third (1/3) of wall should consist of crushed rock.
A filter fabric such as "Mirafi 140N", "Supac 4N" or approved equivalent should be placed at the interface between the backfill and finer grained soils. The wall backfill should be sealed at the surface from water infiltration with at least one (1) foot of relatively impermeable soils. A typical wall backfill detail is provided as Figure A-13, Appendix A.
Alternatively to the above, hydrostatic pressures may be incorporated into the wall design.
The basement wall should be waterproofed to prevent moisture build-up on the interior sides of the walls as
GFORASI= INr

\
P.279.02.00 Page 18 of 20 January 5, 1998
..i result of water mitigation from the soils in contact with the walls. The waterproofing should be applied for the full height of the basement walls.
8.4 Floor Slabs
Slabs-on-grade may be used for supporting floor loads at the site. The subgrade should be prepared in accordance with the recommendations provided in subsection 7.5.
Based on the results from the present investigation, the subgrade soils have a low expansion potential. In areas with low expansive soils, no special measures, other than maintaining uniform moisture conditions in the subgrade are required for favorable performance.
Additional expansion index tests should be carried out on representative samples obtained from the detailed investigations. Appropriate recommendations for preparing the slab subgrade and for the design of the floor slabs should be based on the results of the additional tests.
The slab should be underlain by minimum of four (4) to six (6). inches of sand. In moisture sensitive areas, a ten (1 0) mil polyethylene moisture barrier should be placed beneath the slab, with a minimum of two (2) inches of sand between the slab and the moisture membrane. A subgrade modulus of 100 pounds per square inch per inch may be used for slab design. The slab should be reinforced to meet the requirements 1f the regulating agencies as well as those of UBC for low expansive soils, as appropriate. In addition, .:>tructural loading, shrinkage and temperature stresses should be considered.
The recommendations presented above are intended to reduce the potential for cracking of slabs and foundations; however, even with the incorporation of the recommendations presented herein, foundations and slabs-on-grade may still exhibit some cracking. The occurrence of concrete shrinkage cracks are independent of the supporting soil characteristics.
8.5 Pavement Areas
The upper four (4) feet of subsoils at the site are predominately granular, with A-values of forty-six (46) and seventy-two (72). Based on the anticipated light traffic conditions (surface parking), a minimum pavement section consisting of three (3) inches of asphaltic concrete and four (4) inches of aggregate base materials may be considered. This should be confirmed with A-value testing of the subsoils.
IX. SOIL CORROSIVITY -- IMPLICATIONS
Electrical resistivities measured on two (2) soil samples from the site indicated a "moderate" potential for attack on steel.
Water-soluble sulfates determination conducted for this site indicated a "low" potential for attack on concrete. herefore, Type I Portland cement may be used for the construction of concrete structures in contact with
the subgrade soils.
GFORASI= INr

• P.279.02.00 Page 19 of 20 January 5, 1998
A.. RECOMMENDATION FOR ADDITIONAL WORK
The preliminary recommendations presented in the previous sections were intended for use for preliminary design and planning of the Watts Towers Cultural Crescent and not intended for final design or construction pyrposes. Detailed investigations should be carried out after the proposed structure locations have been finalized. This work may include:
Additional, closer spaced borings within the proposed building footprints.
Additional Expansion Index Tests and A-Value tests should be carried out within pre-determined building and pavement areas, respectively.
XI. LIMITATIONS
The preliminary geotechnical evaluation presented herein was performed in accordance with generally accepted geotechnical engineering principles and practice. No other warranty, expressed or implied, is made
. as to the conclusions and professional advice included in this report.
This report is intended for use with regard to the specific project discussed herein. The conclusions and recommendations contained in this report are based on the data relating only to the project and location discussed herein.
The analyses and recommendations submitted in this report are based upon the observations noted during drilling of the borings shown on the site plans, interpretation of laboratory test results and geological evidence. This report does not reflect any variations which may occur between the borings.
Respectfully submitted GEOBASE, INC.
c. C.M. Payne R.G. 933; C.E.G. 367 Associate Geologist

• P.279.02.00 Page 20 of 20 January 5, 1998
REFERENCES
1. "Soils Investigation -- Watts Tower Cultural Crescent", a report prepared by SCS Engineers for the Community Redevelopment Agency of the City of Los Angeles, dated October 29, 1997
2. Blake, T. F., 1989, "FRISK", a computer program for the Probabilistic Estimation of Seismic Hazard, using faults as earthquake source.
3. Bryant, W .A., 1988, "Recently Active Traces of the Newport-Inglewood Fault Zone, Los Angeles and Orange Counties, California", Division of Mines and Geology, OFR 88-14. ·
4. Campbell, K.W., "Empirical Prediction of Near-Source Ground Motion From Large Earthquakes", Proceedings, International Workshop on Earthquake Hazard and Large Dams in the Himalaya, sponsored by the Indian National Trust for Art and Cultural Heritage (INTACH), New Delhi, India, January 15 and 16, 1993. ·
5. Department of Water Resources, 1961, "Planned Utilization of the Groundwater Basins of the Coastal Plains of Los Angeles County", CDWR, Bulletin 104, Appendix A.
6. Hall, W.J., Mohraz, B. and Newmark, N.M., January 1976, "Statistical Studies of Horizontal and Vertical Earthquake Spectra", a report prepared for U.S. Nuclear Regulatory Commission, Report NUREG-003.
7. Los Angeles County Flood Control District, 1982, "Hydrologic Report", 1975-77:LACFCD.
8. Newmark, N.M. and Hall, W.J., 1982, "Earthquake Spectra and Design", Earthquake Engineering Research Institute, Berkeley, California.
9. Seed, H.B. and ldriss, I.M., 1982, "Ground Motions and Soil Liquefaction During Earthquakes", Monograph, Earthquake Engineering Research Institute, Berkeley, California.
10. Tinsley, J.C., et al., 1965, "Evaluating Liquefaction Potential", U.S. Geological Survey, Professional Paper, 1360.
11. USGS 7.5 minute series South Gate (1964, photo revised 1981 ), California topographic quadrangle.
12. Yerkes, R.F., et al., 1965, "Geology of the Los Angeles Basin, California", U.S. Geological Survey, Professional Paper, 420-A.
13. Ziony, J.l., Jones, L.M., 1989, "Map Showing Late Quaternary Faults and 1978-84 Seismicity of the Los Angeles Region, California", U.S. Geological Survey Map MF 1964.

As the client of a consulting geotechnical engineer, you should know that site subsurface conditions cause more construction problems than any other factor. ASFE!rhe Association of Engineering Firms Practicing in the Geosciences offers the following suggestions and observations to help you manage your risks.
A GEOTECHNICAL ENGINEERING REPORT IS BASED ON A UNIQUE SET OF PROJECT~SPECIFIC FACTORS ,Your geotechnical engineering report is based on a subsurface exploration plan designed to consider a unique set of project-specific factors. These factors typically include: the general nature of the structure involved, its size, and configuration; the location of the structure on the site; other improvements, such as access roads, parking lots. and underground utilities; and the additional risk created by scope-of-service limitations imposed by the client. To help avoid costly problems. ask your geotechnical engineer to evaluate how factors that change subsequent to the date of the report may affect the report's recommendations.
Unless your geotechnical engineer indicates otherwise. do not use your geotechnical engineering report:
• when the nature of the proposed structure is changed, for example. if an office building will be erected instead of a parking garage, or a refrigerated warehouse will be built instead of an unrefrigerated one;
• when the size. elevation. or configuration of the proposed structure is altered;
• when the location or orientation of the proposed structure is modified;
• when there is a change of ownership; or • for application to an adjacent site.
Geotechnical engineers cannot accept responsibility for problems that may occur if they are not consulted after factors considered in their report's development have changed.
SUBSURFACE CONDITIONS CAN CHANGE A geotechnical engineering report is based on conditions that existed at the time of subsurface exploration. Do not base construction decisions on a geotechnical engineering report whose adequacy may have been affected by time. Speak with your geotechnical consultant to learn if additional tests are advisable before construction starts. Note. too. that additional tests may be required when subsurface conditions are affected by construction operations at or adjacent to the site. or by natural events such as floods. earthquakes, or ground water fluctuations. Keep your geotechnical consultant apprised of any such events.
MOST GEOTECHNICAL FINDINGS ARE PROFESSIONAL JUDGMENTS Site exploration identifies actual subsurface conditions only at those points where samples are taken. The data were extrapolated by your geotechnical engineer who then applied judgment to render an opinion about overall subsurface conditions. The actual interface between materials may be far more gradual or abrupt than your report indicates. Actual conditions in areas not sampled may differ from those predicted in your report. While nothing can be done to prevent such situations, you and your geotechnical engineer can work together to help minimize their impact. Retaining your geotechnical engineer to observe construction can be particularly beneficial in this respect.
A REPORT'S RECOMMENDATIONS CAN ONLY BE PREUMINARY The construction recommendations included in your geotechnical engineer's report are preliminary, because they must be based on the assumption that conditions revealed through selective exploratory sampling are indicative of actual conditions throughout a site. Because actual subsurface conditions can be discerned only during earthwork. you should retain your geotechnical engineer to observe actual conditions and to finalize recommendations. Only the geotechnical engineer who prepared the report is fully familiar with the background information needed to determine whether or not the report's recommendations are valid and whether or not the contractor is abiding by applicable recommendations. The geotechnical engineer who developed your report cannot assume responsibility or liability for the adequacy of the report's recommendations if another party is retained to observe construction.
GEOTECHNICAL SERVICES ARE PERFORMED FOR SPECIFIC PURPOSES AND PERSONS Consulting geotechnical engineers prepare reports to meet the specific needs of specific individuals. A report prepared for a civil engineer may not be adequate for a construction contractor or even another civil engineer. Unless indicated otherwise. your geotechnical engineer prepared your report expressly for you and expressly for purposes you indicated. No one other than you should apply this report for its intended purpose without first conferring with the geotechnical engineer. No party should apply this report for any purpose other than that originally contemplated without first conferring with the geotechnical engineer.
GEOENVIRONMENTAL CONCERNS ARE NOT AT ISSUE Your geotechnical engineering report is not likely to relate any findings, conclusions. or recommendations

..
Figure A-1
Figure A-2
Figure A-3
Figure A-4 Figure A-5
Figure A-6
Figure A-7
Figure A-8
Figure A-9
Figure A-10
Figure A-11
Figure A-12
APPENDIX A
Location Map
Boring and Test Pit Locations Plan
California Fault Map
Historic Earthquakes -- 1800 to 1997
Seismic Recurrence Curve
Seismic Risk Analysis Results -- Probability of Exceedance
Seismic Risk Analysis Results -- Average Return Period
Horizontal Design Response Spectra -- Acceleration 0.32g
Horizontal Design Response Spectra -- Acceleration 0.21 g
Earth Pressures and Tieback Geometry for Shoring
Additional Lateral Earth Pressures on Shoring
Typical Wall Backfill Detail
GEOBASE_ INC_

NOTE : Base Map from USGS 7.5 minute series South Gate (1964, Photo Revised 1981), California Topographic Quadrangle.
GEOBASE P.279.02.00
NORTH
0 1/2
SCALE IN MILES
LOCATION MAP Watts Towers Cultural Crescent
Los Angeles, California
re A-1
II IH!!~ ~~ IIIII ~~
~
~ \ I i1 \t I I \
llrff~ > \
r'~~~ ::a \
~~ «::-.. ~ ~
" f ~ ---------~ ~
~ rz
~
~
!lfi I !'i I • I
................... ---'~---.
Iff~ l!li I ~ l
lj ffii
~
up g H ~ >! ph ~
iil
li !I ~
GEOBASE
0 ill ~ 0
~ r-~ ffi ~
~ <:::
EXPLANA110N:
~B-J APPROXIMATEBORINGLOCATIONS
TP-3 APPROXIMATE TEST PIT LOCAl"ICNS t!QI§: li!l
1. This drawing has boon reproduced from ~ Des.Jgn Development Plan prepared by Takata Assoclaloa.
2. GEOBASE, INC. hu added only geotecMM:.tiC data to thb plan prepared by others. We have not checked any other Information on this plan, and give no llS$Urance of Its accuracy.
3. This drawing is part of GEOBASE, lNC.'s report P.279.02.00 dated January 1998, and should bo reed with lhe compklle repor1 for evaluation.
BORING AND TEST PIT lOCATIONS PlAN Wa"s Towers Cultural Crescent
Los Angeles, California
P.279.02.00 Figure A-2

I
SAN FRANCISCO
SITE .LOCATION ( + ):
Latitude - 33.9400 N Longitude -, 118.2420 W CRA WA TIS TOWER
0 50
SCALE
(Miles)
100
CALIFORNIA FAULT
GEOBASE P.279.02.00
CALIFORNIA FAULT MAP Watts Towers Cultural Crescent
Los Angeles, California
Fi ure A-3

'\ \ 4 ~\ \CALIFORNIA.
<:::.
PACIFIC
OCEAN
GEOBASE
I
NEVADA \ - ;(
0 50
SCALE (Miles)
100
EXPLANATION
~ M = 8.0 +
C) M = 7.0-7.9
C) M = 6.0-6.9
~ M = 5.0-5.9
X M = 4.0-4.9
SITE LOCATION ( + ):
Latitude - 33.9400 N (\ 1 Longitude - 118.2420 W
HISTORIC EARTHQUAKES--1800 TO 1997
P.279.02.00
Watts Towers Cultural Crescent Los Angeles, California
Figure A-4

ip· ------------------------------------------------------------------------~
LL 0
0::: w CD z :::::> z w >
~ :::::> z :::::> u
100 ~ I
~ III-
I-
1 0 I= ~ III-
I-
LOG N = 3.594 - 0.807M
I I I
0.01 I= ~ ~ ----
I :
: ----
: : ----
:::: : --"'-
-
= : ----
0.001 cl=~-----r-------r------~------~------4-----~=
~ : 1- -1- -r -
1- -
I
9.0 0.00013.0 I I I I I
7.0 8.0 4.0 5.0 6.0
MAGNITUDE (M)
SEISMIC RECURRENCE CURVE HISTORICAL EARTHQUAKES FROM 1800 TO 1997
GEOBASE SEISMIC RECURRENCE CURVE
Watts Towers Cultural Crescent Los Angeles, California
P.279.02.00 Figure A-5

PROBABILITY
100
90 .---.... ~
"---"
w 80 u z
70 <( 0 w w 60 u X w LL
50
0
~ 40
_] -ill 30 <( ill 0 20 0::: [)_
10
8.o
EXPOSURE PERIODS: • 25 years A 75 years • 50 years +1 00 years
GEOBASE
OF EXCEEDANCE vs. ACCELERATION
0.1 0.2 0.3 0.4
ACCELERATION (g)
P.279.02.00
CAMPBELL ( 1993) HORZ. MEAN
SEISMIC RISK ANALYSIS RESULTS -PROBABILL TV OF EXCEEDANCE-
watts Towers Cultural Crescent Los Angeles, California
Figure A-6

AVERAGE RETURN PERIOD vs. ACCELERATION
100000 8 . 6
... --.....
(/) I L. 2 0 I Q)
2) 10000 8
6
0 / 0 ...
/ 0::: ,7 w 2
()_ / 1000 z 8
0::: 6
~ ... /
f-w / 0:::: 2
~ w 100 () <(
8
0:::: 6
w ... /
~ /
2 /
/
108 /
6 .v 0.0 0.1 0.2 0.3 0.4
ACCELERATION (g)
SEISMIC RISK ANAlYSIS RESUlTS
GEOBASE -AVERAGE RETURN PERIOD-Watts Towers Cultural Crescent
Los Angeles, California P.279.02.00 Figure A-7

,......... (.) Q) en
.......... +J '+-..._.,
~ u 0 _j w > w > ~ w 0:::
0 0 :::> w U1 a_
10
0.1
0.01 0.01 0.1 1 1 0
UNDAMPED NATURAL PERIOD {sec)
METHOD: NEWMARK & HALL (1982) - MEDIAN DAMPING: 0.5 2.0 5.0 10.0 6.0 0.0 PEAK ACCELERATION: 0.3200
GEOBASE HORIZONTAL DESIGN RESPONSE SPECTRA
-ACCELERATION 0.32g-Watts Towers Cultural Crescent
Los Angeles, California P.279.02.00 Fi ure A-8

,.._.. u (1.) CJ)
............ ......... '+-'-"'
~ 0 0 _J w > w > ~ w 0::::
0 0 :J w (f) 0..
10
0.1
0.01 0.01 0.1 1 10
UNDAMPED NATURAL PERIOD (sec)
MEfHOD: NEWMARK & HALL (1982) - MEDIAN DAMPING: 0.5 2.0 5.0 1 0.0 0.0 0.0 PEAK ACCELERATION: 0.2100
GEOBASE HORIZONTAL DESIGN RESPONSE SPECTRA
-ACCELERATION 0.21 g-Watts Towers Cultural Crescent
Los Angeles, California P.279.02.00 Fi ure A-9

0.15 H Hin.
H
AHCHOR PORTION OF TIEBACX: BEHIND THIS PLAHE FOR STABILITY
P = 35 psf/ft
f3 = 55°
TIEBACK SHORING
. CANTILEVERED SHORING
P = 25H Pin psf H in feet
GEOBASE· EARTH PRESSURES AND TIEBACK GEOMETRY
FOR SHORING
P.279.02.00
Watts Towers Cultural Crescent Los Angeles, California
Fi ure A-10

H (ft)
f EDGE OF EXCAVATION
,... d(ft) .. 1
I I I I
If d~0.15 H P=50H1 [1-1.57 d/H] If 0.15 H<d~H P=45H1[1-d/H] If d>H P=O
(a) SLOPED EXCAVATION SURCHARGE
H
, ..
Case I -Strip Load
P= ~ { fJ -sin~ cos 2ct )
H (ft)
(ps
qe {lb/ft)Case II
Case II-Line Load for m<0.4
P= 0.2qe -~"--=-H (0.16+n2)2
for m>0.4
P= 1.28qe m2n H (m2+n2)2
Note: Construction surcharge is assumed to be line load or strip load
(b) CONSTRUCTION AND TRAFFIC SURCHARGE
62.4 Hw ~I
(c) HYDROSTATIC PRESSURE
GEOBASE ADDITIONAL LATERAL EARTH PRESSURES
ON SHORING Watts Towers Cultural Crescent
Los Angeles, California P.279.02.00 Fi ure A-11

FINISHED GRADE
PVC PIPE SCHEDULE 40
GEOBASE
-------- T£RRACE DRAIN REQUIRED BEHIND IMll FOR SlOPING BACKFill
H
BACKFill WRAPPED IN FillER FABRIC IIILESS T£51£0 FOR PARTICLE SIZE DISTRIBUTHW
TYPICAL WALL BACKFILL DETAIL Watts Towers Cultural Crescent
Los Angeles, California
P.279.02.00 Fi ure A-12

APPENDIX B
Figure B-1 Explanation of Terms and Symbols Used Figure B-2 Log of Boring B-1
Figure B-3 Log of Boring B-2
Figure B-4 Log of Boring B-3
Figure B-5 Log of Boring B-4
Figure B-6 Log of Boring B-5
Figure B-7 Log of Boring B-6
Figure B-8 Log of Boring B-7
Figure B-9 Log of Boring B-8
Figure B-1 0 Log of Boring B-9
Figure B-11 Log of Boring B-1 0
Figure B-12 Log of Boring B-11
Figure B-13 Log of Boring TP-1
Figure B-14 Log of Boring TP-2
Figure B-15 Log of Boring TP-3
Figure B-16 Log of Boring TP-4
Figure B-17 Log. of Boring TP-5
Figure B-18 Log of Boring TP-6

The terms and symbols used on the Log of Borings to summarize the results of the field investigation and subsequent laboratory testing are described in the following:
It should be noted that materials, boundaries, and conditions have been established only at . the boring locations, and are not necessarily representative of subsurface conditions elsewhere across the site.
A. PARTIClE SIZE DEFINITION !ASTM 02487 and D422)
Boulder •• larger than 12-inches Sand, medium - No. 40 to No. 10 sieves Cobble - 3-inches to 12-inches Sand, fine - No. 200 to No. 40 sieves Gravel, coarse · - 3/4-inch to 3-inches Silt - 51J. m to No. 200 sieves Gravel, fine - No. 4 sieve to 3/4-inch Clay - smaller than 51J. m Sand, coarse - No. 10 to No. 4 sieve
B. SOIL CLASSIFICATION
Soils and bedrock are classified and described according to their engineering properties and behavioral characteristics. The soil of each stratum is described using ASTM D2487 and D2488.
The following adjectives may be employed to define percentage ranges by weight of minor components:
trace - 1-10% little - 10-20% some - 20-35% "and" or "y" - 35-50%
The following descriptive terms may be used for stratified soils: parting -- 0 to 1/16-in. thickness; seam -- 1/16 to 1/2-in. thickness; layer -- 1/2-in. to 12-in. thickness; stratum -- greater than 12-in. thickness.
C. SOIL DENSITY AND CONSISTENCY
The density of coarse grained soils and the consistency of fine grained soils are described on the basis of the Standard Penetration Test:
COARSE GRAINED SOILS
SPT Blows
Density oer foot
very loose less than 4 loose 4 to 10
medium 10 to 30 dense- 30 to 50
very dense over 50
GEOBASE, INC. 024i3·2.0RW
FINE GRAINED SOILS
SPT Estimated Range of Estimated Blows Unconfin~ ~Qmgressive
Consistency oer foot ~~rength U~fl
very soft less than 2 less than 0.25 soft 2 to 4 0.25 to 0.50
firm (medium) 4 to 8 0.50 to 1.0 stiff
very stiff hard
Page 1 of 3
8 to 15 1.0 to 2.0 15 to 30 2.0 to 4.0 over 30 over 4.0
EXPLANATION OF TERMS AND SYMBOLS
Figure 81

0: STANDARD PENETRATION TEST (SPTl ·- D1 586
The SPT test involves failure of the soil around the tip of a split spoon sampler for a condition of constant energy transmittal. The split spoon, 2-inches outside diameter and 1 3/8-inches inside diameter, is driven eighteen (18) inches. The sampler is seated in the first six (6) inches and the number of blows required to drive the sampler the last foot is recorded as the •N• value or SPT blow count. The driving energy is provided by a 140 pound weight dropping thirty (30) inches.
E. SAMPLE TYPE
• Thinwafled tube
OJ SPT split spoon
~ California ~ Disturbed .. fSl No recovery m Core .modified sampler
F. ABBREVIATION OF LABORATORY TEST DESIGNATIONS
c CBR Ch OS El ER k MD 0 pH
Consolidation California Bearing Ratio Water Soluble Chlorides Direct Shear Expansion Index Electrical Resistivity Permeability Moisture/Density Relationship Organic Content pH
G. STRATIFICATION LINES
pp
PS RV SE SG 504 TX TV u
Pocket Penetrometer Particle Size A-Value Sand Equivalent Specific Gravity Water Soluble Sulfates Triaxial Compression Torvane Shear Unconfined Compression
The stratification lines indicated on the boring logs and profiles represent the approximate boundary between material types and the transitio·n may be gradual.
GEOBASE, INC. 02-4Q3~.0RW Page 2 of 3
EXPLANATION OF TERMS AND SYMBOLS
Figure Ei 1

SOIL CLASSIFICATION SYSTEM (ASTM 02487)
MAJOR DMSION GROUP ! C~~::::: SYMBOL SYMBOL
HIGHLY ORGANIC SOILS
SILTS
Below • A • line on plasticity chart: ~ligible organic content
PI
The soil of each stratum is described using ASTM 02437 and 02 438 modified &lightly &a that an inorganic clay ot "medium plasticly" is recognized.
APPmONAl, SOIL CV.SSIFICATION
m FlliSoil
~ S. Sancbtcine
~ Ca Claystone
~ Ma Silstone
GEOBASE, INC.
TYPICAL DESCRJPTlON
Peat and other highly organic soia
lnorgllllia Silla and WtttY line Sanda, Rock Flour, Silty Sanda of alight plaatic:ity
LABORATORY CLASSIFJCATtON
CJ'irfERIA
AltMt!Mg llmita ~ •A• tine 0( lp>7
W 6>50
lnorgllllia Claya ol m.dlum pkasticily, Slly(;IQys
W l""30,c50 See chart below
WL""50
Organic Claya ol high pla&licity w6 .. so
30
20
10 7 .. 0
0
PLASTICITY CHART
/
i ~ } .>vr~ ! j a l
1 1 I ·~ i ' CL.) A ~ ! !
~ . ! ;
; ! v MI. ; i. ~ -MWWY
1 or ; I ~
l ....... 01. ~ 10 20 30 40 so 60 70 80 90
UQUIDUMIT w L
EXPLANATION OF TERMS AND SYMBOLS ~
Agure 81
02493-li.ORW Page 3 ot3

LOG OF BORING
S M E • THIN WALLED [0 SPT f'V'I CALIFORNIA A PL TYPE: TUBE SPLIT SPOON IC::J MODIFIED SAMPLER §DISTURBED fSj NO RECOVERY Em CORE
:r: t w Cl
-5
!-10
15
r-20
r-25
-30
Cl 0 ,_J
u :r: Q.. <X: rr:: Cl
SOIL DESCRIPTION
SAND (FILL) light brown, fine grained, silty, trace gravel, moist.
SAND light brown, fine grained, trace silt, moist. ·
SILT light brown, sandy, moist.
... very stiff.
z 0
~ u u: Ui (/)
<X: ,_J
u ,_J
0 (/)
SM
SP
ML
w ,_J a.. ~ <X: (/)
DRY DENSITY (PCF)
t6 ~ 1to 1to 1!o
Water Content (%): e Plastic liquid Limit !Wpl 1--1 Limit (WL)
Penetration, blows/foot: • 10 20 30 40 50
l6 ........... , .......... [ .......... -~ ...... ] .......... '\' ......... .
! ! I I i 1 \ •• \ \ \
r-'-1--------------------+--+-...l........j. ···········1 ......... 1 ........ t·········'j'····· .. ···j··· ....... . • End of boringat 11 .. 5 feet. . .......... , ........... ~··········:· ... · .. ···~···········:···········
• Boring dry at completion of drilling. . ......... L ........ L ......... [ .......... L. ........ L. ....... .
PROJECT
i ~ 1 l . ........... ; ........... ;··········~··········t ......... ; .......... .
........... ; .......... ·r ........... : ........... ; ........... ~ .......... .
:.:.: .. :::·:::::::::::r::::::::r:::::::::::::::::::::r::::::::: ........ ···t···· ...... ·t······· ····:····· ... ···j········· ··~·· ........ .
···········l···········t··········t··········:···········~···········
.. ·········t ........ ···[ ........... ! ........... ~ ......... ''1'"" ..... . ···········r···········=··········r··········~···········!···········
···········~·········· .! ....... ····r····· ·····:···········;· ......... .
Watts Towers Cultural Crescent Los Angeles, California
GEOBASE, INC. DEPTH TO WATER _y_ SURFACE
ELEV. ± feet LOGGED BY WYY
DATE DEPTH TO SLOUGH _'{_ DRILL CME-75 LOGGED 12/12/97
Note: This log of BORING should be evaluated in conjunction with the complete geotechnical report. This log of BORING represents conditions observed at the soecific BORING location and at the date indicated.
REMARKS/ OTHER TESTS
Top of mound
BORING NO. B- 1
PROJECT NO. P.279.02
FIGURE NO. B-2
page 1 of 1

LOG OF BORING
• THIN WALLED rn SPT f'C71 CALIFORNIA
SAMPLE TYPE: TUBE SPLIT SPOON ~MODIFIED SAMPLER §DISTURBED [Sj NO RECOVERY Em CORE
...-Q)
~ I 1-0.. w 0
1-5
1-10
15
1-20
-25
-30
15
z 0 DRY DENSITY (PCF)
CJ' i= 0 ~
u ...J
u u:: :c SOIL DESCRIPTION (/)
0.. (/)
~ ~ ..J
0: u CJ ..J
0 (/)
t6 to 1to 1-t'o 1~0
Water Content (%): •
Plastic Liquid Limit !Wpl l---1 Limit (WLl
Penetration, blows/foot: • 10 20 30 40 50
-···········:······ .. ···:·········-r········t··········j··•"''''''
)< )< SAND (FILL) dark brown, silty, moist. SM )<
)< )<
~~-=--:-:-:=-::-:---:----:-:----:---:-7"""'---:---,--.,-----+---c!==:J I i 1 J , ... ~ SAND light brown, fine grained, iron stained, damp. SP
: : ..
:
·.·4 · ...
... medium dense.
CLAY grayish brown, trace fine grained sand, moist. CL ......... ··: .. .......... ····· .... ~.' ........ ~- ........ ··~··· ····· .. .
SAND light brown, fine grained, very silty, moist.
* End of boring at 11 .5 feet. * Boring dry at completion of drilling.
PROJECT
. . . . . .. . . .. : ..................... -:· .......... ~- .......... :· ......... . . .
SM ~.~ •: ... ··~······. • ...•.•.. ·=· •••.•..•• ·:··· ••..•••.
......... , ........... :·········••\···········y··········
. ......... -~ ........... ; .......... -~ .......... ~- ....... ; .. ~- ......... .
........... ; ........... , ........... ; .......... r··········:···········
........... ! ........... ~- .......... ·i· .......... ~ ........... ~ .......... .
. . . . . . . . . . . , ...........•..................... ~- .......... , .......... .
. . . . .. . . . . -~ .......... ·:......... . ........ ~- .......... ~- ......... .
···········f···········;··········~~----··••i··········-~·-·········
..... ·:· ......... + ........... ~- .......... ~ ......... ..
·····~········0··········i··········~"·······~··········
·······----~·········;~---~······+··········~···········~---········
... -~ .......... -1- .......... j ........... ~- .......... ~- ......... .
... . ...
.... ........ :
..... -~ ........... ;- ......... -: .... -..... I-- ....... --~- ...... --.-
···········~·-······---; .......... ~··········i··········-~·-········· . .
···········t·········--; .......... ~·-·····--·i·---·-----·~---·--·····
···········'···········;··········t··········r··········~···········
Watts Towers Cultural Crescent Los Angeles,·California
GEOBASE, INC. DEPTH TO WATER .Y. SURFACE - ELEV. ± feet LOGGED BY WYY
DATE DEPTH TO SLOUGH J DRILL CME-75 LOGGED 12/12/97
Note: This log of BORING should be evaluated in conjunction with the complete geotechnical report. This log of BORING represents conditions observed at the specific BORING location and at the date indicated.
REMARKS/ OTHER TESTS
2 inches grass and top soil
Bulk sample 0.5 - 5 feet
BORING NO. 8- 2
PROJECT NO. P.279.02
FIGURE NO. B-3
page 1 of 1

LOG OF BORING
• THIN WALLED OJ SPT 1V1 CALIFORNIA
SAMPLE TYPE: TUBE SPLIT SPOON~ MODIFIED SAMPLER §DISTURBED (SJ NO RECOVERY ~ CORE
Q)
~ :r: f-c... UJ 0
-5
1-10
15
--:20
f-25
-30
,5
Cl 0 ...J
u 5: SOIL DESCRIPTION c... <{ a: Cl
z 0
~ u u:: iii (/) <{ ...J u ...J
0 (/)
UJ ...J c... ~ <{ (/)
DRY DENSITY (PCF)
16 Jb 1to 1to 1~0
Water Content (%): •
Plastic Liquid Limit (Wp) 1------4 Limit (WLJ
Penetration, blows/foot: • 10 20 30 40 50
X>< SAND (FILL) brown, fine grained, silty, trace gravel, SM -
i>c~~.~~'t-;"A7:.,.,~c;:::;,...,l"""ig'h...,.t'b-r-ow_n_, ""fi_n_e_g-ra""7in_e_d.,-,....,t-ra_c_e_s...,il.,...t,-d.,-a_m_p-to--+-:S"'Po-f~=· =l l j j [ l ... medium dense.
LLJ!iEi ........... , .......... ; .......... t·········l"··········;···········
>< : :e...: : : rv:r/7 ,+"--C::::-L:-A:-cY:-:-g-ra-y-:i,-.,sh:-:-b-ro-w-n-,-t-ra-c_e_f::-in_e_s_a_n_d-:-, -m-o-:i-~t-. -----1--:C=-:----ll ........... \ ........... ! ......... -r······· .. L. ........ ).. ........ .
: ~:~in°; ~~;i:~ ca:~;~~~i!~e~f drilling. ·········-r········-r·········~·········-r········r·····:··· ···········l···········r·········r··········r··········r··········
PROJECT
···········r··· .. ·····~···········:··········~········· .. r··········
: : . . : ···········:·· .. ·····. -~·· ....... ··:··. ·······~······· .... :··· ....... .
IIIL ! ........... ; ........... , .......... t··········:···········j···········
:.::::::::::::·:::·:::r:::::::::r:::::::::r::::::::::r::::::::: .......... -~··· ········~ .......... t······ .... ~ ........... ~-· ........ . ........... ~ .......... .L. ....... T····················j···········
., ......... [ ........... : .......... ; ........... ; ........... 1··········· ···········;···········[··········i .......... , ........... ; .......... .
. ... ·······;···· ....... ~ ........ "1"' ........ ~ ........... : .......... .
........... ~···········: .. ········~··········r··········:···········
Watts Towers Cultural Crescent Los Angeles, California
GEOBASE, INC. DEPTH TO WATER ~ SURFACE
ELEV. ± feet LOGGED BY WYY
DATE DEPTH TO SLOUGH 'f DRILL CME-75 LOGGED 12/12/97
Note: This log of BORING should be evaluated in conjunction with the complete geotechnical report. This log of BORING represents conditions observed at the soecific BORING location and at the date indicated.
REMARKS/ OTHER TESTS
Top of mound
Bulk sample 0 - 5 feet
BORING NO. B- 3
PROJECT NO. P.279.02
FIGURE NO. B-4
page 1 of 1

LOG OF BORING S LE • THIN WALLED OJ SPT 1'V'1 CALIFORNIA
AMP TYPE: TUBE • SPLIT SPOON ~MODIFIED SAMPLER §DISTURBED [SJ NO RECOVERY §Ij CORE
:I:
t w 0
1-5
1-10
-15
-20
!-25
1-30
35
(!) 0 ....J
u :I: Q.. <{ a:: (!)·
SOIL DESCRIPTION
z 0 i= <X: u w u:: ....J
Ui Q..
(f) ~ <X: <{ ....J (f)
u ....J
0 (f)
DRY DENSITY (PCF)
t6 to 1to 1to 1~0
Water Content (%): • Plastic Liquid Limit (Wpl 1----f Limit (WLl
Penetration, blows/foot: • 10 20 30 40 50
f-:~~'t-:S;:;-Ac:-.-:N-::::D-.(-,-F71 L-:-L7) _d_ar_k_b_r,_o_w_n-:-, _s_ilt_y-,, -=-tr_a_ce_g--,-ra_v_e,--1, --,m,--o_i_st_. :----1--'-sS_Mp-+---i _______ ---· _________ -:~-- ___ -·- --+---- _____ -i--- ____ .... L .. _ ------
SAND light brown, fine to medium grained, damp to _ , , , ,
m,,... I J I j I SAND brown, fine grained, very silty, moist.
SMIX lrrrl - - -- -············:········· .; .......... .;. .......... : ........... :···········
···········t······· ···~··········7··········~···········~···········
... light brown, silty, medium dense.
·J--------------~---·--------.!----------J ____ , ________________ _ ~~--~---------------------------------+--~-L4 : : -
* End of boring at 11.5 feet. * Boring dry at completion of drilling.
PROJECT
...... ·····~·· ······ .. 'f'''''. ·····j···· .. ·····~· ....... ···1········· .. - -- -
ooo oo oooo 00:0 0 OooOooooo; ooOOOOOo 00 .;. "oo Hoooo~oooo< 0 OOOoo~O<OO o<O 0 oo o
··········-~··········-~·-········+·········-~···········~··········-
----. -:- -. . -.... -.; .. -..... -.. -~ ... -....... i .......... .
···········)····· ··············-~---····---~---·······-~---······-·
........ --: . .... ·-·. -~ -- ......... ·
........ ·--~--- ....... -~- -·- ······-r···· ---. -· ~--·- ....... r··----- .. . - -- -
.... 0 0 0 .. "; 0 " 0 0 .... 0 0 f L 0 0 .. 0 .. 00 .; ......... 0 0 ; ...... 0 0o 0 --~ 0 " .... 0 .. 0
........... ~- ........ -.. ; .......... 'i' .......... ~- .......... ~ .......... .
. . . . . . . . . . -~ '.' ......... ; .......... -~- .......... ~- .......... ~- ......... . - -- -
- -........ ·--~ ........... : .......... .; ........... ; ....... ···-~- ......... .
. ··- ..... --: .......... -: .......... ·:· ....... ---~-- ········-~- ......... . : : - -
.... -..... ·; .......... -~ .......... -~- .......... : .... -..... -~- ......... .
··········-~·-·········;··········+·········-;·-·········~---··--····
.......... -: ....... ' .. ·t .......... -;. ..... -.... ~- .......... ~- ......... .
.. ··- ..... -: ........... ; .......... -;. ········ --~---· .... ·--~- ......... .
··········-~·-········-~·-·······-~·-·······-~---·······-~···········
Watts Towers Cultural Crescent Los Angeles, California
·····t·········-~·-·········f···········
GEOBASE, INC. DEPTH TO WATER ~ SURFACE
ELEV. ± feet LOGGED BY WYY
DATE DEPTH TO SLOUGH 'f DRILL CME-75 LOGGED 12/12/97
Note: This log of BORING should be evaluated in conjunction with the complete geotechnical report. This log
REMARKS/ OTHER TESTS
2 inches grass and top soil
Bulk sample 0.5 - 5 feet
BORING NO. B- 4
PROJECT NO. P.279.02
FIGURE NO. B-5
page 1 of 1 of BORING represents conditions observed at the specific BORING location._,a;:.:.n_,_,d'-'a"-'t'-'t""h"'e-"d!-"a:.o.te"-'-'-in_,_,d::.cic,_,a"-'t-"'-ed:::.·=--------'-----------'

LOG OF BORING
• THIN WALLED OJ SPT 1"V'1 CALIF.ORNii-.
SAMP.LE TYPE: TUBE SPLIT SPOON IC:oJ MODIFIED Si·MPLER §DISTURBED fSj NO RECOVERY !I!j CORE
z 0 i= <{ u w u:: ...J
(j) 0..
(/) ::i:E <{ <{ ...J (/)
u ...J
0 (/)
DRY DENSITY (PCF)
tb !o 1to 1to 1~0
Wilter Content(%): e Plastic Liquid Limit (Wp) 1-'--1 Limit (WL)
Penetration. blows/foot: • 10 20 30 40 50
CJ .., 0 ~
...J
u :r: :r: SOIL DESCRIPTION 1- 0.. 0.. <{ w 0 a:
CJ
~ SAND (FILL) brown, silty, trace gravel, moist. SM
X)<
SAND light brown, fine grained, silty, damp to moist. SM
r-5
l6····························~·-·······························
i IF· -10
P-"--"t-~·-· Em-n-:-:-;:-:-o-~-:"-:-:-:-,-,-_-5-f-ee-t-. ----------+---f-.1--j~ ••..•••• j ••••••. ~... I [ ...•..•••• , •.•...•• ! * Boring dry at completion of drilling.
15
r-20
,_zs
r-30
35
PROJECT
GEOBASE, INC. DEPTH TO WATER
DEPTH TO SLOUGH
..; ........ ~···········~··········t··········j···········1···········
........... ( .. ···· .. t·········)··········j··········-r·········
\ ~ ···········!·'······"·!··········r-·······j····· .. ····:·······"'' .......... -~ .......... ·; .......... ·t .... ·-· ... ~- .......... ~-· ........ .
........... \ ........... \ ........... t .......... l···········j···········
.... ·······~···· ....... ~ ··········+· ......... .; ........... ~- ......... .
. . . . .......... ; ........... ; .......... -~· .......... ; ........... \· ......... .
::::::: .. :r::::::::-;::·:::::.:r:::::::::r:::::.:::r::::::::: ···········'···········~·········r·····) ........... ; .......... .
···········t···········'··········r··········f··········~···········
···········; ........ ···~········· ·+·· ...... ··~····· ...... ~-······ ... . . .
···········;···········:········••j••·········:···········t··········
···········f···········i··········+··········:···········L ......... . : :
···········~···········[··········:··········:···········'···········
···········i···········;··········7··········l···········:···········
···········'···········t··········t··········j···········l'·········· ···········!···········;··········+··········<···········\'··········
Watts Towers Cultural Crescent los Angeles, California
_y_ SURFACE ELEV. ± feet LOGGED BY WYY
l DRILL CME-75 DATE LOGGED 12/12/97
Note: This log of BORING should be evaluated in conjunction with the complete geotechnical report. This log of BORING represents conditions observed at the specific BORING location and at the date indicated.
REMARKS/ OTHER TESTS
2 inches grass and top soil
OS
BORING NO. B- 5
PROJECT NO. P.279.02
FIGURE NO. B-6
page 1 of 1

LOG OF BORING
T • THIN WALLED rn SPT I'J'I CALIFORNIA · SAMPLE YPE: TUBE SPLIT SPOON ~MODIFIED SAMPLER §DISTURBED [SJ NO RECOVERY §Ij CORE
+'
" ~ I I-a. w a
-5
HO
15
f-20
-25
f-30
35
C) 0 ..J
u I SOIL DESCRIPTION a. <{ 0:: C)
z 0
~ u u:: (/) (/) <{ ..J u ..J
0 (/)
w --' a. 2 <{ (/)
DRY DENSITY (PCF)
t6 to 1to 1to 1~0
Water Content(%): •
Plastic Liquid Limit (Wp) 1-------1 Limit (WL)
Penetration, blows/foot: • 10 20 30 40 50
S& : ..
SAND (FILL) brown, silty, trace gravel, moist. SM
f-:Tft--;S~A"N:;;D:;-;-:Ii'gh;-;t'b'r_o_w_n_, -;:fi_n_e -g-ra-,-in-e--,d', -:-tr-a-ce--,-to-l""'it.,.,tl-e-s"'ilt-, --+-S-M-1:-==:::J ··········~···········~···········'···········!···········'···········
: ..
: :
: : :
: :
damp. ········+··········'··········; ........... ; ........... , ......... ..
... medium dense.
* End of boring at 11 .5 feet. * Boring dry at completion of drilling.
PROJECT
....... ···i ······· .. ··~ ........... : ........... !. .......... ~-· ........ .
§···········;· .. ········:··· .. ·····t·· .. ······:--.. ····· .. 1······· .. ··
LL···:········-~'--··········-··-·······- ......................... . ···········:·· ·······=··········T··········r··········r··········
··········:·········--; .......... : .......... :···········:-······· .. . ........... : .. ·······;· .. ·······t··········; ........... ~···········
., ........... .... . , ...........
..... . ..........
T ........
...... ~- .........
......
...
. ..
: ...
..........
...... , .......... . ··········
..j. ··: .........
.......... : ........... ; ........... : ........... ~- ......... .
. . . . . . . . . . -~ ........... :. ........... : ........... ~- .......... ~- ......... .
. . . . ...... -~ .......... -~-- ........ + .......... l. .......... ~-- ........ .
.. . . . . . ... . ~ ........... ~ ........... t ........... ~ ........... L ......... .
........... , ........... ; .......... ,l···"······i·· .. ····"''l· .. .
........... ,........... ,.... . ......... .
·········
...................... , ...
Watts Towers Cultural Crescent Los Angeles, California
..... .. ........ .
.... .. ....... ..
GEOBASE, INC. DEPTH TO WATER :t: ~~:s~CE ± feet LOGGED BY WYY
DATE DEPTH TO SLOUGH l DRILL CME-75 LOGGED 12/12/97
Note: This log of BORING should be evaluated in conjunction with the complete geotechnical report. This log of BORING rE'lJ)resents conditions observed at the specific BORING location and at the date indicated.
REMARKS/ OTHER TESTS
2 inches grass and top soil
Bulk sample 0.5 · 5 feet
c
BORING NO. 8- 6
PROJECT NO. P.279.02
FIGURE NO. B-7
page 1 of 1

.. LOG OF BORING
• THIN WALLED OJ SPT I'V'l. CALIFORNIA
SAMPLE TYPE: TUBE SPLIT SPOON ~MODIFIED SAMPLER B DISTURBED [SJ NO RECOVERY Em CORE
CLAY brown, sandy, moist.
.. . trace fine grained sand, trace fine gravel, very stiff, damp:
SAND brown, fine grained, moist.
z 0
~ u w u::: ...J iii Q..
DRY DENSITY (PCFJ
16 t6 1to 1f'o 1!o
Water Content (%): e (j) ~ <i ~ Plastic Liquid (j Limit (Wpl 1----1 Limit (WLl ...J i5 Penetration, blows/foot: • (j) 1 0 20 30 40 50
~ .............. ~ .. -~ .......... -.......... : ...................... .
:::::::::::::· ·::::::t::::::::::r:::::::::r::::::::::r:::::::::: ···········!· .. ·····i··········t··········~···········1···········
;~ 11 t~·I I I L ••········r••••·•·IT\··•r•······•.L• .. •r•·•·••·••
CL ~ I r~r L r ~ ~ : j ~
···········?··········. ·········t·· .. ····"j'''''''"'':··········· .......... -~·.......... . ......... :· .......... ~- .......... ~- ......... .
1 It<r:· ········•······!········~·········: ...•......
SP ~ ........... , ..................... , ..................... !... ...... .. . ......... -~ .......... -:.. .. . . . . .: ........... ;. . . . . . . . . ,; .......... .
. . . . . . . . . . -~ ........... ;. . . .. . . .. . ·: ........... ~- .......... ; ......... .
........... ~ ........... ; ......... i... ........ ]'"""'"'(''' .... .
REMARKS/ OTHER TESTS
Bulk sample 0.5 - 5 feet RV
ER, pH, Ch, 504
-30 SAND grayish brown, fine grained, silty, interbedded with fine grained sand lenses, very dense, moist.
SM f-L : j 4J: . f> >I~ 50 blows for 6 inches
J5
PROJECT
GEOBASE, INC. DEPTH TO WATER
···········:···········~··········~··········:···········r··········
........... ~ ........... !''''''''·'t··········i···········i·"········ ···········~··········'f''''''''''t··········!···········:···········
.......... T .......... : .......... :-......... , ........... 1" ....... ..
Watts Towers Cultural Crescent Los Angeles, California
:t: ~~ERS.ACE ± feet LOGGED BY WYY
DATE DEPTH TO SLOUGH _l DRILL CME-75 LOGGED 12/12/97
Note: This log of BORING should be evaluated in conjunction with the complete geotechnical report. This log of BORING represents conditions observed at the specific BORING location and at the date indicated.
BORING NO. 8- 7
PROJECT NO. P.279.02
FIGURE NO. B-8
page 1 of 2

LOG OF BORING
• THIN WALLED OJ SPT rv1 CALIFORNIA .
SAMPLE TYPE: TUBE SPLIT SPOON~ MODIFIED SAMPLER B DISTURBED [SJ NO RECOVERY ~ CORE
::r: h: w 0
r-40
-45
f-55
-60
-65
'0
(? 0 _J
u ::r: 0... <l: a: (?
SOIL DESCRIPTION
SAND light brown/gray, fine grained, moist.
... gray, trace to little silt, medium dense.
CLAY/SILT. gray, interbedded with fine grained sand lenses, hard, damp.
* End of boring at 51 .5 feet. * Trace of water at bottom of hole.
z 0 ;:::: <l: u u:: (I) (/)
<l: _J
u _J
0 (/)
w _J
0... ::E <l: (/)
DRY DENSITY (PCF)
to !'o 1to 1'to 1,0
Water Content (%): • Plastic Liquid Limit (Wp) !-----; Limit (WL)
Penetration, blows/foot: • 10 20 30 40 50
SP X.··················· ~ ....... ~ ................................ .. ···········~·····,····~ ········~···········~···········~··"·······
........... , .......... :~::::.:: .. ::::·:::·::::.:-:::~.::::::::::::::::
~~ lJ ........... , .......... , ............ ~l· : :
J ........... , ........... ; ........... l; .. ~t .. ~l CL! Ll ML 1 ....
i""'
.. .. ,.... . ...... , .........
··+··········~······ ····~··········· : :
......... ··~···········r· . ······· ~--···· .....
. ... ··:····· ...... ~- ........ ··>· ....... '.
. ......... -:... . ...... ~ .......... ·j· .......... : .......... -~- ......... .
. . . . . . . . . . ·: .......... ·:· ......... ~-· ......... ~- ......... .
.................. ~ ......... ·:· . . . . . .... ~ ........... ~ .......... .
.. . . . .. . . ··' .................... ·:· .......... : ......... ' ·~·"' ...... .
. . . . .. . . ~ ........... ~ .......... .
. . .. .. . . ··~ .......... : ........... ~ .......... .
......... .. ...... ; .......... .
........ ···:·· .... ..... ~ .......... 7 .......... ~-' ... , .. ···-=· ......... .
. . .. . '.; .......... ~ .......... ~ ........... ~ .......... .
........ . ; .......... ~ .......... ~ ........... : .......... .
.. . . . .. . . . ·~ ......... ··~ ......... ·T .......... ~-· ······ ···1· ......... .
PROJECT Watts Towers Cultural Crescent
Los Angeles, California
GEOBASE, INC. DEPTH TO WATER ,!: SURFACE
ELEV. ± feet LOGGED BY WYY
DEPTH TO SLOUGH l DRILL CME-75 DATE LOGGED 12/12/97
Note: This log of BORING should be evaluated in conjunction with the complete geotechnical report. This log of BORING represents conditions observed at the specific BORING location and at the date indicated.
REMARKS/ OTHER TESTS
BORING NO. B- 7
PROJECT NO. P.279.02
FIGURE NO. B-8
page 2 of 2

LOG OF BORING
• THIN WALLED OJ SPT 1'Z71 CALIFORNIA
SAMPLE TYPE: TUBE SPLIT SPOON ~MODIFIED SAMPLER B DISTURBED ISJ NO RECOVERY §fj CORE
.... Q)
~ I 1-0... w 0
(!) 0 ...J
(.)
:C SOIL DESCRIPTION 0... <( 0:: (!)
-)< SAND (FILL) brown, silty, trace gravel, moist.
9< · .. ·. SAND light brown, fine grained, trace silt, damp to
moist.
... interbedded with dark brown clay lenses, medium dense.
z 0
~ (.)
u::: iii !/) <( ...J (.)
...J
0 !/)
SM
SP
w ...J 0... ::i! <( !/)
DRY DENSITY {PCF)
to fo 1to 1t'o 1~0
Water Content (%): •
Plastic Liquid Limit (Wp) t--:---1 Limit (WL)
Penetration, blows/foot: • 10 20 30 40 50
JYFIE ···········~·-·········l··········r······ .. ·r····· .. ···! .......... .
LL j•L t ' I
·••••••f\I••••••••rt•J••••••
REMARKS/ OTHER TESTS
2 inches grass and top soil
HO SAND light brown, fine grained, silty, moist. SM X ........... L .... I~ .; ..... ~.- .......... )" ........ +......... OS
::::::::::r::: :::. t:::·:::::r::::::::t::::::::::r::-:::::::
-15
-20
1-25
-30
... brown, medium dense.
CLAY grayish brown, trace to little fine grained sand, damp to moist.
... gray/grayish green, trace fine grained sand, iron stained, very stiff, moist.
........... ; .................... -~···· ....... ( ........... : .......... . ~ . ~ : ~
LL ................... .t. ······-··········r·········· ........... .
. ....... ... ! ..... ·····~······ ... t········ .. ~- ········ .. ~-. ······· ..
··••••:•.•t•••·••••••;······I••••·I·•········
LL ~ .t• ; ~~ ~ ~ ........... ; ...... T ......... T1 ........ ; ........... j .......... .
~ ~ ~ ~ ?a ?a ~ ' 't ! ' 1-'~'-/"-+_._ .. _m_o_i_st_t_o_v_e_ry_m_o_is_t_. ------------+----fx--'l··········r···········=r···· r•··l
···········j······· .. ··[··········1··········j······ .. ···j··········· ...... ·····~········ .. -~ ·········· :. ········ -~···· ..... ··y······ ....
: ~~:,:·.:·~:~.;:,' :~~.::·~. holo. • •.•.••••• !·········· : ...•.... ·-············· r•••••
PROJECT Watts Towers Cultural Crescent
Los Angeles, California
GEOBASE, INC. DEPTH TO WATER .'f. ~~ERJ.ACE ± feet LOGGED BY WYY
DATE DEPTH TO SLOUGH l DRILL CME-75 LOGGED 12/12/97
Note: This log of BORING should be evaluated in conjunction with the complete geotechnical report. This log of BORING represents conditions observed at the specific BORING location and at the date indicated.
El (Mix of 25' and 30')
c pp = 1.5 TSF
BORING NO. 8- 8
PROJECT NO. P.279.02
FIGURE NO. B-9
page 1 of 1
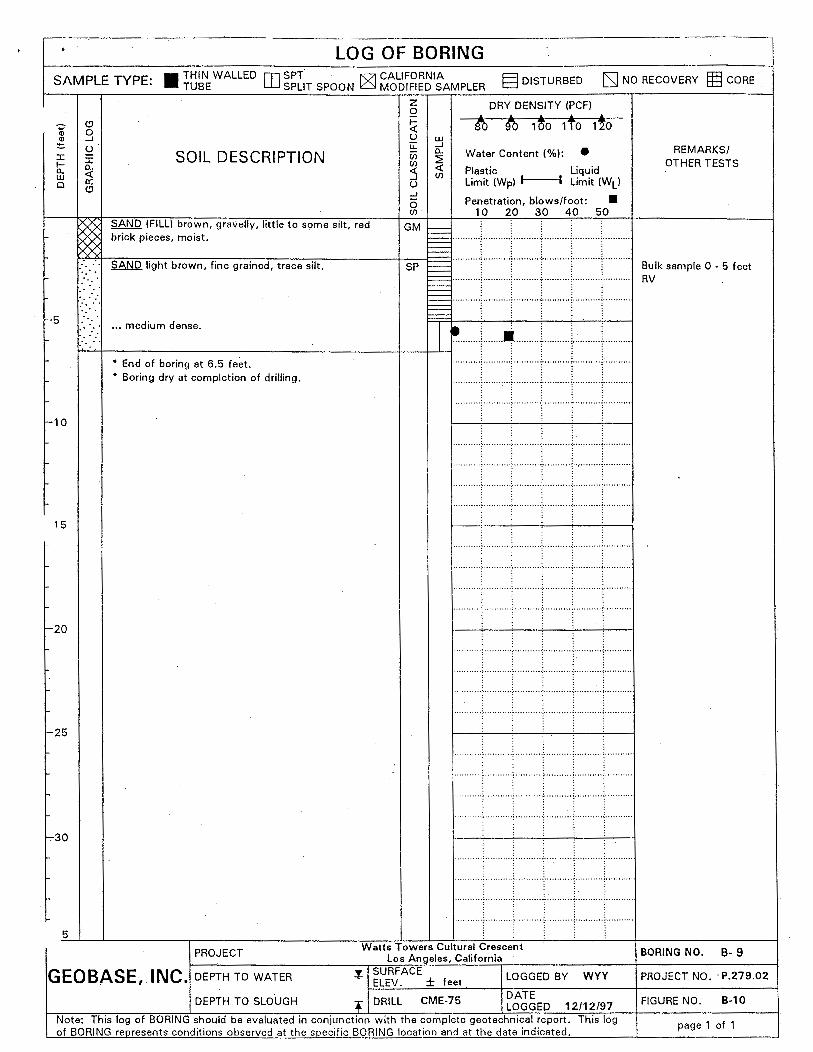
LOG OF BORING
• THIN WALLED rn SPT 1"71 CALIFORNIA
SAMPLE TYPE: TUBE SPLIT SPOON ~MODIFIED SAMPLER §DISTURBED [Sj NO RECOVERY If§ CORE
:r: to... UJ 0
t-5
-10
15
-20
t-25
t-30
5
Cl 0 ...J
u :r: 0... <( cr: Cl
SOIL DESCRIPTION
z 0 i= <( u UJ u:: ...J
Vi 0...
(/) :2 <( <( ...J (/)
u ...J
0 (/)'
DRY DENSITY (PCF)
t6 !'6 1to 1to 1~0
Water Content (%): •
Plastic liquid Limit (Wpl 1--1 Limit (WL)
Penetration, blows/foot: • 10 20 30 40 50 r SAND (FILL) brown, gravelly, little to some silt, red GM
t'--:4~-f'~t--::::-~;;-;icN;-;-k D;::-P-;-::~,....g0;-:t:-s~;-~-o-':-:t-.'-;:fi,-n-e -g-ra...,.in_e_d=-, -tr_a_c_e -sl,-.lt-. -------1-S-P-t=:::l .. :.::::::r:::::::::.::::::::::r:::::::::.:::::::::::.:::::::::::
i••·••·•••·:••·i••••I•••·······i••••·••••·'·•··•••••• r""'". t-. _._ •• _m_e_d-iu_m_d_e_n-se_·-------------+-+-.L....J ~~ .......................... T ..................... j ......... ..
* End of boring at 6.5 fe~t. .. ......... , ........... ; .......... : .......... j ........... ~ ......... ..
* Boring dry at completion of drilling. .. ........ .L ........ ) .......... + .......... j" ........ + ....... ..
PROJECT
.. . .. .. . . ··~ ........... ; ... ······. t· ....... ··~······. ····~··· ....... .
........
.......... .... ...... .....
........ . ....
...... . ...
....... ""
....... ""
.. ........
: : ~
..... .... .......
.. .... .... .....
""
.. T ... :
~
:
, ... , .......... :, ........ " ........... : .......... ; ........... ,
Watts Towers Cultural Crescent Los Angeles, California
........
....
....
...
.. .......
.. ....
""
.. ..
GEOBASE, INC. DEPTH TO WATER .f. ~~E~~CE ± feet LOGGED BY WYY
DATE DEPTH TO SLOUGH l DRILL CME-75 LOGGED 12/12/97
Note: This log of BORING should be evaluated in conjunction with the complete geotechnical report. This log of BORING represents conditions observed at the specific BORING location and at the date indicated.
REMARKS/ OTHER TESTS
Bulk sample 0 - 5 feet RV
BORING NO. B- 9
PROJECT NO. · P.279.02
FIGURE NO. B-10
page 1 of 1

LOG OF BORING
• THIN WALLED [JJ SPT 1'\7'1 CALIFORNIA
SAMPLE TYPE: TUBE SPLIT SPOON ~MODIFIED SAMPLER B DISTURBED IS] NO RECOVERY ffj3 CORE
:z: f-n.. w Q
-5
SOIL DESCRIPTION
SAND (FILL) brown, gravelly, some silt, damp to moist.
SAND light brown, fine grained, trace silt, damp.
... medium dense.
z 0 i= <1: u u:: (/) (/)
<1: . ...J u -I
0 (/)
SM
SP
DRY DENSITY (PCF)
lb ~ · 1to rto 1!o w
Water Content (%): • -I a_
~ Plastic Liquid Limit (Wpl 1----1 Limit (WL)
<1: (/)
Penetration, blows/foot: • 10 20 30 40 50
l•••·····••Ir~-•••••••·••r:r .•.•.. ~ : ~ : ~
•••••••;••••····:·•••••••·r•.r.••r•• SAND brown, fine grained, silty, moist.
HO
SM ~ I'i~LTJ 15~·~~~~~~~~~:-·:::::::~~~K~·::::::~r_r_::::::::~r~::::::
. ~ CLAY 9"Y, •omet;oo g";ood oeod, '"Y ot;ff, mo;,t. CL LL ......... , .... 11.., ........ , .......... , ....... , ....... .
~ ••·····•••;•••••·····:••·······r••r·••••.:••········ ~ ......... T ........ T .......... , ......... T ....... -r ........ . r20 ~ ... ""' t;oo g<oYol ~ ; ' ' n ' '
~ ···········)·······""'··········:·········:···········~···········
~ ...•••.•.. : •• , •..•••.... [····················:··········
-2s!~ ... '""' noo ,,;"'' ""' l L ~~I~~ ! L
~ 'TT!T ~ ···········'···········:···········r--·······l· .... ······r· .. ······
f-30 f-~<-"'-f-·_ .. _g-ra-y-is_h_b_r_o_w_n_, -tr-a-ce-fi_n_e -g-ra-in_e_d_s_a_n_d_, m-o-is-t.----t-~-~-'-f[>(--'1 ................ ~ ....... ~ ............................. . · ··· · · ·····~ ···· · ··· ···~ · ··· · ···· · T · ·· ... · ···1····· · ... --~···········
15 * End of boring at 31 .5. feet. * Groundwater. measured at 25.0 feet
at completion of drilling.
PROJECT
GEOBASE, INC. DEPTH TO WATER 25.0
:::::::::::;::::::::::r::::::::r::::::::r:::::::::r::::::::::
Watts Towers Cultural Crescent los Angeles, California
.!'. ~~E~.ACE ± feet LOGGED BY WYY
DATE DEPTH TO SLOUGH l DRILL CME-75 LOGGED 12/12/97
Note: This log of BORING should be evaluated in conjunction with the complete geotechnical report. This log of BORING represents conditions observed at the specific BORING location and at the date indicated.
REMARKS/ OTHER TESTS
ER, pH, Ch, 504
PP = 0.5 to 0. 75 TSF
PP=2.25 to 2.5 TSF c
BORING NO. B-10
PROJECT NO. P.279.02
FIGURE NO. B-11
page 1 of 1

LOG OF BORING
S E T • THIN WALLED [0 SPT fV'I CALIFORNIA AMPL YPE: TUBE SPLIT SPOON ~MODIFIED SAMPLER §DISTURBED (SJ NO RECOVERY §ij CORE
::r: 1-0.. w a
-5
-10
Cl 0 ...J
u 5: a.. <l: 0: Cl
·.·.
·.··
·.·. · ...
SOIL DESCRIPTION
SAND grayish brown, fine grained, silty, medium dense, moist.
z 0
~ u u::: (/) (/)
::5 u ...J
0 (/)
w ...J a.. 2 <l: (/)
DRY DENSITY (PCF)
t6 to 1to 11'o 1~0
Water Content (%): •
Plastic Liquid Limit (Wp) 1--1 Limit (WL)
Penetration, blows/foot: • 10 20 30 40 50
, REMARKS/ OTHER TESTS
Bulk sample 0.5 to 5 feet
CLAY/SILT gray, trace fine grained sand, moist.
~t/ t>< .••••• ·••••• :\f , OS
... , ........ , .... ·········+·········i·········· . . .
.... c-······· .i ......... ·,·· ·--~ .. .
... light brown, very silty, sandy, very stiff.
... gray.
... grayish green, very stiff, moist.
PROJECT
GEOBASE, INC. DEPTH TO WATER 25.0
CL u_ ········
··········
I·····
-••----~---········L .......• t ......... . ······························'··········+····----·
...... , .... ••••·•·\•·•••••r r••••••••·
[2< ..... t'----'
. .... ~ ..... : .... l .. ~·-----1 ...................... .
........ -: ......... ·:·... . .... ~- .......... ~- ......... .
............. ···: ........ -~···· ···:·~· .......... ~-···· ..... .
.. -~· ........ --~ ........ ··} .. . . .... ~-······ .... ~. ········· .
1···········!···················--·~~----·····--·····--···--····· ···········:···········~··········T·- ........ ~---········r··········
.. ·········:··· ........ ; ......... ·t· ......... ~--········ -~·-·· ...... .
.. . . . . . .. --~ .......... -~ ........ ··;· ......... j··· .... ···•j· ......... .
Watts Towers Cultural Crescent Los Angeles,-California
.!. ~~E~~CE ± feet LOGGED BY WYY
DATE DEPTH TO SLOUGH l DRILL CME-75 LOGGED 12/12/97
Note: This log of BORING should be evaluated in conjunction with the complete geotechnical report. This log of BORING represents conditions observed at the specific BORING location and at the date indicated.
El (Mix 25' and 30')
BORING NO. B-11
PROJECT NO. P.279.02
FIGURE NO. B-12
page 1 of 2

LOG OF BORING
TY • THIN WALLED rn SPT 1"71 CALIFORNIA SAMPLE PE: TUBE SPLIT SPOON l6l MODIFIED SAMPLER B DISTURBED [SJ NO RECOVERY §13 CORE
-.;:; C) Ill 0 Ill ...J ~ u J: J: SOIL DESCRIPTION f- a.. a.. ex: . UJ 0 a:
C)
... trace fine grained sand, damp.
1-40 ..• very stiff.
-45 SAND gray, fine grained, dense. : ~ ..
z 0
~ u u::: iii Cll ex: ...J u ...J
0 Cll
UJ ...J a.. ~ ex: Cll
DRY DENSITY (PCF)
lo to 1to fto 1!o
Water Content (%): • Plastic Liquid Limit (Wpl 1---1 Limit (WLl
Penetration, blows/foot: • 10 20 30 40 50
SP lL ......... }t. .... , .......... -..... , ...................... .
+\IF!!
REMARKS/ OTHER TESTS
PP= 1.5 to 2.0 TSF
0 J ! .1 . : ? > •• 50 blows for 4 inches 1-----'--'f--. _E_n_d_o_f_b_o_r_in_g_a__,t-5-1-.-0-fe_e_t_. ----------+--t--'---1 . ······ ., .......... ···········:··········:··········-;--···· ... .
... fine to medium grained, very dense, moist.
• Groundwater measured at 25.0 feet ···········~···········;···········j···········~···········j··········· . . ~ :
at completion of drilling. . .......... \. ......... .L. ......... \ ........... ; ........... j···········
f-55
-60
1-65
PROJECT
GEOBASE, INC. DEPTH TO WATER 25.0
DEPTH TO SLOUGH
. . . : : .
. . . . .. . . . . -~- .......... -; .......... ·j· .......... ~- .......... ~- ......... .
~ j : 1 : •••••• ····-~··········-~·-··· ······:······· ••• -i- . ••••••••• {······· ••••
rl rr: : :
::::::::::r::·:::::r::::::::r:::::::::::::::.::·::;:::::::::::
::::::::::r::::::::r::::::::r::::::::::c::::::::r::::::.:
········---~ ········ · ··t··· ·· ···-·r·· · ·······1········ ·-· ~--- ········
F· FTF Watts Towers Cultural Crescent
los Angeles, California ~ SURFACE
ELEV. ± feet
".f DRILL CME-75
LOGGED BY WYY
DATE LOGGED 12/12/97
Note: This log of BORING should be evaluated in conjunction with the complete geotechnical report. This log of BORING represents conditions observed at the specific BORING location and at the date indicated.
BORING NO. B-11
PROJECT NO. P.279.02
FIGURE NO. B-12
page 2 of 2

LOG OF TEST PIT M • THIN WALLED rn SPT r'71 CALIFORNIA
SA PLE TYPE: TUBE SPLIT SPOON ~ MOOIFIED SAMPLER B DISTURBED [SJ NO RECOVERY ~ CORE
0 ... Q) 0 ~ ...J
u ::r: :c 1- 0.. 0.. <( w 0 ex:
0
f-5
0
SOIL DESCRIPTION
SAND(Filll brown, gravelly with some silt, slightly moist.
... boulders and concrete pieces between 6 inches and 18 inches.
* Dimensions: 21' long (east-west direction) by 7' wide.
* End of test pit at 3 feet. * Test pit dry at completion of excavation.
z 0 i= <t: u w u::: ...J
0.. (/) ~ (/)
<( <t: ..J (/)
u ..J
0 (/)
SM
DRY DENSITY (PCF)
to !s 1to 1'to 1~0
Water Content (%): • Plastic Liquid Limit (Wpl 1----f Limit (WL)
Penetration, blows/foot: • 10 20 30 40 50
. .......... : ........... : ........... :. .......... t········-·1···········
. ........ : ........... i .......... l .......... j··· ........ ) .......... .
········-:'''''''''''~' ·····················
···--=
. .......... ; ........... ~ ........ "·+· ..... ····1· .......... ~- ......... .
....... ··: ····· ..... ~-·· ........ :· ......... ·:· ......... .
. . . . . -~ .......... -~ .......... ~- .......... ~- ......... .
. ··~· .. .. . ....... : ........... ;, .......... : .... ...... .
. ········ ··~ ········. •·;· ....... ··:·· ... ·····~····· ...... :·· ........ .
PROJECT Watts Towers Cultural Crescent Los Angeles, .California
GEOBASE, INC. DEPTH TO WATER .f. SURFACE ELEV. ± feet LOGGED BY WYY
DATE LOGGED 12/12/97
DEPTH TO SLOUGH l DRILL BACKHOE
Note: This log of TEST PIT should be evaluated in conjunction with the complete geotechnical report. This loq of TEST PIT reorese!ltS conditions observed at the soecific TEST PIT location and at the date indicated.
REMARKS/ OTHER TESTS
TEST PIT NO. TP- 1
PROJECT NO. P.279.02
FIGURE NO. B-13
page 1 of 1

LOG OF TEST PIT
• THIN WALLED OJ SPT . 1"71 CALIFORNIA
SAMPLE TYPE: TUBE SPLIT SPOON ~MODIFIED SAMPLER B DISTURBED [SJ NO RECOVERY fm CORE
:r: h: w Cl
r-5
J
(!) 0 ...J
(J
:r: 0.. <{ 0::: (!)
SOIL DESCRIPTION
-)<x SAND!Fill) brown, gravelly with some silt, slightly )< >< moist. Yx y » ~9<
)<
~ )<
><>< )<
><
X< ><
SAND brown, silty, fine grained.
* Dimensions: 26' long (east-west direction) by 5' wide.
* End of test pit at 4 feet. * Test pit dry at completion of excavation.
z 0 i= <{ (J
u: iii (/) <{ ...J (J
...J
0 (/)
SM
SM
DRY DENSITY (PCF)
to to 1to rto 1~0 w ...J 0.. ~
Water Content (%): • <{ (/) Plastic Liquid
Limit !Wpl J-f Limit !WL)
Penetration, blows/foot: • 10 20 30 40 50
T ; , , ,
........... ; ........... ; .......... .;. .......... ~ ......... ··~······ .... . ' : : . : !
........... f .......... ·t .......... ·:· .......... :· .......... ~- ......... .
. . :·-.......... -~ ........... : .......... .:. .......... ~- .......... ~- ......... .
....................... ; .......... _ .......... , .......... T·········
PROJECT Watts Towers Cultural Crescent
Los Angeles, California
GEOBASE, INC. DEPTH TO WATER ~ ~~E~.ACE ± feet LOGGED BY WYY
DATE DEPTH TO SLOUGH l DRILL BACKHOE LOGGED 12/12/97
Note: This log of TEST PIT should be evaluated in conjunction with the complete geotechnical report. This lao of TEST PIT represents conditions observed at the sp_ecific TEST PIT location and at the date indicated.
REMARKS/ OTHER TESTS
TEST PIT NO. TP- 2
PROJECT NO. P.279.02
FIGURE NO. B-14
page 1 of 1

LOG OF TEST PIT
• THIN WALLED OJ SPT l'V'I CALIFORNIA R
SAMPLE TYPE: TUBE SPLIT SPOON ~MODIFIED SAMPLER . t=:l DISTURBED ISJ NO RECOVERY §fl CORE
.... (!) <I) 0 <I) ...J
::::. u :r: :r: 1- a.. a.. <t: w Q a:
(!)
~ >)(< :>< >)(< >< $? X>< X" X>< >)(<
>)< )<
y xS><
>< ~ -;<><
~ X
. . .
.• .
t-5
SOIL DESCRIPTION
SAND(Fill) brown, gravelly with some silt, slightly moist.
... several boulders.
... Asphalt pieces
SAND brown, silty, fine grained .
* Dimensions: 25' long (east-west direction) by 5' wide.
* End of test pit at 4 feet. * Test pit dry at completion of excavation.
z 0 i= <t: u w u::: ...J
(jj a.. (/) ~ <t: <t: ...J (/)
u ...J
0 (/)
SM
SM
DRY DENSITY (PCF)
to !6 1to 1f"o 1~0
Water Content(%): •
Plastic Liquid limit (Wp) 1----l Limit (WL)
Penetration, blows/foot: • 10 20 30 40 50
... ·······-~ ······· ····f··········~···········~······ ·····i···········
.......... ·=-····· ..... -~···· ...... t······ ... -~······ ..... ; .......... .
. . . --~- ......... ·i··········. ~--······ .. .
. ...... -~- ..... ····:··"' ...... ~-·· ........ :·· ........ .
• <· ....• ' ..• -~ .•...•••.. ·:· ••••.•.•.• ~-. ········-~·-· •.••••.•
.........•....... --~·-·······-~·-········-~·-·········
.. ····:······ .... -t .......... ~- .......... ~- ......... .
........... L ......... ; .......... i .......... 1 ........ ) .......... .
PROJECT Watts Towers Cultural Crescent
Los Angeles, California
GEOBASE, INC. DEPTH TO WATER .!. SURFACE LOGGED BY WYY ELEV. ± feet
DATE DEPTH TO SLOUGH f DRILL BACKHOE LOGGED 12/12/97
Note: This log of TEST PIT should be evaluated in conjunction with the complete geotechnical report. This lo_g of TEST PIT represents conditions observed at the specific TEST PIT location and at the date. indicated.
REMARKS/ OTHER TESTS
TEST PIT NO. TP- 3
PROJECT NO. P.279.02
FIGURE NO. B-15
page 1 of 1

LOG OF TEST PIT
• THIN WALLED [l] SPT l'Vl CALIFORNIA
SAMPLE TYPE: TUBE SPLIT SPOON ~MODIFIED SAMPLER B DISTURBED IS] NO RECOVERY Em CORE
:r: 1-a.. UJ 0
-5
)
C)
0 _J
u :r: a.. <X: a: C)
X ><»< X»< ><»< ><»< ><»< ~ ~ >)& ><9< ·~
>)& ><>x 6>0< r)>?<
SOIL DESCRIPTION
SAND(Fill) greyish brown, gravelly with somecobbles, asphalt pieces to 3 feet depth.
... reddish brown, clayey.
z 0 i= <1: u u:: (jj If)
<1: ...J u ...J
0 If)
SM
DRY DENSITY (PCF)
to !6 1to 11"o 1~0 UJ _J a.. ~
Water Content (%): e <1: If)
Plastic Liquid Limit (Wpl l---1 Limit (WL)
Penetration, blows/foot: • 10 20 30 40 50
··········r········'······ -··········r·······i·········
~><
r~>«~-'"~r*;;-;D:;-:i-m_e_n...,si-on_s_:--:1:-::5'7' 7lo_n_g_(;-e-as._,.t--w-e-s-ct-'-d::-ir-e-ct7io-n-:-)-;-b-y-=7:-:,--t---+--l : I ; I ~ : * ~~~e~f test pit at 4 feet. l ~ * Test pit dry at completion of excavation.
PROJECT
...... ·····~······· ····}······ .... -~··········. ~-··········~····· ..... . : :
........... , ........... ~ .......... i ........... r .......... i. ......... .
...... .... -~·· .... ·····~ ..... ·····+ ........ ··!···········~···· ...... . . : :
: :
···········~···········~··········:··········r··········L ......... .
· Watts Towers Cultural Crescent Los Angeles, California
GEOBASE, INC. DEPTH TO WATER ~ SURFACE
ELEV. ± feet LOGGED BY WYY
DEPTH TO SLOUGH l DRILL BACKHOE DATE LOGGED 12/12/97
Note: This log of TEST PIT should be evaluated in conjunction with the complete geotechnical report. This log of TEST PIT represents conditions observed at the specific TEST PIT location and at the date indicated.
REMARKS/ OTHER TESTS
TEST PIT NO. TP- 4
PROJECT NO. P.279.02
FIGURE NO. B-16
page 1 of 1

LOG OF TEST PIT
• THIN WALLED OJ SPT 1'\7'1 CALIFORNIA ·
SAMPLE TYPE: TUBE SPLIT SPOON ~MODIFIED SAMPLER B DISTURBED [Sj NO RECOVERY §Ij CORE
:r: 1--0.. w 0
[>< [><
Cl 0 ...J
u :r: a.. ~ cc Cl
~ ~ D)< D)<
SOIL DESCRIPTION
GRAVEL{Fill) brown, some silt.
z 0 j:: <{ u ·w u: ...J
(j) 0..
(f) 2 <{ <{ ...J (/)
u ...J
0 (f)
GM
DRY DENSITY {PCFl
to !6 1to 1to 1~0
Water Content {%): • Plastic Liquid Limit {Wpl 1---1 Limit {WL)
Penetration, blows/foot: • 10 20 30 40 50
\ :
~ x ><)<
~ ~x
I····· ....... : .................. .
1--5
0
xx ><X
... abandoned pipe.
.......... · · SAND brown, silty, fine grained.
* Dimensions: 20' long {east-west direction) by 7' wide.
* End of test pit at 4 feet. * Test pit dry at completion of excavation.
SM • I :
·~
I········· I
I I I PROJECT
Watts Towers Cultural Crescent Los Angeles, California
: . ~·
!
1: SURFACE ELEV. ± feet LOGGED BY
DATE
WYY GEOBASE, INC. DEPTH TO WATER
DEPTH TO SLOUGH l DRILL BACKHOE LOGGED 12/12/97
Note: This log of TEST PIT should be evaluated in conjunction with the complete geotechnical report. This loa of TEST PIT represents conditions observed at the specific TEST PIT location and at the date indicated.
...
....
.....
REMARKS/ OTHER TESTS
TEST PIT NO. TP- 5
PROJECT NO. P.279.02
FIGURE NO. B-17
page 1 of 1

LOG OF TEST PIT
• THIN WALLED OJ SPT 1"71 CALIFORNIA R
SAMPLE TYPE: TUBE SPLIT SPOON ~MODIFIED SAMPLER · t::::J DISTURBED [SJ NO RECOVERY Em CORE
.... Q)
~ J: 1-a.. w 0
-5
(!] 0 ...J
u r SOIL DESCRIPTION a.. <( 0: (!]
~~ · GRAVEL{Fill) brown, some sand and silt.
Q< ><
X
· · SAND brown, silty, slightly moist.
... PVC pipe {active line).
* Dimensions: 20' long (east-west direction) by 8' wide.
* End of test pit at 4 feet. * Test pit dry at completion of excavation.
z 0
~ u u:: (j) 1/) <( ...J u ...J
0 1/)
GM
SM
. DRY DENSITY (PCF)
to to 1to 1'to 1~0 w ...J a.. ~
Water Content (%): • <( 1/) Plastic Liquid
Limit (Wpl ~ Limit {WL)
Penetration, blows/foot: • 10 20 30 40 50
: i ' ! : .......... -~ .......... -~ .......... -:. ......... ·1· .......... t· ......... .
........... r··· ....... T ........................................... .
r-- • .
r- ........... ; ........... ;·-·····-·-~·-········r··········i······----·
. .
. . .......... -~ .......... -~ .......... -~·· ......... ~- .......... 1 .......... .
··········-'···········:··········;···········r··········'···········
.......... L ......... , .......... ; .......... -r·········j---········
PROJECT Watts Towers Cultural Crescent
Los Angeles, California
GEOBASE, INC. DEPTH TO WATER .!: ~~:J~CE ± feet LOGGED BY WYY
DEPTH TO SLOUGH l DRILL BACKHOE DATE LOGGED 12/12/97
Note: This log of TEST PIT should be evaluated in conjunction with the complete geotechnical report. This log of TEST PIT represents conditions observed at the specific TEST PIT location and at the date indicated.
REMARKS/ OTHER TESTS
TEST PIT NO. TP- 6
PROJECT NO. P.279.02
FIGURE NO. B-18
page 1 of 1

APPENDIX C
Figure C-1 Summary of Laboratory Test Results
Figure C-2 Direct Shear Test Results
Figure C-3 Direct Shear Test Results
Figure C-4 Direct Shear Test Results
Figure C-5 Consolidation Test Results
. Figure C-6 Consolidation Test Results Figure C-7 Consolidation Test Results
Figure C-8 Expansion Potential, Corrosivity Series and Resistance ("A") Value Test Results
GEOBASE_INC_

GEOBA E, INC. r .~ure C-1
SUMMARY OF LABORATORY TEST RESULTS Page 1 of 2
PROJECT: Watts Towers Cultural Crescent PROJECT NO: P.279.02.00 DATE: January 5, 1998
BORING DEPTH MOISTURE DRY ATTERBERG LIMITS PARTICLE SIZE DISTRIBUTION OTHER TESTS DESCRIPTION (feet) CONTENT DENSITY AND REMARKS
(Percent) (pcf) LL PL PI CLAY SILT SAND GRAVEL (%) . (%) (%) (%) (%) (%) (%)
8-1 5.0-6.5 17 102.2 ML
10.0-11.5 25 ML
8-2 0.5-5.0 SM
5.0-6.5 19 SP
10.0-11.5 20 97.6 SM
8-3 ·o-5.0 SM 5.0-6.5 10 SP
10.0-11.5 23 94.7 SP and CL I
8-4 0.5-5.0 SP 5.0-6.5 24 96.8 SM
10.0-11.5 14 SM
8-5 5.0-6.5 7 96.8 OS SM 10.0-11.5 18 SM
8-6 0.5-5.0 SM
5.0-6.5 13 SM 10.0-11.5 13 97.2 c SM
8-7 0.5-5.0 RV SM
2.Q-3.5 16 SM
5.0~6.5 13 88.9 SM
10.0-11.5 11 SP/SM
15.0-16.5 26.9 95.4 pH, Ch, ER, S04 CL
20.0-21.5 30 CL
25.0-26.5 NO RECOVERY
30.0-30.5 27 SM
35.0-36.5 17 98.3 SP
40.0-41.5 32 SP/SM
45.0-46.5 36 CL/ML
50.Q-51.5 4 SP

GEOBA _.:, INC-. 1 . 0 ure C-1
SUMMARY OF lABORATORY TEST RESULTS Page 2 of 2
PROJECT: Watts Towers Cultural Crescent PROJECT NO: P.279.02.00 I DATE: January 5, 1998
BORING DEPTH MOISTURE DRY ATIERBERG LIMITS PARTICLE SIZE DISTRIBUTION OTHER TESTS DESCRIPTION (feet) CONTENT DENSITY AND REMARKS
(Percent) {pcf) LL PL PI CLAY SILT SAND GRAVEL (%) (%) {%) {%) (%) (%) (%)
8-8 5.0-6.5 8 SP
10.0-11.5 18 96.3 OS SM
15.0-16.5 22 SM
20.0-21.5 37 88.3 39 24 15 CL ' 25.0-26.5 32 CL
30.0-31.5 27 94.2 c CL
8-9 0-5.0 RV SP 5.0-6.5 1 SP
'
8-10 5.0-6.5 2 SP 10.0-11.5 16 97.2 pH, Ch, ER, S04 SM 15.0-16.5 24 CL 20.0-21.5 34 89.1 CL 25.0-26.5 35 CL 30.0-31.5 32 85.8 33 24 9 c ML/CL
8-11 0.5-5.0 SM
2.0-3.5 5 SM and SP
5.0-6.5 2 SP
10.0-11.5 18 SM
15.0-16.5 23 100.6 OS ML/CL
20.0-21.5 28 CL
25.0-26.5 34 88.4 CL
30.0-31.5 34 CL
35.0-36.5 40 83.2 CL
40.0-41.5 30 ML/CL
45.0-46.5 12 SP
50.0-51.0 17 SP
T-4 3.0-4.0 4 SM
T-5 3.0-4.0 3 SM
T-6 3.0-4.0 5 SM

4000
3000
u::: fJ)
e:. fJ) fJ) w
2000 a: ... fJ)
a: ~ w ::c fJ)
1000
0 0
SAMPLE DESCRIPTION: SAND, light brown, silty
BORING NO.: B- 5
DEPTH INTERVAL (ft): 5.0 - 6.5
NOTES:
GEOBASE
1000 2000 3000 4000 5000 6000
NORMAL LOAD (PSF)
. HEIGHT !in): 1.0
AREA (sq in): 4.58
STRAIN RATE (in/mini: 0.005
p .279.02.00
DRY DENSITY (pcf): 88.5
INITIAL MOISTURE(%): 17
FINAL MOISTURE (%): 36
COHESION (psf)
FRICTION ANGLE (deg)
Direct Shear Test Results Watts Towers Cultural Crescent
Los Angeles, California
PEAK • 174
31
ULTIMATE IIJ
166
30
Fiaure C-2

4000
3000
rL en !: en en w
2000 a: ~ en a: q: w :z:: en
1000
0 0
SAMPLE DESCRIPTION: SAND, brown, silty
BORING NO.: B- 8
DEPTH INTERVAL (ft): 1 0.0· 11.0
NOTES:
GEOBASE
1000 2000 3000 4000 5000 6000
NORMAL LOAD IPSF)
HEIGHT (in): 1.0
AREA (sq in): 4.58
STRAIN RATE (in/min): 0.005
P.279.02.00
DRY DENSITY (pcf): 89.7
INITIAL MOISTURE(%): 18
FINAL MOISTURE 1%1: 30
COHESION (psf)
FRICTION ANGLE (deg)
Direct Shear Test Results .Watts Towers Cultural Crescent
Los Angeles, California
PEAK • 97
32
ULTIMATE III
s· 32
Fiaure C-3

4000 ~------~r-------~--------~--------~--------~------~
3000
u: (f)
!::. (f) (f) w
2000 a: 1-(f)
a: <t w :J: (f)
1000
0 ~------~--------~--------~--------~--------~------~ 0 1000 2000 3000 4000 5000 6000
NORMAL LOAD (PSFI
SAMPLE DESCRIPTION: CLAY/SILT, grey, little sand
BORING NO.: B-11
DEPTH INTERVAL (ft): 15.0- 16.0
NOTES:
GEOBASE
HEIGHT (in): 1.0
AREA (sq in): 4.58
STRAIN RATE (in/min): 0.002
P.279.02.00
DRY DENSITY (pcf): 99.9
INITIAL MOISTURE (%1: 25
FINAL MOISTURE (%): 25
COHESION (psf)
FRICTION ANGLE (degJ
Direct Shear Test Results Watts Towers Cultural Crescent
Los Angeles, California
PEAK • 223
31
ULTIMATE III
188
31
Fiaure C-4

Water Added o• - r-- t--4
2 r---.__
' "-1 . ._
4
-..... ........_ ..... f"'---
"' ~ "" ......... 6 --
#. z 8 <( a: 1-Cl)
..J 10 .q: 0 i= a: w > 12
14
16
18
20 0.1 1 CONSOLIDATION PRESSURE !KSFI 10 100
BORING NO.: 8- 6
DEPTH (ft): 10.0
SAMPLE DESCRiPTION: SAND. brown. little silt
'
. Consolidation Test Results l
GEOBASE ; Watts Towers Cultural Crescent
P.279.02.00 Los Angeles, California
FiQure C-5

Water Added 0 -t--t-- jv
.-t-.~ v 2
·~ r--.... - -o- .............
4 - -~---- - ~ =.31!"- -. ........ -- ~'-...
6 .r'--.
f.. '-..,... r--.._
* z 8 - ~
<1: 0:: 1-Vl ..J 10 <t (J
i= 0:: w > 12
14
16
18
20
0.1 1 CONSOLIDATION PRESSURE (KSF) 10 100
BORING NO.: B- 8
DEPTH (ft): 30.0
SAMPLE DESCRIPTION: CLAY, greyish brown, very silty
Consolidation Test Results
GEOBASE Watts Towers Cultural Crescent
P.279.02.00 Los Angeles, California
Fiqure C-6
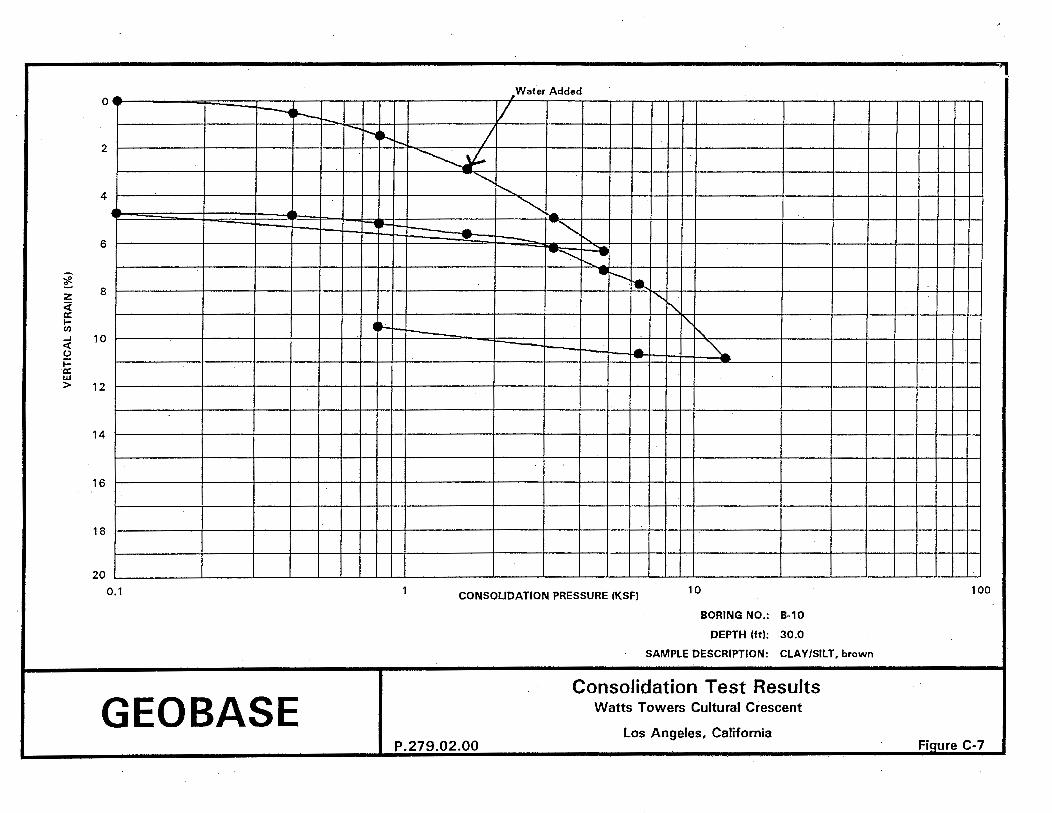
0 ,Water Added
1-1 ,__ '1-- v
2 ~ ..... f.... I ~
4 ""' " ~ f-A ""1,_ ~ - ~ 6 - !-...
-~ ~--....--
~ llr--..
z 8 t. ' ct
a: ~ .... II) il. I" ...J 10
f--<( "' (.) -- - "\.... i= a: w > 12
14
16
18
20
0.1 1 CONSOLIDATION PRESSURE (KSFI 10 100
BORING NO.: B-10
DEPTH !ftl: 30.0
SAMPLE DESCRIPTION: CLAY/SILT, brown
Consolidation Test Results
GEOBASE Watts Towers Cultural Crescent
P.279.02.00 Los Angeles, California
Fioure C-7

P.279.02.00 January 5, 1998
SOIL SAMPLE LOCATION. (feet)
8~8 at 25.0 to 30.0
B-11 at 25.0-30.0
SOIL SAMPLE LOCATION (FEET)
B-7 AT 15.0
8-10 AT 10.0 TO 15.0
SAMPLE LOCATION
(feet)
B-7 at 15.0
B-10 at 10.0 to 15.0
pH (Cal. 747)
9.3
9.9
SAMPLE LOCATION
(feet)
EXPANSION POTENTIAL U.B.C. No. 29-2
EXPANSION INDEX
42
42
WATER SOLUBLE SULFATES CAL. 417-A
SOLUBLE SULFATES PPM
144
132
CORROSIVITY SERIES TEST
EXPANSION POTENTIAL
Low
Low
Figure C-8
POTENTIAL FOR ATIACKON CONCRETE
Low
Low
SOLUBLE ELEC. RESISTIVITY POTENTIAL FOR CHLORIDES (CAL.643)
PPM (OHM-CM)
74 2336
80 3066
RESISTANCE ("R") VALUE CAL. 301
ATTACK ON STEEL (SENATOROFF)
Moderate
Moderate
A-VALUE BY EXUDATION
B-7 at 0 to 5.0
B-9 at 0.5 to 5.0
46
72