
global · 2015-08-17 · global Sunita Taneja1, Shikhar Bahl1, Sarmila ... Effect of implementing...
11
PAPERS journal of health global Sunita Taneja 1 , Shikhar Bahl 1 , Sarmila Mazumder 1 , Jose Martines 2 , Nita Bhandari 1 , Maharaj Kishan Bhan 3 1 Centre for Health Research and Development, Society for Applied Studies, New Delhi, India 2 Centre for Intervention Science in Maternal and Child Health, Centre for International Health, University of Bergen, Norway 3 Ministry of Science and Technology, Government of India, New Delhi, India Correspondence to: Maharaj Kishan Bhan National Science Professor Indian Institute of Technology F-14, Hauz Khas Enclave New Delhi-110016 India [email protected] Impact on inequities in health indicators: Effect of implementing the integrated management of neonatal and childhood illness programme in Haryana, India Background A trial to evaluate the Integrated Management of Neo- natal and Childhood Illness (IMNCI) strategy showed that the inter- vention resulted in lower infant mortality and improved infant care practices. In this paper, we present the results of a secondary analysis to examine the effect of the IMNCI strategy on inequities in health indicators. Methods The trial was a cluster–randomized controlled trial in 18 primary health centre areas. For this analysis, the population was di- vided into subgroups by wealth status (using Principal Component Analysis), religion and caste, education of mother and sex of the in- fant. Multiple linear regression analysis was used to examine ineq- uity gradients in neonatal and post–neonatal mortality, care practices and care seeking, and the differences in these gradients between in- tervention and control clusters. Findings Inequity in post–neonatal infant mortality by wealth status was lower in the intervention as compared to control clusters (adjusted difference in gradients 2.2 per 1000, 95% confidence interval (CI) 0 to 4.4 per 1000, P = 0.053). The intervention had no effect on inequities in neonatal mortality. The intervention resulted in a larger effect on breastfeeding within one hour of birth in poorer families (difference in inequity gradients 3.0%, CI 1.5 to 4.5, P < 0.001), in lower caste and minorities families, and in infants of mothers with fewer years of school- ing. The intervention also reduced gender inequity in care seeking for severe neonatal illness from an appropriate provider (difference in in- eguity gradients 9.3%, CI 0.4 to 18.2, P = 0.042). Conclusions Implementation of IMNCI reduced inequities in post– neonatal mortality, and newborn care practices (particularly starting breastfeeding within an hour of birth) and health care–seeking for severe illness. In spite of the intervention substantial inequities re- mained in the intervention group and therefore further efforts to en- sure that health programs reach the vulnerable population subgroups are required. Trial Registration Clinicaltrials.gov NCT00474981; ICMR Clinical Trial Registry CTRI/2009/091/000715 In human rights terms, the word equity represents equality and fairness. It is synonymous with the notion of distributive justice, or fair distribu- tion of good things within a society, whether they may be material pos- www.jogh.org • doi: 10.7189/jogh.05.010401 1 June 2015 • Vol. 5 No. 1 • 010401
Transcript of global · 2015-08-17 · global Sunita Taneja1, Shikhar Bahl1, Sarmila ... Effect of implementing...
VIE
WPO
INTS
PAPE
RS
journal of
healthglobal
Sunita Taneja1, Shikhar Bahl1, Sarmila Mazumder1, Jose Martines2, Nita Bhandari1, Maharaj Kishan Bhan3
1 Centre for Health Research and Development, Society for Applied Studies, New Delhi, India
2 Centre for Intervention Science in Maternal and Child Health, Centre for International Health, University of Bergen, Norway
3 Ministry of Science and Technology, Government of India, New Delhi, India
Correspondence to:Maharaj Kishan Bhan National Science Professor Indian Institute of Technology F-14, Hauz Khas Enclave New Delhi-110016 India [email protected]
Impact on inequities in health indicators: Effect of implementing the integrated management of neonatal and childhood illness programme in Haryana, India
Background A trial to evaluate the Integrated Management of Neo-natal and Childhood Illness (IMNCI) strategy showed that the inter-vention resulted in lower infant mortality and improved infant care practices. In this paper, we present the results of a secondary analysis to examine the effect of the IMNCI strategy on inequities in health indicators.
Methods The trial was a cluster–randomized controlled trial in 18 primary health centre areas. For this analysis, the population was di-vided into subgroups by wealth status (using Principal Component Analysis), religion and caste, education of mother and sex of the in-fant. Multiple linear regression analysis was used to examine ineq-uity gradients in neonatal and post–neonatal mortality, care practices and care seeking, and the differences in these gradients between in-tervention and control clusters.
Findings Inequity in post–neonatal infant mortality by wealth status was lower in the intervention as compared to control clusters (adjusted difference in gradients 2.2 per 1000, 95% confidence interval (CI) 0 to 4.4 per 1000, P = 0.053). The intervention had no effect on inequities in neonatal mortality. The intervention resulted in a larger effect on breastfeeding within one hour of birth in poorer families (difference in inequity gradients 3.0%, CI 1.5 to 4.5, P < 0.001), in lower caste and minorities families, and in infants of mothers with fewer years of school-ing. The intervention also reduced gender inequity in care seeking for severe neonatal illness from an appropriate provider (difference in in-eguity gradients 9.3%, CI 0.4 to 18.2, P = 0.042).
Conclusions Implementation of IMNCI reduced inequities in post–neonatal mortality, and newborn care practices (particularly starting breastfeeding within an hour of birth) and health care–seeking for severe illness. In spite of the intervention substantial inequities re-mained in the intervention group and therefore further efforts to en-sure that health programs reach the vulnerable population subgroups are required.
Trial Registration Clinicaltrials.gov NCT00474981; ICMR Clinical Trial Registry CTRI/2009/091/000715
In human rights terms, the word equity represents equality and fairness. It is synonymous with the notion of distributive justice, or fair distribu-tion of good things within a society, whether they may be material pos-
www.jogh.org • doi: 10.7189/jogh.05.010401 1 June 2015 • Vol. 5 No. 1 • 010401
VIE
WPO
INTS
PAPE
RSTaneja et al.
sessions, access to health care or simply survival. Health equity has been defined as the absence of systematic dis-parities in health (or its social determinants) between more and less advantaged groups [1].
Health indicators such as infant mortality have improved in India over time but still continue to be differential across gender, caste, wealth, education and geography [2]. For ex-ample, the National Family Health Survey 2005–2006 showed that infant mortality was 70 per 1000 live births for the poorest and 29 per 1000 for the least poor, 42 and 62 per 1000 live births for urban and rural areas respectively, and 70 and 26 per 1000 live births for those with illiterate mothers and mothers with 12 or more years of schooling re-spectively. In the past few years India’s economic growth has been impressive, but neither the distribution of wealth gen-erated by economic growth nor direct investments in health infrastructure and support systems have been equitably dis-tributed. The result is that poorer families are less likely to access maternal and child health services than wealthier ones. In addition to economic inequity in access to health care, there are social inequities as well. For example, girls, infants from lower caste families and those with illiterate mothers are less likely to receive health care than boys, in-fants from higher caste families and those with mothers who have completed secondary school.
In 2002, implementation of the Integrated Management of Neonatal and Childhood Illness (IMNCI) strategy was start-ed in India. In addition to treatment of common neonatal and childhood illneses, IMNCI included home visits to all newborns in the first week of life, and community mobiliza-tion activities. We conducted a cluster randomized trial to evaluate IMNCI and found that its implementation resulted in 15% lower infant mortality in the intervention clusters. We also found a substantial improvement in the home based newborn care practices such as initiation of breast feeding within an hour, exclusive breast feeding at four weeks, de-layed bathing and appropriate cord care, and in treatment seeking practices in the intervention clusters [3].
Most large studies to evaluate the effect of interventions on newborn and child mortality report only overall results, and not the effect in vulnerable population subgroups. We believe that for an intervention shown to be efficacious in a representative population, several factors require atten-tion when translating research findings to program policy; these include intervention impact on vulnerable groups. We therefore hypothesized that IMNCI implementation would result in a reduction of inequity in neonatal and post–neonatal mortality, health care for illness and in new-born care practices. In this paper we present the results of a secondary analysis to examine the extent to which the IMNCI implementation changed the prevailing health in-equities.
METHODS
Methods of the main trial
The methods of the cluster–randomized trial evaluating IMNCI have been previously published and are briefly summarized below [3].
Setting
The trial was conducted in 18 rural areas served by prima-ry health centres in district Faridabad, Haryana, India, with a population of 1.1 million. In this setting, about half of the mothers had never been to school; 95% of the women do not work outside home. 25% of the newborns are low birth weight and 60% of sick children sought care from medi-cally unqualified private practitioners [4,5].
Randomization
In order to randomize the primary health centre areas into intervention and control groups, a baseline survey was con-ducted and information was obtained on proportion of home deliveries, mothers who had never been to school, population per cluster, and neonatal and infant mortality. The clusters were divided into three strata with 6 clusters each according to their baseline neonatal mortality rates. Ten stratified randomization schemes were generated by an independent epidemiologist, of which seven schemes had a similar neonatal mortality rate, proportion of home births, proportion of mothers never been to school and population size in the intervention and control groups. One of these seven schemes was selected by a computer generated random number and was used to allocate the clusters into intervention and control groups.
IMNCI intervention
The intervention was designed following the guidelines de-fined by the Government of India for IMNCI [6–9]. The study activities in the intervention clusters included:
a) Post–natal home visits during the newborn period: Com-munity health workers in the intervention clusters were trained to conduct home visits; counsel mothers on opti-mal essential newborn care practices, identify illnesses, treat mild illness and refer newborns with danger signs.
b) Improving health worker skills for case management of neonatal and childhood illness: All staff working in the public health facilities were trained in improving their ex-isting skills for management of sick neonates and children. Training was given using the Government of India IMNCI training module. Formal and informal sector private pro-viders also underwent IMNCI orientation sessions.
c) Strengthening the health system to implement IMNCI: Supervision of community health workers was improved,
June 2015 • Vol. 5 No. 1 • 010401 2 www.jogh.org • doi: 10.7189/jogh.05.010401
VIE
WPO
INTS
PAPE
RS
Inequities in health indicators in Haryana, India
workers were provided performance–based incentives, un-interrupted supplies of essential medicines were ensured through village level depots. To improve community aware-ness of the available services three monthly women’s group meetings were conducted in each village.
Routine care
Routine care includes the activities that were provided by
the health care system for newborns and children in both
intervention and control areas. This care was provided by
two types of community health workers (Anganwadi work-
ers and Accredited Social Health Activists or ASHAs), first
level health workers (Auxiliary Nurse Midwives) and pri-
mary health care physicians. The activities of each catego-
ry of workers are briefly described below:
Anganwadi workers: Their routine care activities included
preschool education, supplementary nutrition and growth
monitoring, largely delivered at Anganwadi centres. Their
IMNCI–specific activity (only in intervention areas) was to
make home visits after birth to promote optimal newborn
care practices.
Accredited Social Health Activists (ASHAs): Their rou-
tine care activities included promotion of antenatal care,
hospital births and immunization and contraception ser-
vices. Their IMNCI–specific activities (only in intervention
areas) were to conduct women’s group meetings to promote
newborn care and to treat minor illnesses using the IMNCI
algorithm.
Auxiliary Nurse Midwives (ANMs): Their routine care
activities included provision of immunization, family plan-
ning, antenatal care, first level treatment of children with
illness and conduction of deliveries. Their IMNCI–specific
activity (only in intervention areas) was to treat newborn
and childhood illnesses using the IMNCI algorithm.
Primary health care physicians: Their routine care activ-
ities included provision of outpatient treatment of child-
hood illnesses. Their IMNCI–specific activity (only in in-
tervention areas) was to treat newborn and childhood
illnesses using the IMNCI algorithm.
Outcome measurement
The primary outcomes of the trial were neonatal and infant mortality, and the secondary outcomes included newborn care practices and care–seeking for illness. The interven-tion was initiated in January 2007, and data collection for outcome measurement was started in January 2008.
The overall sample size of the study was about 30 000 live births per group, which was calculated for ascertain-ing a 20% difference in neonatal and infant mortality, the primary outcomes of the study. All live births in the in-
tervention and control clusters were visited on day 29
(for ascertaining neonatal mortality) and at 6 and 12
months of age (for ascertaining post–neonatal mortality).
Households in the intervention and control areas were
allocated to one of the 110 study field workers who were
not involved with IMNCI implementation. The workers
visited the allocated households every month to identify
new pregnancies and inquire about the outcome of pre-
viously identified pregnancies. All live births identified
by the workers were entered into a database, which was
used to generate the due dates to follow up these infants
by making home visits. All households with live births
were visited on day 29 and at ages 3, 6, 9, and 12 months
to document the vital status of the infant by the worker
to whom the household was allocated. The worker con-
firmed the identification of the infant through a set of
questions before asking about the health status of the in-
fant. These surveillance workers were not told the inter-
vention status of the clusters. The follow–up procedures
were identical in intervention and control clusters. Infor-
mation was also obtained from all enrolled infants about
socio–demographic characteristics and possession of as-
sets at enrolment.
Secondary outcomes, including newborn care practices
and treatment seeking for illness, were ascertained in a sub-
set of enrolled infants at day 29 of life. These outcomes
were assessed through an interview by a research assistant
with the primary caregiver that lasted 45 minutes to an
hour. The sample size for these outcomes was 6200 per
group, which was calculated to ascertain at least a 10% ab-
solute difference in care seeking from an appropriate pro-
vider for neonatal illness. A random sample of enrolled in-
fants in both the intervention and control clusters was
selected for ascertaining secondary outcomes in the follow-
ing manner. All live births identified by the surveillance
workers were entered into a database. Dates for their 29–
day visit were generated using a computer program. At the
same time, one of five enrolled infants was randomly se-
lected by the computer program for an interview for sec-
ondary outcomes. The identification numbers of infants
selected for interview were communicated to the research
assistants of the secondary outcome assessment team a day
before the scheduled interview.
Ethical considerations
The study was approved by the ethics review committee of the Society for Applied Studies and World Health Organi-zation. Permissions were also obtained from the state and district authorities. Informed consent was taken from the women with a live birth prior to the first interview. Over-sight to the study was provided by a study advisory group and Data Safety Monitoring Board (DSMB).
www.jogh.org • doi: 10.7189/jogh.05.010401 3 June 2015 • Vol. 5 No. 1 • 010401
VIE
WPO
INTS
PAPE
RS
Secondary analysis for ascertaining impact on equity
Analysis was performed using Stata software version 11 (StataCorp, College Station, TX, USA) and the methods are described below.
Population subgroups
The infants in intervention and control clusters were di-vided into subgroups based on their families’ wealth, reli-gion and caste, mother’s years of schooling and the sex of the infant. The wealth of an individual was determined by a wealth index created using primary component analysis based on all of the assets owned by a household. The fact that a household did not own a particular asset that was generally associated with poor households was also used in the calculation of wealth index. The following variables from the initial survey were used to determine the assets owned by a household: the source of drinking water, use of electricity, type of sanitation, type of cooking fuel used, con-struction materials used for roof, floor and walls of the house, ownership of items like mattress, a pressure cooker, a chair, a cot/bed, a table, an electric fan, a radio/transistor, a black and white television, a colour television, a sewing machine, a mobile telephone, any other telephone, a com-puter, a refrigerator, a watch or clock, a bicycle, a motor-cycle or scooter, an animal–drawn cart, a car, a water pump, a thresher, a tractor, house ownership; number of house-hold members per sleeping room; ownership of a bank or post–office account. An asset score with a mean of 0 and standard deviation of 1 was used in the principal compo-nent analysis. Using the score from the wealth index the population was divided into five equal wealth quintiles. Re-ligion and caste was classified into upper caste Hindu, low-er caste Hindus (scheduled castes and tribes), and non–Hindu. Maternal education was classified as none, 1–9 years, 10–11 and 12 or more years of schooling.
Inequities in health outcomes
Neonatal mortality, post neonatal mortality, newborn care practices (eg, exclusive breastfeeding within 1 hour) and careseeking from an appropriate provider for danger signs and pneumonia were displayed for intervention and con-trol areas in subgroups by wealth quintiles, religion and caste, maternal education and sex of the infant. We chose to analyze inequities in neonatal and post–neonatal mor-tality separately because the overall results of IMNCI trial showed that most of the effect of the intervention on infant mortality was attributable to post–neonatal mortality.
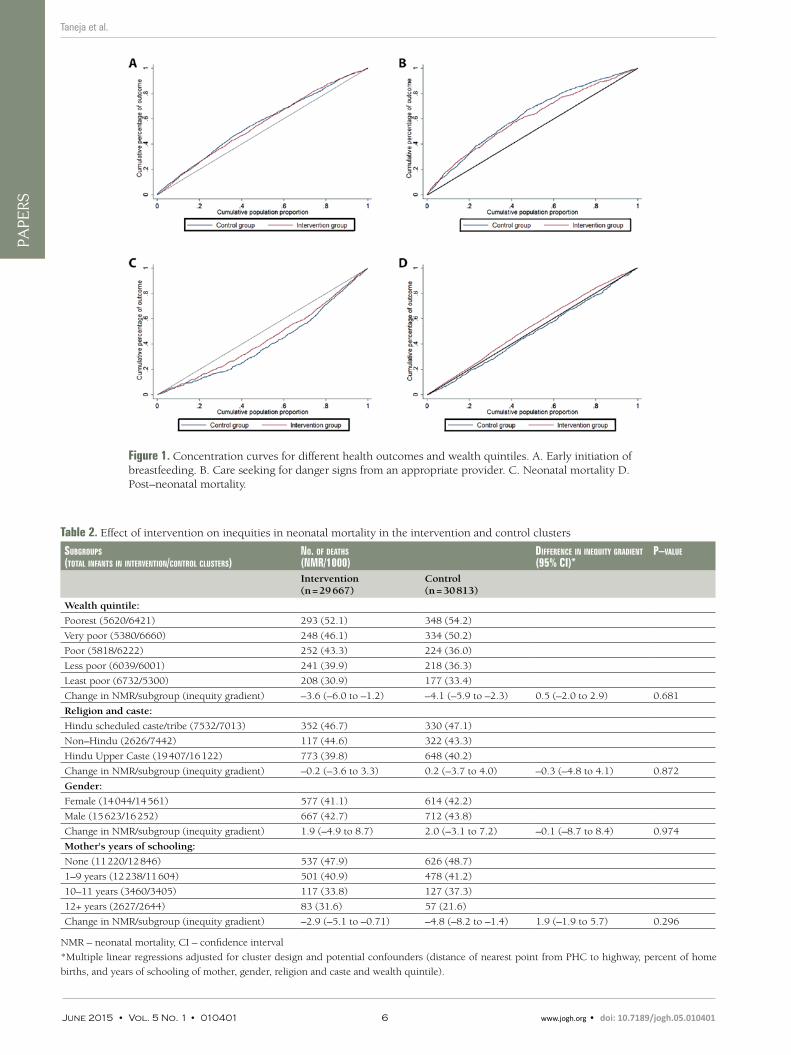
In order to visually assess the degree of income–related in-equity in the distribution of health outcomes in interven-tion and control clusters (neonatal deaths, post neonatal deaths, number of infants who initiated breastfeeding with-
in one hour after birth), we used General Lorenz concen-tration curves. The concentration curve plots the cumula-tive percentage of the health outcome (y–axis) against the cumulative percentage of the population ranked by wealth quintile, beginning with the poorest, and ending with the richest (x–axis). The curve is expected to be above the di-agonal equity line for a negative outcome like mortality in-dicating that more deaths occur in the poorer than richer quintiles in the population. Conversely, the curve is ex-pected to be below the equity line for a positive outcome such as utilization of health care indicating that relatively lower number of the poorer quintiles has the outcome.
Effect of the intervention on inequity
The results were analyzed through a multiple linear regres-sion model with a health outcome (neonatal mortality, post–neonatal mortality, exclusive breastfeeding within 1 hour and care seeking from an appropriate provider for a danger sign) as the dependent variable and population sub-groups (by wealth quintile, religion and caste, level of edu-cation of the mother and sex of infant) as the independent variable. This multiple regression model was adjusted for cluster design and possible confounders such as distance of the cluster from the highway and percent of home births in the cluster. Additional covariates were the intervention group (intervention or control) and an interaction term of the intervention with the population subgroup (eg, wealth quintile × intervention group). The regression coefficient of this interaction term, which reflects the difference in ineq-uities between the intervention and control groups, was the main indicator of the effect of the intervention on equity.
RESULTS
Overall results of the IMNCI trial
The overall results of the trial have been published previ-ously [3] but are briefly described here in order to provide the reader an overview of the overall impact of the inter-vention before presenting the results related to inequities.
A total of 60 702 infants were enrolled into the trial. There were some differences between the intervention and con-trol clusters at baseline. The control clusters had features of urbanization; a higher proportion of houses had private toilets (46% vs 38%) and a lower proportion possessed ‘be-low poverty line’ card, the families in the control clusters were nearer to the highway than families in the interven-tion areas (7.0 km vs 15.3 km) and had lower proportion of home births (65.9% vs 71.9%).
Overall, the infant mortality rate was significantly lower in the intervention clusters than in the control clusters (ad-justed hazard ratio 0.85, 95% CI 0.77 to 0.94). The ad-
Taneja et al.
June 2015 • Vol. 5 No. 1 • 010401 4 www.jogh.org • doi: 10.7189/jogh.05.010401
VIE
WPO
INTS
PAPE
RS
justed hazard ratio for neonatal mortality rate was 0.91 (0.80 to 1.03) and that for post–neonatal mortality was 0.76 (0.67 to 0.85). The intervention clusters had signifi-cant improvement in newborn and infant care practices. For example, almost 41% of the caregivers in the interven-tion clusters reported starting breastfeeding within an hour of birth, compared with 11.2% in the control clusters (odds ratio 5.21, 95% CI 4.33 to 6.28).
Population sub–groups in intervention and control clusters
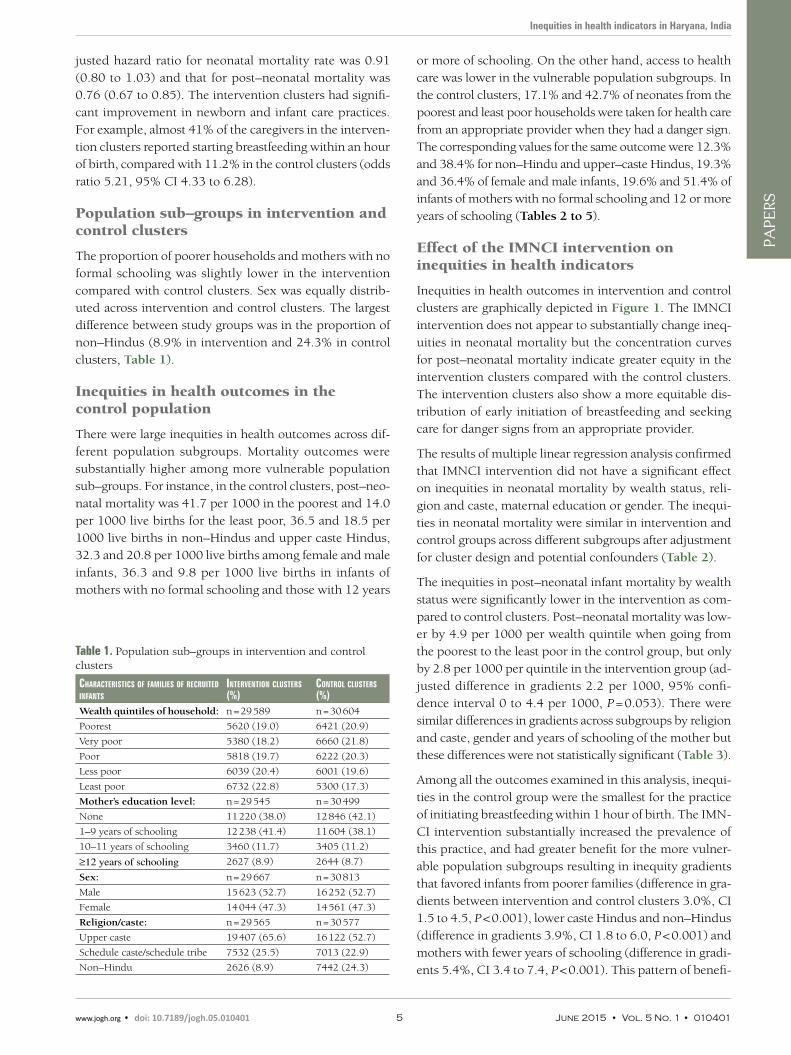
The proportion of poorer households and mothers with no formal schooling was slightly lower in the intervention compared with control clusters. Sex was equally distrib-uted across intervention and control clusters. The largest difference between study groups was in the proportion of non–Hindus (8.9% in intervention and 24.3% in control clusters, Table 1).
Inequities in health outcomes in the control population
There were large inequities in health outcomes across dif-ferent population subgroups. Mortality outcomes were substantially higher among more vulnerable population sub–groups. For instance, in the control clusters, post–neo-natal mortality was 41.7 per 1000 in the poorest and 14.0 per 1000 live births for the least poor, 36.5 and 18.5 per 1000 live births in non–Hindus and upper caste Hindus, 32.3 and 20.8 per 1000 live births among female and male infants, 36.3 and 9.8 per 1000 live births in infants of mothers with no formal schooling and those with 12 years
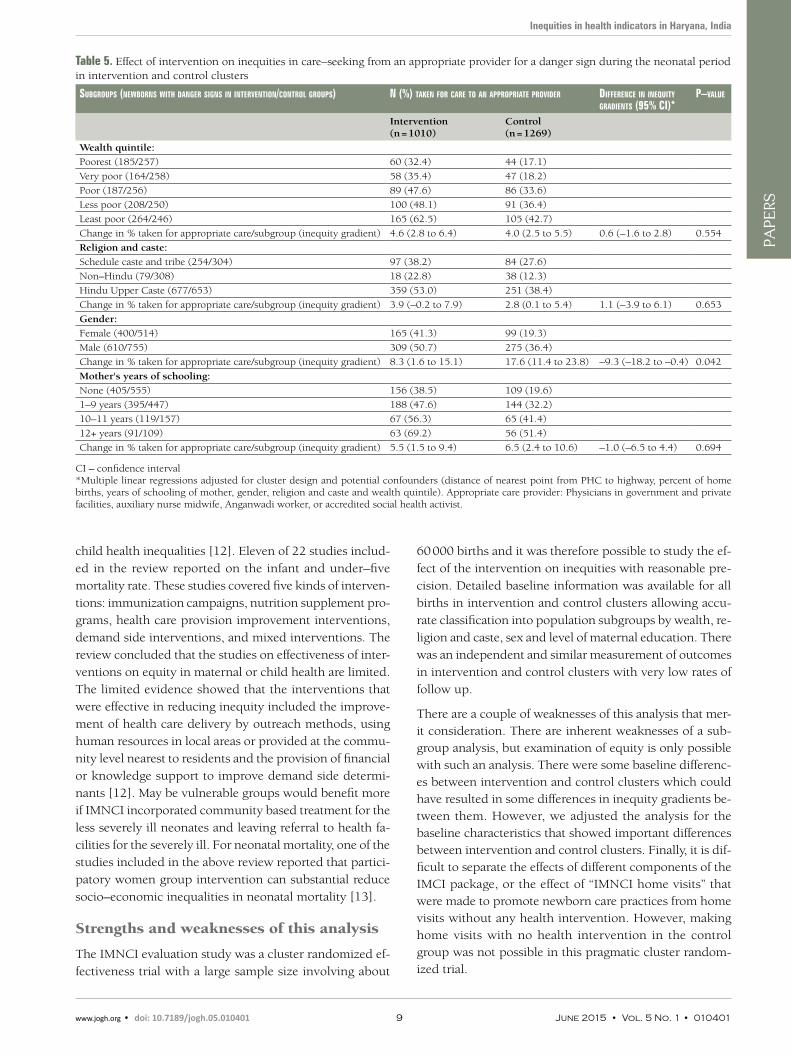
or more of schooling. On the other hand, access to health care was lower in the vulnerable population subgroups. In the control clusters, 17.1% and 42.7% of neonates from the poorest and least poor households were taken for health care from an appropriate provider when they had a danger sign. The corresponding values for the same outcome were 12.3% and 38.4% for non–Hindu and upper–caste Hindus, 19.3% and 36.4% of female and male infants, 19.6% and 51.4% of infants of mothers with no formal schooling and 12 or more years of schooling (Tables 2 to 5).
Effect of the IMNCI intervention on inequities in health indicators
Inequities in health outcomes in intervention and control clusters are graphically depicted in Figure 1. The IMNCI intervention does not appear to substantially change ineq-uities in neonatal mortality but the concentration curves for post–neonatal mortality indicate greater equity in the intervention clusters compared with the control clusters. The intervention clusters also show a more equitable dis-tribution of early initiation of breastfeeding and seeking care for danger signs from an appropriate provider.
The results of multiple linear regression analysis confirmed that IMNCI intervention did not have a significant effect on inequities in neonatal mortality by wealth status, reli-gion and caste, maternal education or gender. The inequi-ties in neonatal mortality were similar in intervention and control groups across different subgroups after adjustment for cluster design and potential confounders (Table 2).
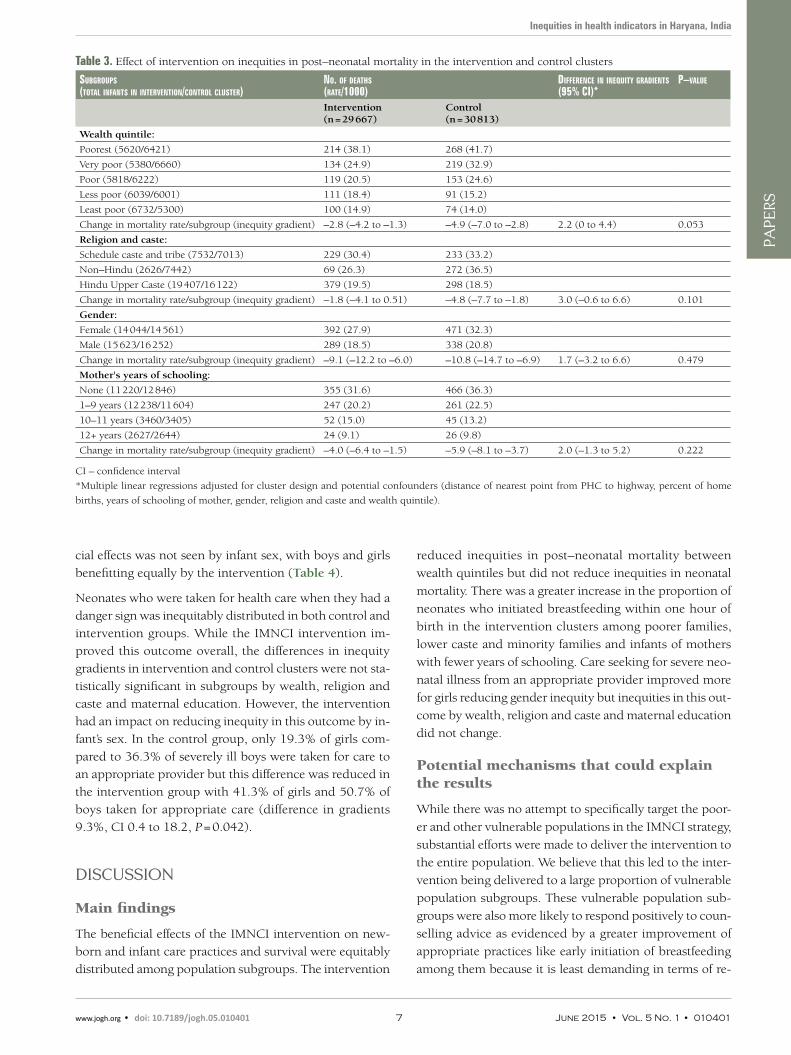
The inequities in post–neonatal infant mortality by wealth status were significantly lower in the intervention as com-pared to control clusters. Post–neonatal mortality was low-er by 4.9 per 1000 per wealth quintile when going from the poorest to the least poor in the control group, but only by 2.8 per 1000 per quintile in the intervention group (ad-justed difference in gradients 2.2 per 1000, 95% confi-dence interval 0 to 4.4 per 1000, P = 0.053). There were similar differences in gradients across subgroups by religion and caste, gender and years of schooling of the mother but these differences were not statistically significant (Table 3).
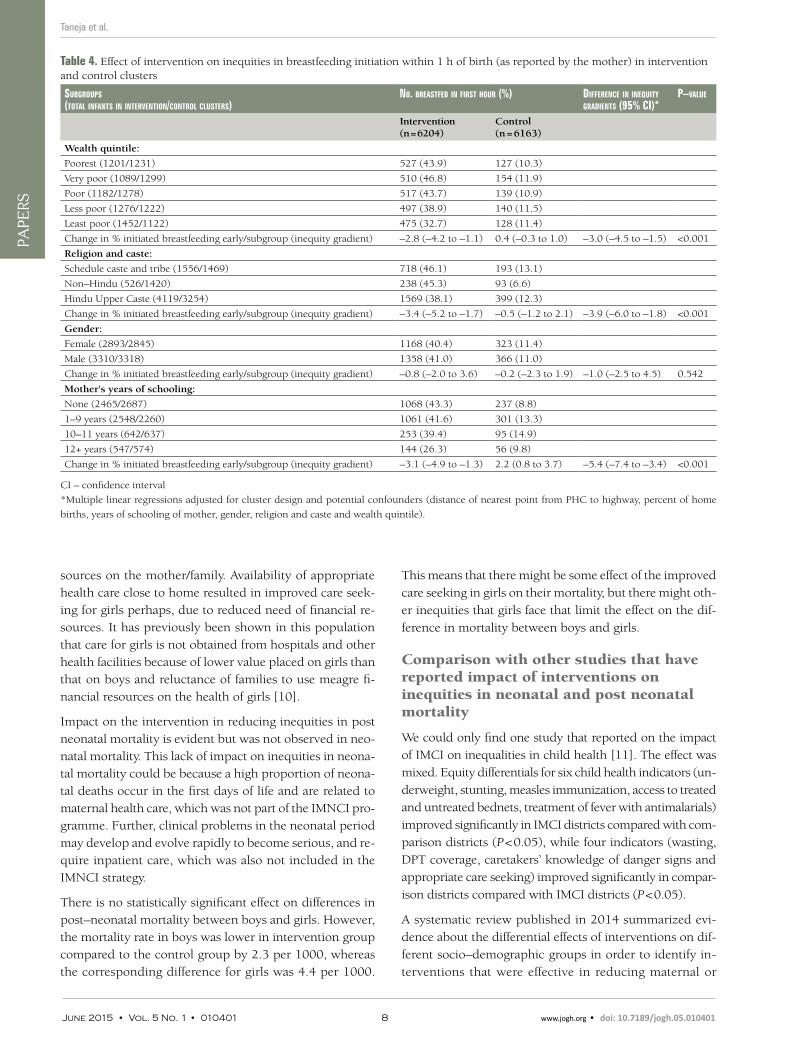
Among all the outcomes examined in this analysis, inequi-ties in the control group were the smallest for the practice of initiating breastfeeding within 1 hour of birth. The IMN-CI intervention substantially increased the prevalence of this practice, and had greater benefit for the more vulner-able population subgroups resulting in inequity gradients that favored infants from poorer families (difference in gra-dients between intervention and control clusters 3.0%, CI 1.5 to 4.5, P < 0.001), lower caste Hindus and non–Hindus (difference in gradients 3.9%, CI 1.8 to 6.0, P < 0.001) and mothers with fewer years of schooling (difference in gradi-ents 5.4%, CI 3.4 to 7.4, P < 0.001). This pattern of benefi-
Inequities in health indicators in Haryana, India
Table 1. Population sub–groups in intervention and control clusters
CharaCteristiCs of families of reCruited infants
intervention Clusters (%)
Control Clusters (%)
Wealth quintiles of household: n = 29 589 n = 30 604
Poorest 5620 (19.0) 6421 (20.9)
Very poor 5380 (18.2) 6660 (21.8)
Poor 5818 (19.7) 6222 (20.3)
Less poor 6039 (20.4) 6001 (19.6)
Least poor 6732 (22.8) 5300 (17.3)
Mother’s education level: n = 29 545 n = 30 499
None 11 220 (38.0) 12 846 (42.1)
1–9 years of schooling 12 238 (41.4) 11 604 (38.1)
10–11 years of schooling 3460 (11.7) 3405 (11.2)
≥12 years of schooling 2627 (8.9) 2644 (8.7)
Sex: n = 29 667 n = 30 813
Male 15 623 (52.7) 16 252 (52.7)
Female 14 044 (47.3) 14 561 (47.3)
Religion/caste: n = 29 565 n = 30 577
Upper caste 19 407 (65.6) 16 122 (52.7)
Schedule caste/schedule tribe 7532 (25.5) 7013 (22.9)
Non–Hindu 2626 (8.9) 7442 (24.3)
www.jogh.org • doi: 10.7189/jogh.05.010401 5 June 2015 • Vol. 5 No. 1 • 010401
VIE
WPO
INTS
PAPE
RSTaneja et al.
Table 2. Effect of intervention on inequities in neonatal mortality in the intervention and control clusters
subgroups(total infants in intervention/Control Clusters)
no. of deaths (nmr/1000)
differenCe in inequity gradient(95% Ci)*
p–value
Intervention (n = 29 667)
Control (n = 30 813)
Wealth quintile:
Poorest (5620/6421) 293 (52.1) 348 (54.2)
Very poor (5380/6660) 248 (46.1) 334 (50.2)
Poor (5818/6222) 252 (43.3) 224 (36.0)
Less poor (6039/6001) 241 (39.9) 218 (36.3)
Least poor (6732/5300) 208 (30.9) 177 (33.4)
Change in NMR/subgroup (inequity gradient) –3.6 (–6.0 to –1.2) –4.1 (–5.9 to –2.3) 0.5 (–2.0 to 2.9) 0.681
Religion and caste:
Hindu scheduled caste/tribe (7532/7013) 352 (46.7) 330 (47.1)
Non–Hindu (2626/7442) 117 (44.6) 322 (43.3)
Hindu Upper Caste (19 407/16 122) 773 (39.8) 648 (40.2)
Change in NMR/subgroup (inequity gradient) –0.2 (–3.6 to 3.3) 0.2 (–3.7 to 4.0) –0.3 (–4.8 to 4.1) 0.872
Gender:
Female (14 044/14 561) 577 (41.1) 614 (42.2)
Male (15 623/16 252) 667 (42.7) 712 (43.8)
Change in NMR/subgroup (inequity gradient) 1.9 (–4.9 to 8.7) 2.0 (–3.1 to 7.2) –0.1 (–8.7 to 8.4) 0.974
Mother's years of schooling:
None (11 220/12 846) 537 (47.9) 626 (48.7)
1–9 years (12 238/11 604) 501 (40.9) 478 (41.2)
10–11 years (3460/3405) 117 (33.8) 127 (37.3)
12+ years (2627/2644) 83 (31.6) 57 (21.6)
Change in NMR/subgroup (inequity gradient) –2.9 (–5.1 to –0.71) –4.8 (–8.2 to –1.4) 1.9 (–1.9 to 5.7) 0.296
NMR – neonatal mortality, CI – confidence interval
*Multiple linear regressions adjusted for cluster design and potential confounders (distance of nearest point from PHC to highway, percent of home
births, and years of schooling of mother, gender, religion and caste and wealth quintile).
Figure 1. Concentration curves for different health outcomes and wealth quintiles. A. Early initiation of breastfeeding. B. Care seeking for danger signs from an appropriate provider. C. Neonatal mortality D. Post–neonatal mortality.
June 2015 • Vol. 5 No. 1 • 010401 6 www.jogh.org • doi: 10.7189/jogh.05.010401
VIE
WPO
INTS
PAPE
RS
Inequities in health indicators in Haryana, India
cial effects was not seen by infant sex, with boys and girls
benefitting equally by the intervention (Table 4).
Neonates who were taken for health care when they had a
danger sign was inequitably distributed in both control and
intervention groups. While the IMNCI intervention im-
proved this outcome overall, the differences in inequity
gradients in intervention and control clusters were not sta-
tistically significant in subgroups by wealth, religion and
caste and maternal education. However, the intervention
had an impact on reducing inequity in this outcome by in-
fant’s sex. In the control group, only 19.3% of girls com-
pared to 36.3% of severely ill boys were taken for care to
an appropriate provider but this difference was reduced in
the intervention group with 41.3% of girls and 50.7% of
boys taken for appropriate care (difference in gradients
9.3%, CI 0.4 to 18.2, P = 0.042).
DISCUSSION
Main findings
The beneficial effects of the IMNCI intervention on new-
born and infant care practices and survival were equitably
distributed among population subgroups. The intervention
reduced inequities in post–neonatal mortality between
wealth quintiles but did not reduce inequities in neonatal
mortality. There was a greater increase in the proportion of
neonates who initiated breastfeeding within one hour of
birth in the intervention clusters among poorer families,
lower caste and minority families and infants of mothers
with fewer years of schooling. Care seeking for severe neo-
natal illness from an appropriate provider improved more
for girls reducing gender inequity but inequities in this out-
come by wealth, religion and caste and maternal education
did not change.
Potential mechanisms that could explain the results
While there was no attempt to specifically target the poor-
er and other vulnerable populations in the IMNCI strategy,
substantial efforts were made to deliver the intervention to
the entire population. We believe that this led to the inter-
vention being delivered to a large proportion of vulnerable
population subgroups. These vulnerable population sub-
groups were also more likely to respond positively to coun-
selling advice as evidenced by a greater improvement of
appropriate practices like early initiation of breastfeeding
among them because it is least demanding in terms of re-
Table 3. Effect of intervention on inequities in post–neonatal mortality in the intervention and control clusters
subgroups(total infants in intervention/Control Cluster)
no. of deaths (rate/1000)
differenCe in inequity gradients(95% Ci)*
p–value
Intervention (n = 29 667)
Control (n = 30 813)
Wealth quintile:
Poorest (5620/6421) 214 (38.1) 268 (41.7)
Very poor (5380/6660) 134 (24.9) 219 (32.9)
Poor (5818/6222) 119 (20.5) 153 (24.6)
Less poor (6039/6001) 111 (18.4) 91 (15.2)
Least poor (6732/5300) 100 (14.9) 74 (14.0)
Change in mortality rate/subgroup (inequity gradient) –2.8 (–4.2 to –1.3) –4.9 (–7.0 to –2.8) 2.2 (0 to 4.4) 0.053
Religion and caste:
Schedule caste and tribe (7532/7013) 229 (30.4) 233 (33.2)
Non–Hindu (2626/7442) 69 (26.3) 272 (36.5)
Hindu Upper Caste (19 407/16 122) 379 (19.5) 298 (18.5)
Change in mortality rate/subgroup (inequity gradient) –1.8 (–4.1 to 0.51) –4.8 (–7.7 to –1.8) 3.0 (–0.6 to 6.6) 0.101
Gender:
Female (14 044/14 561) 392 (27.9) 471 (32.3)
Male (15 623/16 252) 289 (18.5) 338 (20.8)
Change in mortality rate/subgroup (inequity gradient) –9.1 (–12.2 to –6.0) –10.8 (–14.7 to –6.9) 1.7 (–3.2 to 6.6) 0.479
Mother's years of schooling:
None (11 220/12 846) 355 (31.6) 466 (36.3)
1–9 years (12 238/11 604) 247 (20.2) 261 (22.5)
10–11 years (3460/3405) 52 (15.0) 45 (13.2)
12+ years (2627/2644) 24 (9.1) 26 (9.8)
Change in mortality rate/subgroup (inequity gradient) –4.0 (–6.4 to –1.5) –5.9 (–8.1 to –3.7) 2.0 (–1.3 to 5.2) 0.222
CI – confidence interval
*Multiple linear regressions adjusted for cluster design and potential confounders (distance of nearest point from PHC to highway, percent of home
births, years of schooling of mother, gender, religion and caste and wealth quintile).
www.jogh.org • doi: 10.7189/jogh.05.010401 7 June 2015 • Vol. 5 No. 1 • 010401
VIE
WPO
INTS
PAPE
RSTaneja et al.
Table 4. Effect of intervention on inequities in breastfeeding initiation within 1 h of birth (as reported by the mother) in intervention and control clusters
subgroups(total infants in intervention/Control Clusters)
no. breastfed in first hour (%) differenCe in inequity gradients (95% Ci)*
p–value
Intervention (n = 6204)
Control (n = 6163)
Wealth quintile:
Poorest (1201/1231) 527 (43.9) 127 (10.3)
Very poor (1089/1299) 510 (46.8) 154 (11.9)
Poor (1182/1278) 517 (43.7) 139 (10.9)
Less poor (1276/1222) 497 (38.9) 140 (11.5)
Least poor (1452/1122) 475 (32.7) 128 (11.4)
Change in % initiated breastfeeding early/subgroup (inequity gradient) –2.8 (–4.2 to –1.1) 0.4 (–0.3 to 1.0) –3.0 (–4.5 to –1.5) <0.001
Religion and caste:
Schedule caste and tribe (1556/1469) 718 (46.1) 193 (13.1)
Non–Hindu (526/1420) 238 (45.3) 93 (6.6)
Hindu Upper Caste (4119/3254) 1569 (38.1) 399 (12.3)
Change in % initiated breastfeeding early/subgroup (inequity gradient) –3.4 (–5.2 to –1.7) –0.5 (–1.2 to 2.1) –3.9 (–6.0 to –1.8) <0.001
Gender:
Female (2893/2845) 1168 (40.4) 323 (11.4)
Male (3310/3318) 1358 (41.0) 366 (11.0)
Change in % initiated breastfeeding early/subgroup (inequity gradient) –0.8 (–2.0 to 3.6) –0.2 (–2.3 to 1.9) –1.0 (–2.5 to 4.5) 0.542
Mother's years of schooling:
None (2465/2687) 1068 (43.3) 237 (8.8)
1–9 years (2548/2260) 1061 (41.6) 301 (13.3)
10–11 years (642/637) 253 (39.4) 95 (14.9)
12+ years (547/574) 144 (26.3) 56 (9.8)
Change in % initiated breastfeeding early/subgroup (inequity gradient) –3.1 (–4.9 to –1.3) 2.2 (0.8 to 3.7) –5.4 (–7.4 to –3.4) <0.001
CI – confidence interval
*Multiple linear regressions adjusted for cluster design and potential confounders (distance of nearest point from PHC to highway, percent of home
births, years of schooling of mother, gender, religion and caste and wealth quintile).
sources on the mother/family. Availability of appropriate health care close to home resulted in improved care seek-ing for girls perhaps, due to reduced need of financial re-sources. It has previously been shown in this population that care for girls is not obtained from hospitals and other health facilities because of lower value placed on girls than that on boys and reluctance of families to use meagre fi-nancial resources on the health of girls [10].
Impact on the intervention in reducing inequities in post neonatal mortality is evident but was not observed in neo-natal mortality. This lack of impact on inequities in neona-tal mortality could be because a high proportion of neona-tal deaths occur in the first days of life and are related to maternal health care, which was not part of the IMNCI pro-gramme. Further, clinical problems in the neonatal period may develop and evolve rapidly to become serious, and re-quire inpatient care, which was also not included in the IMNCI strategy.
There is no statistically significant effect on differences in post–neonatal mortality between boys and girls. However, the mortality rate in boys was lower in intervention group compared to the control group by 2.3 per 1000, whereas the corresponding difference for girls was 4.4 per 1000.
This means that there might be some effect of the improved care seeking in girls on their mortality, but there might oth-er inequities that girls face that limit the effect on the dif-ference in mortality between boys and girls.
Comparison with other studies that have reported impact of interventions on inequities in neonatal and post neonatal mortality
We could only find one study that reported on the impact of IMCI on inequalities in child health [11]. The effect was mixed. Equity differentials for six child health indicators (un-derweight, stunting, measles immunization, access to treated and untreated bednets, treatment of fever with antimalarials) improved significantly in IMCI districts compared with com-parison districts (P < 0.05), while four indicators (wasting, DPT coverage, caretakers’ knowledge of danger signs and appropriate care seeking) improved significantly in compar-ison districts compared with IMCI districts (P < 0.05).
A systematic review published in 2014 summarized evi-dence about the differential effects of interventions on dif-ferent socio–demographic groups in order to identify in-terventions that were effective in reducing maternal or
June 2015 • Vol. 5 No. 1 • 010401 8 www.jogh.org • doi: 10.7189/jogh.05.010401
VIE
WPO
INTS
PAPE
RS
Inequities in health indicators in Haryana, India
child health inequalities [12]. Eleven of 22 studies includ-ed in the review reported on the infant and under–five mortality rate. These studies covered five kinds of interven-tions: immunization campaigns, nutrition supplement pro-grams, health care provision improvement interventions, demand side interventions, and mixed interventions. The review concluded that the studies on effectiveness of inter-ventions on equity in maternal or child health are limited. The limited evidence showed that the interventions that were effective in reducing inequity included the improve-ment of health care delivery by outreach methods, using human resources in local areas or provided at the commu-nity level nearest to residents and the provision of financial or knowledge support to improve demand side determi-nants [12]. May be vulnerable groups would benefit more if IMNCI incorporated community based treatment for the less severely ill neonates and leaving referral to health fa-cilities for the severely ill. For neonatal mortality, one of the studies included in the above review reported that partici-patory women group intervention can substantial reduce socio–economic inequalities in neonatal mortality [13].
Strengths and weaknesses of this analysis
The IMNCI evaluation study was a cluster randomized ef-fectiveness trial with a large sample size involving about
60 000 births and it was therefore possible to study the ef-fect of the intervention on inequities with reasonable pre-cision. Detailed baseline information was available for all births in intervention and control clusters allowing accu-rate classification into population subgroups by wealth, re-ligion and caste, sex and level of maternal education. There was an independent and similar measurement of outcomes in intervention and control clusters with very low rates of follow up.
There are a couple of weaknesses of this analysis that mer-it consideration. There are inherent weaknesses of a sub-group analysis, but examination of equity is only possible with such an analysis. There were some baseline differenc-es between intervention and control clusters which could have resulted in some differences in inequity gradients be-tween them. However, we adjusted the analysis for the baseline characteristics that showed important differences between intervention and control clusters. Finally, it is dif-ficult to separate the effects of different components of the IMCI package, or the effect of “IMNCI home visits” that were made to promote newborn care practices from home visits without any health intervention. However, making home visits with no health intervention in the control group was not possible in this pragmatic cluster random-ized trial.
Table 5. Effect of intervention on inequities in care–seeking from an appropriate provider for a danger sign during the neonatal period in intervention and control clusters
subgroups (newborns with danger signs in intervention/Control groups) n (%) taken for Care to an appropriate provider differenCe in inequity gradients (95% Ci)*
p–value
Intervention (n = 1010)
Control (n = 1269)
Wealth quintile:
Poorest (185/257) 60 (32.4) 44 (17.1)
Very poor (164/258) 58 (35.4) 47 (18.2)
Poor (187/256) 89 (47.6) 86 (33.6)
Less poor (208/250) 100 (48.1) 91 (36.4)
Least poor (264/246) 165 (62.5) 105 (42.7)
Change in % taken for appropriate care/subgroup (inequity gradient) 4.6 (2.8 to 6.4) 4.0 (2.5 to 5.5) 0.6 (–1.6 to 2.8) 0.554
Religion and caste:
Schedule caste and tribe (254/304) 97 (38.2) 84 (27.6)
Non–Hindu (79/308) 18 (22.8) 38 (12.3)
Hindu Upper Caste (677/653) 359 (53.0) 251 (38.4)
Change in % taken for appropriate care/subgroup (inequity gradient) 3.9 (–0.2 to 7.9) 2.8 (0.1 to 5.4) 1.1 (–3.9 to 6.1) 0.653
Gender:
Female (400/514) 165 (41.3) 99 (19.3)
Male (610/755) 309 (50.7) 275 (36.4)
Change in % taken for appropriate care/subgroup (inequity gradient) 8.3 (1.6 to 15.1) 17.6 (11.4 to 23.8) –9.3 (–18.2 to –0.4) 0.042
Mother's years of schooling:
None (405/555) 156 (38.5) 109 (19.6)
1–9 years (395/447) 188 (47.6) 144 (32.2)
10–11 years (119/157) 67 (56.3) 65 (41.4)
12+ years (91/109) 63 (69.2) 56 (51.4)
Change in % taken for appropriate care/subgroup (inequity gradient) 5.5 (1.5 to 9.4) 6.5 (2.4 to 10.6) –1.0 (–6.5 to 4.4) 0.694
CI – confidence interval*Multiple linear regressions adjusted for cluster design and potential confounders (distance of nearest point from PHC to highway, percent of home births, years of schooling of mother, gender, religion and caste and wealth quintile). Appropriate care provider: Physicians in government and private facilities, auxiliary nurse midwife, Anganwadi worker, or accredited social health activist.
www.jogh.org • doi: 10.7189/jogh.05.010401 9 June 2015 • Vol. 5 No. 1 • 010401
VIE
WPO
INTS
PAPE
RSTaneja et al.
Conclusions and implications of this paper
The IMNCI strategy, as implemented in the trial, promotes equity in post–neonatal mortality, newborn care practices, particularly for early initiation of breastfeeding and health care seeking for severe illness for some of the vulnerable population subgroups. However, substantial inequities
continue to exist despite the intervention and therefore ad-ditional efforts are required for health programs like IMN-CI not only to reach vulnerable populations such as moth-ers and children of families with lower socio–economic status, but also to identify and implement interventions that have a greater effect on reducing inequities.
Disclaimers: The views expressed in the manuscript are authors’ own and not an official position of the insti-tution or the funder.
Acknowledgments: We acknowledge the contributions of Drs Pavitra Mohan, Betty R Kirkwood and Henri Van Den Hombergh who were members of the IMNCI Study Advisory Group.
We thank Drs. Harish Kumar and VK Anand for facilitation of the Integrated Management of Neonatal and Childhood Illness training and providing feedback at different stages.
We acknowledge the members of the Data Safety Monitoring Board; Simon Cousens (Chair), Bert Pelto, and Siddarth Ramji.
We are thankful to the Government of Haryana, the Civil Surgeons of districts Faridabad and Palwal in posi-tion during the study for their cooperation, to the participating health and Integrated Child Development Ser-vices Scheme officers, and workers of the Faridabad district. We acknowledge the cooperation extended by the population of the district who participated in the study.
We are grateful for the core support provided to our organisation by the Department of Maternal, Newborn, Child and Adolescent Health, World Health Organization (Geneva) and the Centre for Intervention Science in Maternal and Child Health (RCN Project No. 223269), Centre for International Health, University of Bergen (Norway).
Funding: World Health Organization, Geneva (through umbrella grant from United States Agency for Inter-national Development); United Nations Children’s Fund, New Delhi, and the Programme for Global Health and Vaccination Research of the Research Council of Norway through Grant No. 183722.
Authorship declaration: All authors conceived and designed this manuscript. Sunita Taneja and Shikhar Bahl conducted the analysis and wrote the first draft of the manuscript. All other authors provided critical inputs to the manuscript.
Competing interests: All authors have completed the Unified Competing Interest form at www.icmje.org/coi_disclosure.pdf (available on request from the corresponding author). The authors declare no competing interests.
RE
FER
EN
CE
S
1 Jacobs M, El–Sadr WM. Health systems and health equity: the challenge of the decade. Glob Public Health. 2012;7:S63-72. Medline:22524240 doi:10.1080/17441692.2012.667426
2 World Health Organization. World Health Statistics, 2014. Available: http://www.who.int/gho/publications/world_health_statistics/2014/en/. Accessed: 22 September 2014.
3 Bhandari N, Bahl R, Mazumder S, Martines J, Black RE, Bhan MK; Infant Feeding Study Group. Effect of im-plementation of Integrated Management of Neonatal and Childhood Illness (IMNCI) programme on neonatal and infant mortality: cluster randomised controlled tri. BMJ. 2012;344:e1634. Medline:22438367 doi:10.1136/bmj.e1634
4 Bhandari N, Bahl R, Mazumder S, Martines J, Black RE, Bhan MK; Infant Feeding Study Group. Effect of com-munity–based promotion of exclusive breastfeeding on diarrhoeal illness and growth: a cluster randomised controlled trial. Lancet. 2003;361:1418-23. Medline:12727395 doi:10.1016/S0140-6736(03)13134-0
5 Bhandari N, Mazumder S, Taneja S, Dube B, Agarwal RC, Mahalanabis D, et al. Effectiveness of zinc supple-mentation plus oral rehydrationsalts compared with oral rehydration salts alone as a treatment for acute diar-rhea in a primary care setting: a cluster randomized trial. Pediatrics. 2008;121:e1279-85. Medline:18450870 doi:10.1542/peds.2007-1939
6 Government of India: Ministry of Health and Family Welfare. Integrated Management of Neonatal and Child-hood Illness: Introduction Module 1. New Delhi: Government of India, 2003.
7 Government of India: Ministry of Health and Family Welfare. IMNCI Training Module for Workers. New Del-hi: Government of India, 2003.
8 Government of India: Ministry of Health and Family Welfare. IMNCI Training Module for Physician. New Delhi: Government of India, 2003.
June 2015 • Vol. 5 No. 1 • 010401 10 www.jogh.org • doi: 10.7189/jogh.05.010401
VIE
WPO
INTS
PAPE
RS
Inequities in health indicators in Haryana, India
RE
FER
EN
CE
S
9 Government of India: Ministry of Health and Family Welfare. National Program Implementation Plan RCH Phase II–Program Document. New Delhi: Government of India, 2005.
10 Bhan G, Bhandari N, Taneja S, Mazumder S, Bahl R; Zinc Study Group. The effect of maternal education on gender bias in care–seeking for common childhood illnesses. Soc Sci Med. 2005;60:715-24. Medline:15571890 doi:10.1016/j.socscimed.2004.06.011
11 Masanja H, Schellenberg JA, de Savigny D, Mshinda H, Victora CG. Impact of integrated management of child-hood illness on inequalities in child health in rural Tanzania. Health Policy Plan. 2005;20:i77-84. Med-line:16306073 doi:10.1093/heapol/czi054
12 Yuan B, Målqvist M, Trygg N, Qian X, Ng N, Thomsen S. What interventions are effective on reducing inequal-ities in maternal and child health in low– and middle–income settings? A systematic review. BMC Public Health. 2014;14:634. Medline:24952656 doi:10.1186/1471-2458-14-634
13 Houweling TA, Tripathy P, Nair N, Rath S, Rath S, Gope R, et al. The equity impact of participatory women's groups to reduce neonatal mortality in India: secondary analysis of a cluster–randomised trial. Int J Epidemi-ol. 2013;42:520-32. Medline:23509239 doi:10.1093/ije/dyt012
www.jogh.org • doi: 10.7189/jogh.05.010401 11 June 2015 • Vol. 5 No. 1 • 010401