© 2009 Eyeblaster. All rights reserved Gen Citro – Sales Engineer EMEA Channel Connect for Search...
25
© 2009 Eyeblaster. All rights reserved © 2009 Eyeblaster. All rights reserved Gen Citro – Sales Engineer EMEA Channel Connect for Search
-
Upload
barnard-farmer -
Category
Documents
-
view
219 -
download
0
Transcript of © 2009 Eyeblaster. All rights reserved Gen Citro – Sales Engineer EMEA Channel Connect for Search...
© 2009 Eyeblaster. All rights reserved
© 2009 Eyeblaster. All rights reserved
Gen Citro – Sales Engineer EMEA
Channel Connect for Search

© 2009 Eyeblaster. All rights reserved
© 2009 Eyeblaster. All rights reserved
Media channel coverageRICH
Plan Traffic Serve Optimise Analyse
STANDARD
EMERGING
SEARCHMOBILE

© 2008 Eyeblaster. All rights reserved
channelconnect
eyeblaster
The Future

© 2008 Eyeblaster. All rights reserved
Unified Reporting
Consolidated Reporting
Gaming &Mobile
Search
Display
One place to view data
© 2009 Eyeblaster. All rights reserved
“What system will allow me to use one on-site tag for de-duped conversions?”
“Is there a system that can show the contribution of rich media to ROI?”
Unifying the data - tagging

© 2009 Eyeblaster. All rights reserved
Unify the data, understand the journeyone tag

© 2009 Eyeblaster. All rights reserved
Conversion Tags – collection of data
• Revenue
• Quantity
• Order ID
• Product ID
• Product info
• Session ID
• Custom fields available
• 3rd party data pass back
• Raw data available

© 2009 Eyeblaster. All rights reserved
Conversion level data
Complete visibility of the path to conversion
AdvertiserEvent timeConversion nameActivity IDOrder IDValueQuantity
Time viewedIs clickPublisher nameCampaign nameKeyword nameAd Group nameFlight IDAd NameUnit sizeVideoRich BannerVideo Starts method
Conversion Data Event Data Roadmap Q1 2010
Path to non-conversionsPath to conversion rates

© 2009 Eyeblaster. All rights reserved
Eyeblaster insights into ROI
Are users who watch the complete video more likely to visit the site?
Does video influence user interaction with the ad to drive conversions?
Are users engaging with interactive elements justifying creative costs?
Which call to action drives more conversions?
How does rich media drive ROI?

© 2009 Eyeblaster. All rights reserved
“Where can I see how my display activity is driving search conversions? “
“How can I see the contribution a publisher makes in the path to conversion?”
“How can I understand user behaviour so I can plan future activity more efficiently?”
Channel Connect for Search

BUY
Understanding the path to conversion
RESEARCH
CLICK
Perceived Path to Conversion
INTERACT
SEE
No matter what journey a user took to convert
you’ll know how they got there
Actual Path to Conversion

© 2009 Eyeblaster. All rights reserved
Channel Connect for Search
• A unique reporting solution for analysing
cross-channel display, search and affiliate
campaigns

© 2009 Eyeblaster. All rights reserved
SEM Independent Solution
Freedom of Choice • Historically Limited Choice
together with Eyeblaster optimisation drive results to your bottom line

© 2009 Eyeblaster. All rights reserved
Cross-Channel Insights
Served Impressions
CTR Other Channel Impact Rate
ROI ROAS ($) Total Conversions
Click to Conversion Rate
Total Revenue ($) Total Profit ($)
249,414 2.86% 60.12% 30.41% 1.30 1,216 17.05% 32,770.00 7,642.00
149,501 2.84% 58.67% 25.60% 1.26 588 13.85% 17,280.00 3,522.00
149,501 2.84% 58.67% 25.60% 1.26 588 13.85% 17,280.00 3,522.00
99,913 2.89% 61.46% 36.24% 1.36 628 21.76% 15,490.00 4,120.00
99,913 2.89% 61.46% 36.24% 1.36 628 21.76% 15,490.00 4,120.00
537,523 0.80% 28.22% 16.25% 1.16 165 3.84% 5,450.00 762.00
266,215 0.79% 29.70% 6.62% 1.07 81 3.83% 2,720.00 169.00
67,931 1.17% 37.88% 2.35% 1.02 14 1.75% 480.00 11.00
50,714 0.47% 15.79% 21.91% 1.22 22 9.32% 740.00 133.00
147,570 0.73% 35.42% 1.69% 1.02 45 4.17% 1,500.00 25.00
271,308 0.80% 26.73% 27.75% 1.28 84 3.85% 2,730.00 593.00
168,906 0.44% 23.72% -15.95% 0.84 24 3.20% 780.00 -148.00
90,302 1.38% 34.68% 72.76% 1.73 48 3.86% 1,560.00 657.00
12,100 1.55% 21.80% 27.45% 1.27 12 6.38% 390.00 84.00
786,937 1.45% 44.17% 28.19% 1.28 1,381 12.09% 38,220.00 8,404.00
4,293
2,113
798
236
1,079
750
1,242
2,180
188Yahoo! UK
AOL Japan
MSN MX
Mind the Gap Int.
Turner / CNN
Fox News.com
MSN \ MSNBC
Display
Mind the Gap US
Campaign Type Campaign Publisher/SE Total Clicks
Search 7,132
Eyeblaster SE - Google 4,246
Google 4,246
Eyeblaster SE - Yahoo 2,886
Yahoo 2,886
Totals 11,425
• Cross-Channel Overview Report
CTR ROI ROAS ($) Total Revenue ($) Total Profit ($)
249,414 2.86% 60.12% 30.41% 1.30 1,216 17.05% 32,770.00 7,642.00
149,501 2.84% 58.67% 25.60% 1.26 588 13.85% 17,280.00 3,522.00
149,501 2.84% 58.67% 25.60% 1.26 588 13.85% 17,280.00 3,522.00
99,913 2.89% 61.46% 36.24% 1.36 628 21.76% 15,490.00 4,120.00
99,913 2.89% 61.46% 36.24% 1.36 628 21.76% 15,490.00 4,120.00
537,523 0.80% 28.22% 16.25% 1.16 165 3.84% 5,450.00 762.00
266,215 0.79% 29.70% 6.62% 1.07 81 3.83% 2,720.00 169.00
67,931 1.17% 37.88% 2.35% 1.02 14 1.75% 480.00 11.00
50,714 0.47% 15.79% 21.91% 1.22 22 9.32% 740.00 133.00
147,570 0.73% 35.42% 1.69% 1.02 45 4.17% 1,500.00 25.00
271,308 0.80% 26.73% 27.75% 1.28 84 3.85% 2,730.00 593.00
168,906 0.44% 23.72% -15.95% 0.84 24 3.20% 780.00 -148.00
90,302 1.38% 34.68% 72.76% 1.73 48 3.86% 1,560.00 657.00
12,100 1.55% 21.80% 27.45% 1.27 12 6.38% 390.00 84.00
786,937 1.45% 44.17% 28.19% 1.28 1,381 12.09% 38,220.00 8,404.00
Display
Campaign Type
Search
Totals
Search and displayall in one place
CTR Other Channel Impact Rate
ROI ROAS ($) Total Revenue ($) Total Profit ($)
249,414 2.86% 60.12% 30.41% 1.30 1,216 17.05% 32,770.00 7,642.00
149,501 2.84% 58.67% 25.60% 1.26 588 13.85% 17,280.00 3,522.00
149,501 2.84% 58.67% 25.60% 1.26 588 13.85% 17,280.00 3,522.00
99,913 2.89% 61.46% 36.24% 1.36 628 21.76% 15,490.00 4,120.00
99,913 2.89% 61.46% 36.24% 1.36 628 21.76% 15,490.00 4,120.00
537,523 0.80% 28.22% 16.25% 1.16 165 3.84% 5,450.00 762.00
266,215 0.79% 29.70% 6.62% 1.07 81 3.83% 2,720.00 169.00
67,931 1.17% 37.88% 2.35% 1.02 14 1.75% 480.00 11.00
50,714 0.47% 15.79% 21.91% 1.22 22 9.32% 740.00 133.00
147,570 0.73% 35.42% 1.69% 1.02 45 4.17% 1,500.00 25.00
271,308 0.80% 26.73% 27.75% 1.28 84 3.85% 2,730.00 593.00
168,906 0.44% 23.72% -15.95% 0.84 24 3.20% 780.00 -148.00
90,302 1.38% 34.68% 72.76% 1.73 48 3.86% 1,560.00 657.00
12,100 1.55% 21.80% 27.45% 1.27 12 6.38% 390.00 84.00
786,937 1.45% 44.17% 28.19% 1.28 1,381 12.09% 38,220.00 8,404.00
Explore the touch-pointsbetween channels
CTR ROI ROAS ($) Total Conversions
Total Revenue ($) Total Profit ($)
249,414 2.86% 60.12% 30.41% 1.30 1,216 17.05% 32,770.00 7,642.00
149,501 2.84% 58.67% 25.60% 1.26 588 13.85% 17,280.00 3,522.00
149,501 2.84% 58.67% 25.60% 1.26 588 13.85% 17,280.00 3,522.00
99,913 2.89% 61.46% 36.24% 1.36 628 21.76% 15,490.00 4,120.00
99,913 2.89% 61.46% 36.24% 1.36 628 21.76% 15,490.00 4,120.00
537,523 0.80% 28.22% 16.25% 1.16 165 3.84% 5,450.00 762.00
266,215 0.79% 29.70% 6.62% 1.07 81 3.83% 2,720.00 169.00
67,931 1.17% 37.88% 2.35% 1.02 14 1.75% 480.00 11.00
50,714 0.47% 15.79% 21.91% 1.22 22 9.32% 740.00 133.00
147,570 0.73% 35.42% 1.69% 1.02 45 4.17% 1,500.00 25.00
271,308 0.80% 26.73% 27.75% 1.28 84 3.85% 2,730.00 593.00
168,906 0.44% 23.72% -15.95% 0.84 24 3.20% 780.00 -148.00
90,302 1.38% 34.68% 72.76% 1.73 48 3.86% 1,560.00 657.00
12,100 1.55% 21.80% 27.45% 1.27 12 6.38% 390.00 84.00
786,937 1.45% 44.17% 28.19% 1.28 1,381 12.09% 38,220.00 8,404.00
“How can I get top level insights into search and display interaction?”

© 2009 Eyeblaster. All rights reserved
AOL Japan CNN Money - Turner
Fox News.com
Google MSN MX MSNBC Yahoo Yahoo! UK - Internal
Marketing
-20.00%
0.00%
20.00%
40.00%
60.00%
80.00%
100.00%
13.29%
1.69%
21.91%
29.33%
-13.36%
2.35%
36.24%
27.45%
ROI - Entire Path vs. Last Ad
Path to Conversion Analysis“How can I see how publishers contribute in the entire path to conversion?”

© 2009 Eyeblaster. All rights reserved
Path to Conversion Analysis
AOL Japan CNN Money - Turner
Fox News.com
Google MSN MX MSNBC Yahoo Yahoo! UK - Internal
Marketing
-20.00%
0.00%
20.00%
40.00%
60.00%
80.00%
100.00%
61.57%
91.80%
54.70%
16.91%
65.09%67.59%
24.78%
31.37%
13.29%
1.69%
21.91%
29.33%
-13.36%
2.35%
36.24%
27.45%
ROI - Entire Path vs. Last AdROI (Entire Path)
ROI (Last Ad)
• Path to Conversion by Publisher Report

© 2009 Eyeblaster. All rights reserved
Path to Conversion Analysis
Ad 4 Total Clicks CTR Percentage of Total Paths
Total Conversions
Total Revenue ($) Percentage of Total Revenue
Average time to Convert (Days)
Average Path Length
4,078 62.22% 69.32% 2,129 154,836.96 57.67% 10.59 2.53
406 1.69% 8.86% 272 20,975.34 7.81% 14.00 2.00
908 8.57% 6.35% 195 24,491.63 9.12% 7.00 1.00
Display 1,377 6.73% 0.13% 4 577.36 0.22% 10.00 4.00
Search 1,080 12.01% 0.13% 4 127.59 0.05% 10.00 4.00
Display 789 6.75% 0.10% 3 389.31 0.15% 9.00 4.00
Display 1,645 5.63% 0.10% 3 41.21 0.02% 19.00 4.00
Search 1,567 5.47% 0.07% 2 81.97 0.03% 7.00 3.00
Search 536 2.53% 0.03% 1 73.95 0.03% 4.00 4.00
Search 1,021 13.28% 0.00% 0 0.00 0.00% 26.00 4.00
6,482 8.07% 15.18% 466 55,751.64 20.77% 6.92 1.98
1,073 4.56% 6.55% 201 25,688.91 9.57% 5.00 2.00
1,270 6.61% 4.62% 142 16,204.92 6.04% 1.00 1.00
1,881 11.16% 3.71% 114 13,193.34 4.91% 10.00 3.00
Display 1,922 24.10% 0.23% 7 532.14 0.20% 24.00 4.00
Display 336 2.63% 0.07% 2 132.33 0.05% 27.00 5.00
2,206 2.93% 15.50% 476 57,890.47 21.56% 8.53 1.98
364 4.26% 7.39% 227 30,859.82 11.49% 4.00 2.00
127 1.29% 4.62% 142 19,067.39 7.10% 1.00 1.00
530 1.58% 2.77% 85 7,220.56 2.69% 18.00 3.00
Search 1,046 10.52% 0.59% 18 719.97 0.27% 4.00 4.00
Search 139 1.04% 0.13% 4 22.73 0.01% 26.00 5.00
Search
Search
Search
Display
Display
Display
Search
Search Search 8,553
Search Only 75,244
80,357
Display 23,537Display
Display Search Search 23,983
Both 6,554
Exposure Group Ad1 (First Viewed)
Ad 2 Ad 3 Ad 5 Served Impressions
10,589
Display
Display Only
Search
Search
Display
Display
Search
Display
Search
Display
Display
Search
Display
Search
Search
Search
Display
Display
Search
Display
Search
Display
Display
Display
Search
Search
Display
Display
Display
Display
Display Display
Display
Display
Search 9,867
Search Search Search 33,452
Search Search Search 9,943
Search Search Search Search 13,429
20,468
19,203
16,862
7,974
12,781
8,994
11,682
29,236
28,656
21,226
7,691
Ad 4 Total Clicks CTR Total Revenue ($) Average Path Length
4,078 62.22% 69.32% 2,129 154,836.96 57.67% 10.59 2.53
406 1.69% 8.86% 272 20,975.34 7.81% 14.00 2.00
908 8.57% 6.35% 195 24,491.63 9.12% 7.00 1.00
Display 1,377 6.73% 0.13% 4 577.36 0.22% 10.00 4.00
Search 1,080 12.01% 0.13% 4 127.59 0.05% 10.00 4.00
Display 789 6.75% 0.10% 3 389.31 0.15% 9.00 4.00
Display 1,645 5.63% 0.10% 3 41.21 0.02% 19.00 4.00
Search 1,567 5.47% 0.07% 2 81.97 0.03% 7.00 3.00
Search 536 2.53% 0.03% 1 73.95 0.03% 4.00 4.00
Search 1,021 13.28% 0.00% 0 0.00 0.00% 26.00 4.00
6,482 8.07% 15.18% 466 55,751.64 20.77% 6.92 1.98
1,073 4.56% 6.55% 201 25,688.91 9.57% 5.00 2.00
1,270 6.61% 4.62% 142 16,204.92 6.04% 1.00 1.00
1,881 11.16% 3.71% 114 13,193.34 4.91% 10.00 3.00
Display 1,922 24.10% 0.23% 7 532.14 0.20% 24.00 4.00
Display 336 2.63% 0.07% 2 132.33 0.05% 27.00 5.00
2,206 2.93% 15.50% 476 57,890.47 21.56% 8.53 1.98
364 4.26% 7.39% 227 30,859.82 11.49% 4.00 2.00
127 1.29% 4.62% 142 19,067.39 7.10% 1.00 1.00
530 1.58% 2.77% 85 7,220.56 2.69% 18.00 3.00
Search 1,046 10.52% 0.59% 18 719.97 0.27% 4.00 4.00
Search 139 1.04% 0.13% 4 22.73 0.01% 26.00 5.00
Search
Search Only
Display
Display
Both
Exposure Group Ad1 (First Viewed)
Display Only
Display
Display
Search
Display
Search
Display
Display
Display
Search
Search
Display
Display
Search
Search
Search
Search
Determine cross-channel synergiesUnderstand user behavior through the most common paths
Ad 4 Total Clicks CTR Percentage of Total Paths
Total Conversions
Total Revenue ($) Percentage of Total Revenue
Average time to Convert (Days)
Average Path Length
4,078 62.22% 69.32% 2,129 154,836.96 57.67% 10.59 2.53
406 1.69% 8.86% 272 20,975.34 7.81% 14.00 2.00
908 8.57% 6.35% 195 24,491.63 9.12% 7.00 1.00
Display 1,377 6.73% 0.13% 4 577.36 0.22% 10.00 4.00
Search 1,080 12.01% 0.13% 4 127.59 0.05% 10.00 4.00
Display 789 6.75% 0.10% 3 389.31 0.15% 9.00 4.00
Display 1,645 5.63% 0.10% 3 41.21 0.02% 19.00 4.00
Search 1,567 5.47% 0.07% 2 81.97 0.03% 7.00 3.00
Search 536 2.53% 0.03% 1 73.95 0.03% 4.00 4.00
Search 1,021 13.28% 0.00% 0 0.00 0.00% 26.00 4.00
6,482 8.07% 15.18% 466 55,751.64 20.77% 6.92 1.98
1,073 4.56% 6.55% 201 25,688.91 9.57% 5.00 2.00
1,270 6.61% 4.62% 142 16,204.92 6.04% 1.00 1.00
1,881 11.16% 3.71% 114 13,193.34 4.91% 10.00 3.00
Display 1,922 24.10% 0.23% 7 532.14 0.20% 24.00 4.00
Display 336 2.63% 0.07% 2 132.33 0.05% 27.00 5.00
2,206 2.93% 15.50% 476 57,890.47 21.56% 8.53 1.98
364 4.26% 7.39% 227 30,859.82 11.49% 4.00 2.00
127 1.29% 4.62% 142 19,067.39 7.10% 1.00 1.00
530 1.58% 2.77% 85 7,220.56 2.69% 18.00 3.00
Search 1,046 10.52% 0.59% 18 719.97 0.27% 4.00 4.00
Search 139 1.04% 0.13% 4 22.73 0.01% 26.00 5.00
Ad 4 Total Clicks CTR Percentage of Total Paths
Total Revenue ($) Average Path Length
4,078 62.22% 69.32% 2,129 154,836.96 57.67% 10.59 2.53
406 1.69% 8.86% 272 20,975.34 7.81% 14.00 2.00
908 8.57% 6.35% 195 24,491.63 9.12% 7.00 1.00
Display 1,377 6.73% 0.13% 4 577.36 0.22% 10.00 4.00
Search 1,080 12.01% 0.13% 4 127.59 0.05% 10.00 4.00
Display 789 6.75% 0.10% 3 389.31 0.15% 9.00 4.00
Display 1,645 5.63% 0.10% 3 41.21 0.02% 19.00 4.00
Search 1,567 5.47% 0.07% 2 81.97 0.03% 7.00 3.00
Search 536 2.53% 0.03% 1 73.95 0.03% 4.00 4.00
Search 1,021 13.28% 0.00% 0 0.00 0.00% 26.00 4.00
6,482 8.07% 15.18% 466 55,751.64 20.77% 6.92 1.98
1,073 4.56% 6.55% 201 25,688.91 9.57% 5.00 2.00
1,270 6.61% 4.62% 142 16,204.92 6.04% 1.00 1.00
1,881 11.16% 3.71% 114 13,193.34 4.91% 10.00 3.00
Display 1,922 24.10% 0.23% 7 532.14 0.20% 24.00 4.00
Display 336 2.63% 0.07% 2 132.33 0.05% 27.00 5.00
2,206 2.93% 15.50% 476 57,890.47 21.56% 8.53 1.98
364 4.26% 7.39% 227 30,859.82 11.49% 4.00 2.00
127 1.29% 4.62% 142 19,067.39 7.10% 1.00 1.00
530 1.58% 2.77% 85 7,220.56 2.69% 18.00 3.00
Search 1,046 10.52% 0.59% 18 719.97 0.27% 4.00 4.00
Search 139 1.04% 0.13% 4 22.73 0.01% 26.00 5.00
Ad 4 Total Clicks CTR Total Revenue ($) Average Path Length
4,078 62.22% 69.32% 2,129 154,836.96 57.67% 10.59 2.53
406 1.69% 8.86% 272 20,975.34 7.81% 14.00 2.00
908 8.57% 6.35% 195 24,491.63 9.12% 7.00 1.00
Display 1,377 6.73% 0.13% 4 577.36 0.22% 10.00 4.00
Search 1,080 12.01% 0.13% 4 127.59 0.05% 10.00 4.00
Display 789 6.75% 0.10% 3 389.31 0.15% 9.00 4.00
Display 1,645 5.63% 0.10% 3 41.21 0.02% 19.00 4.00
Search 1,567 5.47% 0.07% 2 81.97 0.03% 7.00 3.00
Search 536 2.53% 0.03% 1 73.95 0.03% 4.00 4.00
Search 1,021 13.28% 0.00% 0 0.00 0.00% 26.00 4.00
6,482 8.07% 15.18% 466 55,751.64 20.77% 6.92 1.98
1,073 4.56% 6.55% 201 25,688.91 9.57% 5.00 2.00
1,270 6.61% 4.62% 142 16,204.92 6.04% 1.00 1.00
1,881 11.16% 3.71% 114 13,193.34 4.91% 10.00 3.00
Display 1,922 24.10% 0.23% 7 532.14 0.20% 24.00 4.00
Display 336 2.63% 0.07% 2 132.33 0.05% 27.00 5.00
2,206 2.93% 15.50% 476 57,890.47 21.56% 8.53 1.98
364 4.26% 7.39% 227 30,859.82 11.49% 4.00 2.00
127 1.29% 4.62% 142 19,067.39 7.10% 1.00 1.00
530 1.58% 2.77% 85 7,220.56 2.69% 18.00 3.00
Search 1,046 10.52% 0.59% 18 719.97 0.27% 4.00 4.00
Search 139 1.04% 0.13% 4 22.73 0.01% 26.00 5.00
Search
Search
Search
Display
Display
Display
Search
Search Search
Search Only
Display Display
Display Search Search
Both
Exposure Group Ad1 (First Viewed)
Ad 2 Ad 3 Ad 5
Display
Display Only
Search
Search
Display
Display
Search
Display
Search
Display
Display
Search
Display
Search
Search
Search
Display
Display
Search
Display
Search
Display
Display
Display
Search
Search
Display
Display
Display
Display
Display Display
Display
Display
Search
Search Search Search
Search Search Search
Search Search Search Search
• Path to Conversion by Channel Report
“How can I understand user behavior in the path to conversion?”
© 2009 Eyeblaster. All rights reserved
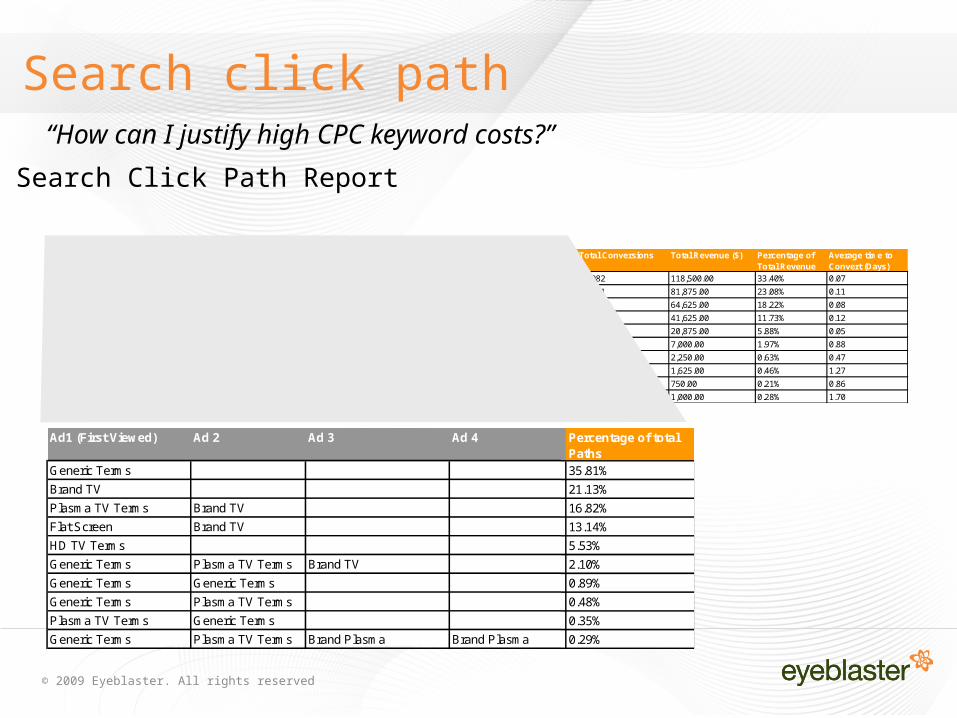
Search click path“How can I justify high CPC keyword costs?”
Ad 5 Percentage of total Paths
Total Conversions Total Revenue ($) Percentage of Total Revenue
Average time to Convert (Days)
35.81% 17,982 118,500.00 33.40% 0.07
21.13% 10,611 81,875.00 23.08% 0.11
16.82% 8,448 64,625.00 18.22% 0.08
13.14% 6,600 41,625.00 11.73% 0.12
5.53% 2,776 20,875.00 5.88% 0.05
2.10% 1,054 7,000.00 1.97% 0.88
0.89% 447 2,250.00 0.63% 0.47
0.48% 239 1,625.00 0.46% 1.27
0.35% 175 750.00 0.21% 0.86
0.29% 146 1,000.00 0.28% 1.70
Plasma TV Terms Generic Terms
Generic Terms Plasma TV Terms Brand Plasma Brand Plasma
Generic Terms Generic Terms
Generic Terms Plasma TV Terms
HD TV Terms
Generic Terms Plasma TV Terms Brand TV
Plasma TV Terms Brand TV
Flat Screen Brand TV
Brand TV
Ad1 (First Viewed) Ad 2 Ad 3 Ad 4
Generic Terms
Ad 5 Total Conversions Total Revenue ($)
35.81% 17,982 118,500.00 33.40% 0.07
21.13% 10,611 81,875.00 23.08% 0.11
16.82% 8,448 64,625.00 18.22% 0.08
13.14% 6,600 41,625.00 11.73% 0.12
5.53% 2,776 20,875.00 5.88% 0.05
2.10% 1,054 7,000.00 1.97% 0.88
0.89% 447 2,250.00 0.63% 0.47
0.48% 239 1,625.00 0.46% 1.27
0.35% 175 750.00 0.21% 0.86
0.29% 146 1,000.00 0.28% 1.70
Plasma TV Terms Generic Terms
Generic Terms Plasma TV Terms Brand Plasma Brand Plasma
Generic Terms Generic Terms
Generic Terms Plasma TV Terms
HD TV Terms
Generic Terms Plasma TV Terms Brand TV
Plasma TV Terms Brand TV
Flat Screen Brand TV
Brand TV
Ad1 (First Viewed) Ad 2 Ad 3 Ad 4
Generic Terms
Ad 5 Percentage of total Paths
Total Conversions Total Revenue ($)
35.81% 17,982 118,500.00 33.40% 0.07
21.13% 10,611 81,875.00 23.08% 0.11
16.82% 8,448 64,625.00 18.22% 0.08
13.14% 6,600 41,625.00 11.73% 0.12
5.53% 2,776 20,875.00 5.88% 0.05
2.10% 1,054 7,000.00 1.97% 0.88
0.89% 447 2,250.00 0.63% 0.47
0.48% 239 1,625.00 0.46% 1.27
0.35% 175 750.00 0.21% 0.86
0.29% 146 1,000.00 0.28% 1.70
• Search Click Path Report

© 2009 Eyeblaster. All rights reserved
Advertiser Name
eventtime Activity Id Activity Name
quantity orderid session Value Query String
Last Ad View Time
Is Click Publisher Campaign Ad Group Keyword Name Eyeblaster Name
Unit Size Video Rich Banner
Video Starts Method
Flight ID
LG 8/4/08 10:01AM
14449 Thank You Page
1 123 200 ActivityID=14449&f=1&f=1&rnd=913277.05886215
8/4/08 10:00AM
1 CNET Campaign1 Ad 160x600-V1
160x600 1 0 AutoInitiated 539630
LG 8/4/08 10:20AM
14449 Thank You Page
1 234 200 ActivityID=14449&f=1&f=1&rnd=407930.503599346
8/4/08 10:01AM
1 Forbes Campaign2 Ad 160x600-V2
160x600 1 0 AutoInitiated 539639
LG 8/4/08 11:02AM
14449 Thank You Page
1 456 200 ActivityID=14449&f=1&f=1&rnd=746609.077788889
8/4/08 10:42AM
1 Google Search Campaign3
Brand TV
Keyword TV
LG 8/4/08 11:59AM
14449 Thank You Page
1 567 450 ActivityID=14449&f=1&f=1&rnd=948163.21413964
8/4/08 11:50AM
1 CNET Campaign1 Ad 250x250-V1
250x249 1 AutoInitiated 540720
Event 1 Event 2 Event 3 Event 4 Event 5
Display path“Does rich media help drive conversions later in the path?”
• Advanced Display Report

© 2009 Eyeblaster. All rights reserved
Conversion attribution modelling Roadmap Q1 2010
Assigning value to the events in the path to conversion
• Weight of sequence in the path (1 – 10)
• Weight of event latency – four cookie windows
• Weight of event engagement – imp., dwell time, click

© 2009 Eyeblaster. All rights reserved
ImplementationEasy set-up process – a two step wizard!

© 2008 Eyeblaster. All rights reserved
Results: Of the votes attributed to Search Advertising, 30% were driven by rich media display ads
Where a vote was driven by a combination of search and display, on 95% of those occasions, it began with a display event and ended with a Search.
Masterfood - Revels Eviction Campaign
Campaign ID:• Advertiser: Masterfoods: Revels Eviction• Agency: MediaCom• Publishers: MSN UK, Yahoo UK, News International• Channels: Rich media display ads, Search and TV campaigns
StrategyPlay on the idea that everyone has an opinion on their favorite/least favorite flavorEnabled consumers to ‘evict’ the Revels flavor they would like to
Campaign Objectives :• Create a unique way for Revels to engage with customers• Effectively integrate TV, press and digital campaigns to drive
consumers to the Revels Eviction microsite

© 2009 Eyeblaster. All rights reserved
Eyeblaster insights into ROI
Cross publisher overlapWhat is the overlap of users across my media buy?Which publishers provide best value for money?How many unique users are seeing my campaigns?
Performance by frequencyHow often did users see my ad?How does frequency correspond to my KPI?How should I cap impressions per user to generate maximum ROI?
Conversion path analysisHow do I analyse the impact of my cross media campaigns? What system will allow me to see the contribution of publishers to the total conversions I make?How can I quickly and easily understand the most profitable user paths to conversion?
Time to conversionHow long do users take to convert after being exposed to my ads?Has my branding campaign driven long term conversions?

© 2009 Eyeblaster. All rights reserved
Channel Connect for Search summary
• SEM independent solution
• Cross-channel insights
• Path to conversion analysis
• Conversion attribution modelling
• Conversion level reporting
• Two step wizard set up - no retrafficking

© 2009 Eyeblaster. All rights reserved
Thank you


![DPE RHO Visual Assessment Report 170614 - Amazon S3...J=CKFQR@A Eb`a Eb`a ni Ji\]lXn] Ji\]lXn] Ji\]lXn] ni IiqIiq K]`eb`bZe] Eb`a Eb`a bgjX[n Eb`a FgjX[n Ji\]lXn] Eb`a Ji\]lXn] Eb`a](https://static.fdocuments.in/doc/165x107/6127f826dfe2eb21db79cba4/dpe-rho-visual-assessment-report-170614-amazon-s3-jckfqra-eba-eba-ni-jilxn.jpg)