© 2009 American Chemical Society ...rcorn/reprints/RMC119.pdfprotein-protein interactions. Most...
7
pubs.acs.org/Langmuir Fabrication of DNA Microarrays with Poly(L-glutamic acid) Monolayers on Gold Substrates for SPR Imaging Measurements Yulin Chen, Anh Nguyen, Lifang Niu, and Robert M. Corn* Department of Chemistry, University of California;Irvine, Irvine, California 92697 Received December 7, 2008. Revised Manuscript Received January 27, 2009 Robust single-stranded DNA (ssDNA) microarrays are created by attaching amine-modified oligonucleotides to a monolayer of poly(L-glutamic acid) (pGlu) that is electrostatically adsorbed onto a chemically modified gold thin film. This surface attachment chemistry methodology is first characterized with a combination of polarization-modulation Fourier transform infrared (PM-FTIR) spectroscopy and surface plasmon resonance (SPR) angle shift measurements. SPR imaging (SPRI) measurements of these ssDNA microarrays are then used to study two surface bioaffinity interactions: (i) the quantitative hybridization adsorption of complementary ssDNA onto mixed ssDNA microarray elements and (ii) the adsorption of single-stranded binding protein (SSB) onto fully and partially hybridized DNA microarray elements. The Langmuir adsorption coefficient (K Ads ) of SSB binding to ssDNA was determined to be (5.5 ( 0.4) 10 9 M -1 . I. Introduction DNA microarrays have become a mainstay for nucleic acid bioaffinity sensing measurements, with applications to a variety of biotechnological applications such as DNA diag- nostics and detection, 1 gene expression analysis, 2 single nucleotide polymorphism (SNP) genotyping, 3 and micro- RNA profiling. 4 These arrays are used primarily for the detection and identification of cDNA or RNA by sequence- specific adsorption onto an array element consisting of single- stranded DNA (ssDNA) or RNA oligonucleotides that are chemically attached to the surface. It is assumed that the sequence specificity of the adsorption is due to the hybridiza- tion of the solution nucleic acids with the surface-bound oligonucleotides; this process is termed “hybridization adsorption”. Although the vast majority of DNA microarray experi- ments detect the hybridization adsorption of fluorescently labeled DNA onto glass surfaces with fluorescence imaging, an increasingly popular alternative method is to detect the hybridization adsorption of unlabeled DNA or RNA onto chemically modified gold thin films with the optical tech- nique of surface plasmon resonance imaging (SPRI). 5,6 SPRI has been used to quantitatively detect not only unlabeled DNA and RNA but also the adsorption of unlabeled proteins such as transcription factors onto DNA microarrays. 7 Recent SPRI biosensing applications of DNA microarrays are becoming increasingly complex, often augmenting a hybridization adsorption event with a second surface enzy- matic reaction to further process the adsorbed DNA and yield additional information. 8 For example, SPRI measurements of SNP genotyping have been performed with DNA microarrays by using a surface ligation reaction after hybridization adsorption to detect and identify a single nucleotide in an adsorbed DNA strand. 9 In all of these applications, it is essential to have a robust, noninterfering DNA attachment chemistry for the SPRI measurements on gold thin films. The microarray surface chemistry controls the accessibility and reactivity of the attached oligonucleotides for both hybridization adsorption and surface enzymatic processing. Moreover, the surface chemistry must control the specific and nonspecific adsorp- tion of proteins and enzymes onto the array elements during the biosensing process. A variety of attachment chemistries on gold surfaces have been explored for the creation of “robust” DNA microarrays for SPRI; a common attachment strategy is the direct adsorption of a thiol-modified oligonucleotide onto the gold surface. 10,11 While this method is important for electrochemical detection methods that require the DNA to be close to the metal-electrolyte interface, SPRI measure- ments can sense hybridization adsorption within 200 nm of the gold surface. Thus, attachment schemes that tether sur- face-bound “probe” oligonucleotides farther away from the surface can be used to obtain better hybridization adsorption performance. DNA microarrays on gold surfaces have also been created by attaching biotin-modified ssDNA to biotin- terminated alkanethiols via noncovalent biotin-streptavidin interactions. 12,13 Surface attachment chemistries that use a protein such as streptavidin are potentially subject to addi- tional nonspecific adsorption of proteins from solution via *Corresponding author. E-mail: [email protected]. (1) Kimmel, A.; Oliver, B. Methods in Enzymology: DNA Microarrays Part A: Array Platforms and Wet-Bench Protocols; Academic Press: New York, 2006; Vol. 410. (2) Schena, M.; Shalon, D.; Davis, R. W.; Brown, P. O. Science 1995, 270, 467–470. (3) Fan, J. B.; Chen, X. Q.; Halushka, M. K.; Berno, A.; Huang, X. H.; Ryder, T.; Lipshutz, R. J.; Lockhart, D. J.; Chakravarti, A. Genome Res. 2000, 10, 853–860. (4) Wark, A. W.; Lee, H. J.; Corn, R. M. Angew. Chem., Int. Ed. 2008, 47, 644–652. (5) Nelson, B. P.; Grimsrud, T. E.; Liles, M. R.; Goodman, R. M.; Corn, R. M. Anal. Chem. 2001, 73, 1–7. (6) Smith, E. A.; Corn, R. M. Appl. Spectrosc. 2003, 57, 320A–332A. (7) Smith, E. A.; Erickson, M. G.; Ulijasz, A. T.; Weisblum, B.; Corn, R. M. Langmuir 2003, 19, 1486–1492. (8) Lee, H. J.; Wark, A. W.; Corn, R. M. Langmuir 2006, 22, 5241–5250. (9) Goodrich, T. T.; Lee, H. J.; Corn, R. M. J. Am. Chem. Soc. 2004, 126, 4086–4087. (10) Herne, T. M.; Tarlov, M. J. J. Am. Chem. Soc. 1997, 119, 8916–8920. (11) Peterlinz, K. A.; Georgiadis, R. M.; Herne, T. M.; Tarlov, M. J. J. Am. Chem. Soc. 1997, 119, 3401–3402. (12) Zizlsperger, M.; Knoll, W. Prog. Colloid Polym. Sci. 1998, 109, 244–253. (13) Shumaker-Parry, J. S.; Zareie, M. H.; Aebersold, R.; Campbell, C. T. Anal. Chem. 2004, 76, 918–929. Published on Web 3/2/2009 © 2009 American Chemical Society DOI: 10.1021/la804021t Langmuir 2009, 25(9), 5054–5060 5054
Transcript of © 2009 American Chemical Society ...rcorn/reprints/RMC119.pdfprotein-protein interactions. Most...
pubs.acs.org/Langmuir
Fabrication of DNAMicroarrays with Poly(L-glutamic acid) Monolayers onGold Substrates for SPR Imaging Measurements
Yulin Chen, Anh Nguyen, Lifang Niu, and Robert M. Corn*
Department of Chemistry, University of California;Irvine, Irvine, California 92697
Received December 7, 2008. Revised Manuscript Received January 27, 2009
Robust single-strandedDNA (ssDNA)microarrays are created by attaching amine-modified oligonucleotidesto amonolayer of poly(L-glutamic acid) (pGlu) that is electrostatically adsorbed onto a chemically modified goldthin film. This surface attachment chemistry methodology is first characterized with a combination ofpolarization-modulation Fourier transform infrared (PM-FTIR) spectroscopy and surface plasmon resonance(SPR) angle shift measurements. SPR imaging (SPRI) measurements of these ssDNAmicroarrays are then usedto study two surface bioaffinity interactions: (i) the quantitative hybridization adsorption of complementaryssDNAontomixed ssDNAmicroarray elements and (ii) the adsorption of single-stranded binding protein (SSB)onto fully and partially hybridized DNA microarray elements. The Langmuir adsorption coefficient (KAds) ofSSB binding to ssDNA was determined to be (5.5 ( 0.4) ! 109 M-1.
I. Introduction
DNAmicroarrays have become amainstay for nucleic acidbioaffinity sensing measurements, with applications to avariety of biotechnological applications such as DNA diag-nostics and detection,1 gene expression analysis,2 singlenucleotide polymorphism (SNP) genotyping,3 and micro-RNA profiling.4 These arrays are used primarily for thedetection and identification of cDNA or RNA by sequence-specific adsorption onto an array element consisting of single-stranded DNA (ssDNA) or RNA oligonucleotides that arechemically attached to the surface. It is assumed that thesequence specificity of the adsorption is due to the hybridiza-tion of the solution nucleic acids with the surface-boundoligonucleotides; this process is termed “hybridizationadsorption”.
Although the vast majority of DNA microarray experi-ments detect the hybridization adsorption of fluorescentlylabeled DNA onto glass surfaces with fluorescence imaging,an increasingly popular alternative method is to detect thehybridization adsorption of unlabeled DNA or RNA ontochemically modified gold thin films with the optical tech-nique of surface plasmon resonance imaging (SPRI).5,6 SPRIhas been used to quantitatively detect not only unlabeledDNA andRNAbut also the adsorption of unlabeled proteinssuch as transcription factors onto DNA microarrays.7
Recent SPRI biosensing applications of DNA microarraysare becoming increasingly complex, often augmenting a
hybridization adsorption event with a second surface enzy-matic reaction to further process the adsorbedDNAand yieldadditional information.8 For example, SPRImeasurements ofSNPgenotypinghave beenperformedwithDNAmicroarraysby using a surface ligation reaction after hybridizationadsorption to detect and identify a single nucleotide in anadsorbed DNA strand.9
In all of these applications, it is essential to have a robust,noninterfering DNA attachment chemistry for the SPRImeasurements on gold thin films. The microarray surfacechemistry controls the accessibility and reactivity of theattached oligonucleotides for both hybridization adsorptionand surface enzymatic processing. Moreover, the surfacechemistry must control the specific and nonspecific adsorp-tion of proteins and enzymes onto the array elements duringthe biosensing process. A variety of attachment chemistries ongold surfaces have been explored for the creation of “robust”DNAmicroarrays for SPRI; a commonattachment strategy isthe direct adsorption of a thiol-modified oligonucleotide ontothe gold surface.10,11 While this method is important forelectrochemical detection methods that require the DNA tobe close to the metal-electrolyte interface, SPRI measure-ments can sense hybridization adsorption within 200 nm ofthe gold surface. Thus, attachment schemes that tether sur-face-bound “probe” oligonucleotides farther away from thesurface can be used to obtain better hybridization adsorptionperformance. DNA microarrays on gold surfaces have alsobeen created by attaching biotin-modified ssDNA to biotin-terminated alkanethiols via noncovalent biotin-streptavidininteractions.12,13 Surface attachment chemistries that use aprotein such as streptavidin are potentially subject to addi-tional nonspecific adsorption of proteins from solution via
*Corresponding author. E-mail: [email protected].(1) Kimmel, A.; Oliver, B. Methods in Enzymology: DNA Microarrays
Part A: Array Platforms and Wet-Bench Protocols; Academic Press: NewYork, 2006; Vol. 410.
(2) Schena, M.; Shalon, D.; Davis, R.W.; Brown, P. O. Science 1995, 270,467–470.
(3) Fan, J. B.; Chen, X. Q.; Halushka, M. K.; Berno, A.; Huang, X. H.;Ryder, T.; Lipshutz, R. J.; Lockhart, D. J.; Chakravarti, A. Genome Res.2000, 10, 853–860.
(4) Wark, A. W.; Lee, H. J.; Corn, R.M. Angew. Chem., Int. Ed. 2008, 47,644–652.
(5) Nelson, B. P.; Grimsrud, T. E.; Liles, M. R.; Goodman, R. M.; Corn,R. M. Anal. Chem. 2001, 73, 1–7.
(6) Smith, E. A.; Corn, R. M. Appl. Spectrosc. 2003, 57, 320A–332A.(7) Smith, E. A.; Erickson, M. G.; Ulijasz, A. T.; Weisblum, B.; Corn, R.
M. Langmuir 2003, 19, 1486–1492.
(8) Lee, H. J.; Wark, A. W.; Corn, R. M. Langmuir 2006, 22, 5241–5250.(9) Goodrich, T. T.; Lee, H. J.; Corn, R. M. J. Am. Chem. Soc. 2004, 126,
4086–4087.(10) Herne, T. M.; Tarlov, M. J. J. Am. Chem. Soc. 1997, 119, 8916–8920.(11) Peterlinz, K. A.; Georgiadis, R. M.; Herne, T. M.; Tarlov, M. J. J.
Am. Chem. Soc. 1997, 119, 3401–3402.(12) Zizlsperger, M.; Knoll, W. Prog. Colloid Polym. Sci. 1998, 109,
244–253.(13) Shumaker-Parry, J. S.; Zareie, M. H.; Aebersold, R.; Campbell, C. T.
Anal. Chem. 2004, 76, 918–929.
Published on Web 3/2/2009
© 2009 American Chemical Society
DOI: 10.1021/la804021t Langmuir 2009, 25(9),5054–50605054
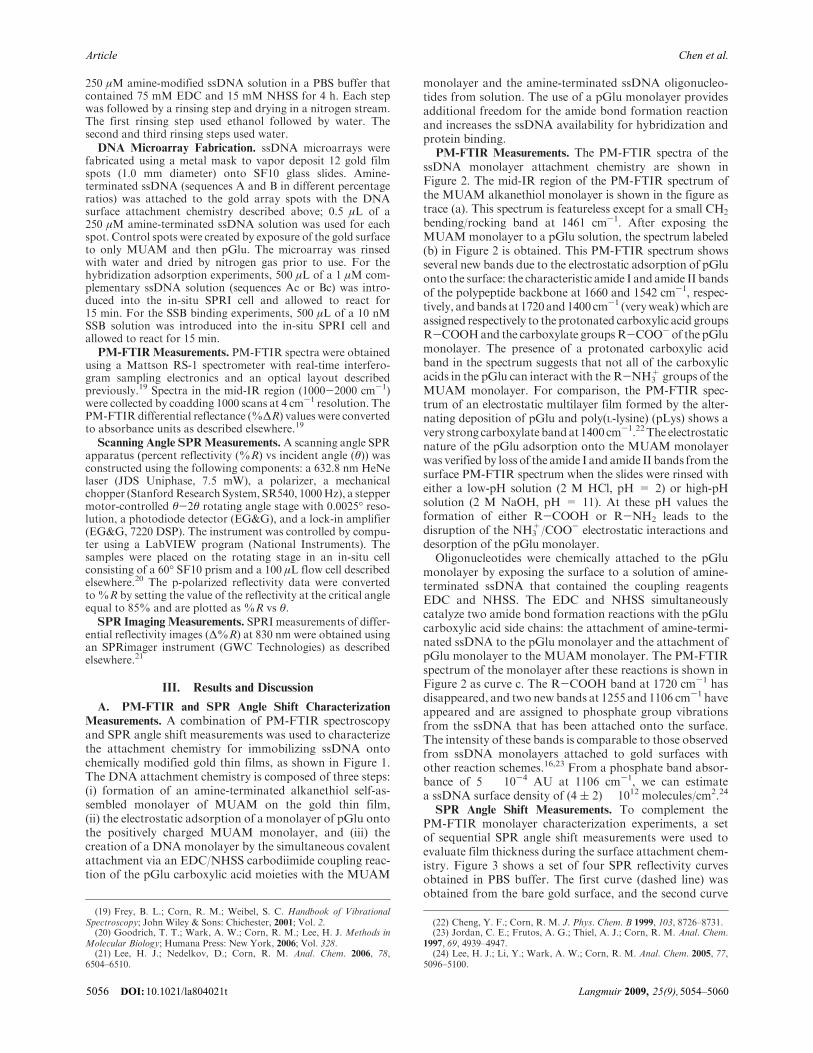
protein-protein interactions. Most “robust” DNA surfaceattachment chemistries create a covalent bond with the sur-face by reacting either an amine-modified ssDNA (at eitherthe 50 or 30 end) to an amine-reactive surface monolayerto form an amide bond or a thiol-modified ssDNA to athiol-reactive surface monolayer to form a sulfur-carbon orsulfur-sulfur bond. For the amine-reactive surface, a car-boxylic acid-terminated alkanethiol is typically used to forman amide bond to the amine-modified ssDNA via a carbodii-mide coupling reaction.14,15 Thiol-modified oligonucleotideshave been attached to alkanethiol-modified gold surfaces viacoupling reactions that form either a disulfide or a maleimidebond.16,17 For all of these attachment chemistries, it is essen-tial that the surface coverage, bioavailability, and resistanceto nonspecific adsorption of both DNA and proteins bethoroughly characterized.
In this paper, we characterize and implement a new meth-odology for ssDNA microarray fabrication that uses thechemical attachment of amine-modified oligonucleotidesonto an electrostatically adsorbed monolayer of the anionicpolypeptide poly(L-glutamic acid) (pGlu). SPRI measure-ments demonstrate that these robust ssDNA microarraysexhibit very high surface hybridization efficiency, have verylittle nonspecific adsorption, provide additional biomoleculeaccessibility, and canbe used in complex,multistep biosensingassays. The pGlu attachment chemistry process is depictedschematically in Figure 1. We have used pGlu monolayerspreviously in conjunction with monolayers of the cationicpolypeptide poly(L-lysine) (pLys) to form ultrathin hydrophi-lic films at gold surfaces by the process of layer-by-layer (LbL)electrostatic adsorption.18As shown in the figure, pGlu that iselectrostatically adsorbed onto an amine-terminated alka-nethiol monolayer is used to attach amine-modified DNAonto the gold film via a carbodiimide coupling reaction thatsimultaneously forms amide bonds between the pGlu and theamine-terminated DNA as well as the pGlu and the amine-terminated alkanethiol monolayer. This surface attachmentchemistry differs from previous amine-carboxylic acidattachment chemistries that utilize an amide bond formationreaction with self-assembled monolayers or silane polymerfilms in several ways: (i) the use of electrostatic adsorption forpGlu deposition controls the amount and spacing of pGlucarboyxlic acid groups on the surface, (ii) the amide bondformation reaction attaches both the amine-terminatedssDNA onto the pGlu and the pGlu onto the amine-termi-natedmonolayer, and (iii) the use of pGlu provides additionalflexibility for the surface-attached ssDNA, which makes iteasier to hybridize and form dsDNA on the surface. Acombination of polarization modulation Fourier transforminfrared (PM-FTIR) spectroscopy and SPR angle shift mea-surements is used to characterize the formation of ssDNAmonolayers on gold thin films. We then fabricate DNAmicroarrays and employ SPRI to both quantitativelymeasurethe hybridization adsorption of DNA onto the micro-array elements and quantitatively monitor the adsorption
of single-stranded binding protein (SSB) onto fully andpartially hybridized DNAmicroarrays. From these measure-ments, we calculate a Langmuir adsorption coefficient (KAds)of (5.5 ( 0.4) ! 109 M-1.
II. Experimental Considerations
Materials. The chemicals 11-amino-1-undecanethiol hydro-chloride (MUAM; Dojindo), poly(L-glutamic acid) sodium salt(MW=50 000-100 000) (pGlu; Sigma), 1-ethyl-3-(3-(dimethy-lamino)propyl)carbodiimide hydrochloride (EDC; Pierce),N-hydroxysulfosuccinimide (NHSS; Pierce), and single-strandedDNAbinding protein (MW=75 372) (SSB; EpicenterBiotechnologies) were used as received.
A PBS buffer (100mMNa2HPO4, 0.3MNaCl, 5mMMgCl2,1 mM EDTA, adjusted to pH 7.4) was used for all DNA andSSB binding measurements. Four ssDNA sequences werepurchased from Integrated DNA Technologies and used asreceived; the sequences are denoted A, Ac, B, and Bc: A =50-NH2-(CH2)12-CGAAATCCAGACACATAAGCACGAACCGAA-30; Ac = 50- TTCGGTTCGTGCTTATGTGTCTGGATTTCG-30; B= 50-NH2-(CH2)12-(T)30-3
0; Bc= 50-(A)30-30.
Two types of gold thin films were used in the experiments:(i) for SPR, 45 nm gold films with a 1 nm Cr underlayer werevapor-deposited onto SF10 glass slides (18mm! 18mm, SchottGlass Technologies) using a Denton DV-502A evaporator, and(ii) for PM-FTIR, gold-coated silica slides (100 nm Au with a5 nm Cr underlayer) were obtained from Evaporated MetalFilms. All gold films were rinsed with ethanol and water priorto use.
DNAAttachment Chemistry. ssDNAwas attached onto thegold films in a three-step process: (i) formation of a self-assembled MUAM monolayer by immersion of the slide in a1 mM ethanolic MUAM solution for at least 24 h; (ii) pGlumonolayer formation by immersion in 2 mg/mL pGlu solutionin PBSbuffer for 1 h; (iii) exposure of the surface to an optimized
Figure 1. Three-step reaction scheme for attaching amine-termi-nated ssDNA onto gold surfaces. (a) A self-assembled monolayer ofaminoundecanethiol (MUAM) is immobilized onto the gold sub-strate. (b) A monolayer of poly(L-glutamic acid) (pGlu) is electro-statically adsorbed onto the MUAM monolayer. (c) Amine-terminated ssDNA is covalently attached to the pGlu monolayerby a carbodiimide-catalyzed amide bond formation reaction usingEDC and NHSS. At the same time, the pGlu monolayer is alsocovalently attached to the MUAM monolayer by the carbodiimidecoupling reaction.
(14) Phillips, K. S.; Han, J. H.; Martinez, M.; Wang, Z. Z.; Carter, D.;Cheng, Q. Anal. Chem. 2006, 78, 596–603.
(15) Strother, T.; Knickerbocker, T.; Russell, J. N.; Butler, J. E.; Smith, L.M.; Hamers, R. J. Langmuir 2002, 18, 968–971.
(16) Smith, E.; Wanat, M. J.; Cheng, Y.; Barreira, S. V. P.; Frutos, A. G.;Corn, R. M. Langmuir 2001, 17, 2502–2507.
(17) Brockman, J.M.; Frutos, A.G.; Corn, R.M. J. Am. Chem. Soc. 1999,121, 8044–8051.
(18) Frutos, A. G.; Weibel, S. C.; Corn, R. M. Anal. Chem. 1999, 71,3935–3940.
DOI: 10.1021/la804021tLangmuir 2009, 25(9), 5054–5060 5055
ArticleChen et al.
250 !M amine-modified ssDNA solution in a PBS buffer thatcontained 75 mM EDC and 15 mM NHSS for 4 h. Each stepwas followed by a rinsing step and drying in a nitrogen stream.The first rinsing step used ethanol followed by water. Thesecond and third rinsing steps used water.
DNA Microarray Fabrication. ssDNA microarrays werefabricated using a metal mask to vapor deposit 12 gold filmspots (1.0 mm diameter) onto SF10 glass slides. Amine-terminated ssDNA (sequences A and B in different percentageratios) was attached to the gold array spots with the DNAsurface attachment chemistry described above; 0.5 !L of a250 !M amine-terminated ssDNA solution was used for eachspot. Control spots were created by exposure of the gold surfaceto only MUAM and then pGlu. The microarray was rinsedwith water and dried by nitrogen gas prior to use. For thehybridization adsorption experiments, 500 !L of a 1 !M com-plementary ssDNA solution (sequences Ac or Bc) was intro-duced into the in-situ SPRI cell and allowed to react for15 min. For the SSB binding experiments, 500 !L of a 10 nMSSB solution was introduced into the in-situ SPRI cell andallowed to react for 15 min.
PM-FTIRMeasurements. PM-FTIR spectra were obtainedusing a Mattson RS-1 spectrometer with real-time interfero-gram sampling electronics and an optical layout describedpreviously.19 Spectra in the mid-IR region (1000-2000 cm-1)were collected by coadding 1000 scans at 4 cm-1 resolution. ThePM-FTIR differential reflectance (%!R) values were convertedto absorbance units as described elsewhere.19
Scanning Angle SPRMeasurements. A scanning angle SPRapparatus (percent reflectivity (%R) vs incident angle (")) wasconstructed using the following components: a 632.8 nm HeNelaser (JDS Uniphase, 7.5 mW), a polarizer, a mechanicalchopper (StanfordResearch System, SR540, 1000Hz), a steppermotor-controlled "-2" rotating angle stage with 0.0025! reso-lution, a photodiode detector (EG&G), and a lock-in amplifier(EG&G, 7220 DSP). The instrument was controlled by compu-ter using a LabVIEW program (National Instruments). Thesamples were placed on the rotating stage in an in-situ cellconsisting of a 60! SF10 prism and a 100 !L flow cell describedelsewhere.20 The p-polarized reflectivity data were convertedto%R by setting the value of the reflectivity at the critical angleequal to 85% and are plotted as %R vs ".
SPR ImagingMeasurements. SPRI measurements of differ-ential reflectivity images (!%R) at 830 nm were obtained usingan SPRimager instrument (GWC Technologies) as describedelsewhere.21
III. Results and Discussion
A. PM-FTIR and SPR Angle Shift CharacterizationMeasurements. A combination of PM-FTIR spectroscopyand SPR angle shift measurements was used to characterizethe attachment chemistry for immobilizing ssDNA ontochemically modified gold thin films, as shown in Figure 1.The DNA attachment chemistry is composed of three steps:(i) formation of an amine-terminated alkanethiol self-as-sembled monolayer of MUAM on the gold thin film,(ii) the electrostatic adsorption of a monolayer of pGlu ontothe positively charged MUAM monolayer, and (iii) thecreation of a DNAmonolayer by the simultaneous covalentattachment via an EDC/NHSS carbodiimide coupling reac-tion of the pGlu carboxylic acid moieties with the MUAM
monolayer and the amine-terminated ssDNA oligonucleo-tides from solution. The use of a pGlu monolayer providesadditional freedom for the amide bond formation reactionand increases the ssDNA availability for hybridization andprotein binding.
PM-FTIR Measurements. The PM-FTIR spectra of thessDNA monolayer attachment chemistry are shown inFigure 2. The mid-IR region of the PM-FTIR spectrum ofthe MUAM alkanethiol monolayer is shown in the figure astrace (a). This spectrum is featureless except for a small CH2
bending/rocking band at 1461 cm-1. After exposing theMUAMmonolayer to a pGlu solution, the spectrum labeled(b) in Figure 2 is obtained. This PM-FTIR spectrum showsseveral new bands due to the electrostatic adsorption of pGluonto the surface: the characteristic amide I andamide II bandsof the polypeptide backbone at 1660 and 1542 cm-1, respec-tively, andbands at 1720and1400 cm-1 (veryweak)which areassigned respectively to the protonated carboxylic acid groupsR-COOHand the carboxylate groupsR-COO- of the pGlumonolayer. The presence of a protonated carboxylic acidband in the spectrum suggests that not all of the carboxylicacids in the pGlu can interact with the R-NH3
+ groups of theMUAM monolayer. For comparison, the PM-FTIR spec-trum of an electrostatic multilayer film formed by the alter-nating deposition of pGlu and poly(L-lysine) (pLys) shows avery strong carboxylatebandat 1400 cm-1.22The electrostaticnature of the pGlu adsorption onto the MUAM monolayerwas verified by loss of the amide I and amide II bands from thesurface PM-FTIR spectrum when the slides were rinsed witheither a low-pH solution (2 M HCl, pH = 2) or high-pHsolution (2 M NaOH, pH = 11). At these pH values theformation of either R-COOH or R-NH2 leads to thedisruption of the NH3
+/COO- electrostatic interactions anddesorption of the pGlu monolayer.
Oligonucleotides were chemically attached to the pGlumonolayer by exposing the surface to a solution of amine-terminated ssDNA that contained the coupling reagentsEDC and NHSS. The EDC and NHSS simultaneouslycatalyze two amide bond formation reactions with the pGlucarboxylic acid side chains: the attachment of amine-termi-nated ssDNA to the pGlu monolayer and the attachment ofpGlu monolayer to the MUAM monolayer. The PM-FTIRspectrum of the monolayer after these reactions is shown inFigure 2 as curve c. The R-COOH band at 1720 cm-1 hasdisappeared, and two new bands at 1255 and 1106 cm-1 haveappeared and are assigned to phosphate group vibrationsfrom the ssDNA that has been attached onto the surface.The intensity of these bands is comparable to those observedfrom ssDNA monolayers attached to gold surfaces withother reaction schemes.16,23 From a phosphate band absor-bance of 5 ! 10-4 AU at 1106 cm-1, we can estimatea ssDNA surface density of (4 ( 2) ! 1012 molecules/cm2.24
SPR Angle Shift Measurements. To complement thePM-FTIR monolayer characterization experiments, a setof sequential SPR angle shift measurements were used toevaluate film thickness during the surface attachment chem-istry. Figure 3 shows a set of four SPR reflectivity curvesobtained in PBS buffer. The first curve (dashed line) wasobtained from the bare gold surface, and the second curve
(19) Frey, B. L.; Corn, R. M.; Weibel, S. C. Handbook of VibrationalSpectroscopy; John Wiley & Sons: Chichester, 2001; Vol. 2.
(20) Goodrich, T. T.; Wark, A. W.; Corn, R. M.; Lee, H. J. Methods inMolecular Biology; Humana Press: New York, 2006; Vol. 328.
(21) Lee, H. J.; Nedelkov, D.; Corn, R. M. Anal. Chem. 2006, 78,6504–6510.
(22) Cheng, Y. F.; Corn, R. M. J. Phys. Chem. B 1999, 103, 8726–8731.(23) Jordan, C. E.; Frutos, A. G.; Thiel, A. J.; Corn, R. M. Anal. Chem.
1997, 69, 4939–4947.(24) Lee, H. J.; Li, Y.; Wark, A. W.; Corn, R. M. Anal. Chem. 2005, 77,
5096–5100.
DOI: 10.1021/la804021t Langmuir 2009, 25(9),5054–50605056
Article Chen et al.
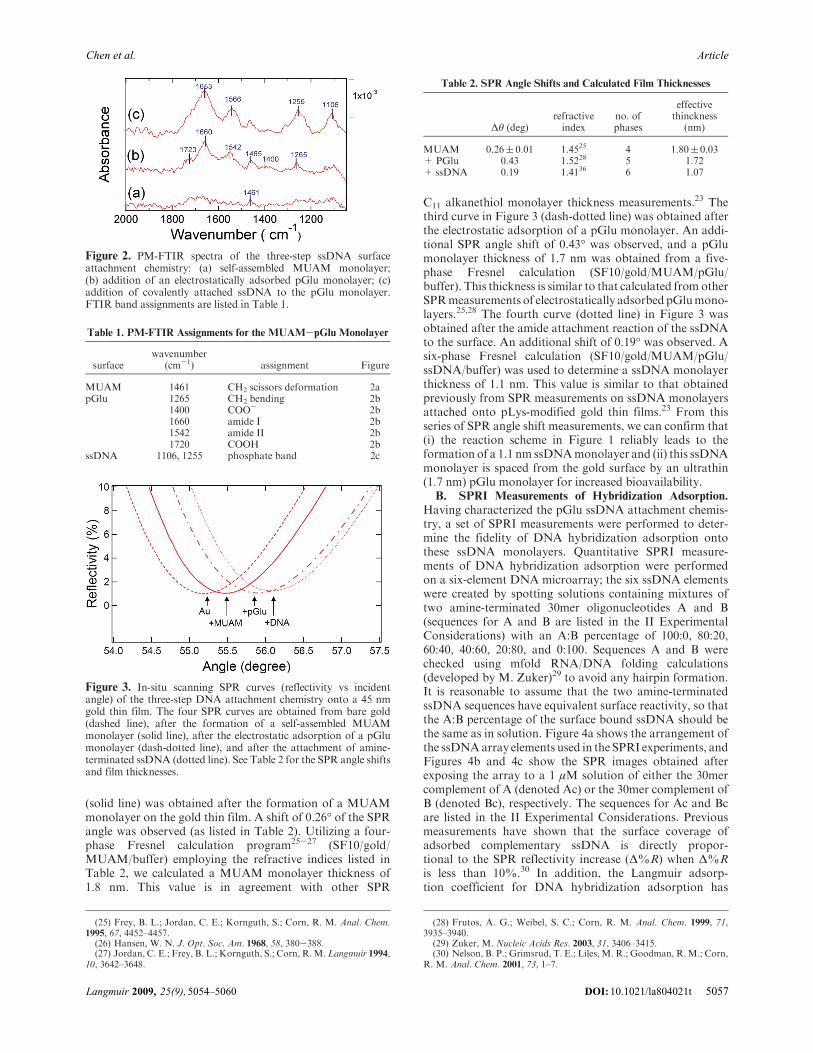
(solid line) was obtained after the formation of a MUAMmonolayer on the gold thin film. A shift of 0.26! of the SPRangle was observed (as listed in Table 2). Utilizing a four-phase Fresnel calculation program25-27 (SF10/gold/MUAM/buffer) employing the refractive indices listed inTable 2, we calculated a MUAM monolayer thickness of1.8 nm. This value is in agreement with other SPR
C11 alkanethiol monolayer thickness measurements.23 Thethird curve in Figure 3 (dash-dotted line) was obtained afterthe electrostatic adsorption of a pGlu monolayer. An addi-tional SPR angle shift of 0.43! was observed, and a pGlumonolayer thickness of 1.7 nm was obtained from a five-phase Fresnel calculation (SF10/gold/MUAM/pGlu/buffer). This thickness is similar to that calculated from otherSPRmeasurements of electrostatically adsorbedpGlumono-layers.25,28 The fourth curve (dotted line) in Figure 3 wasobtained after the amide attachment reaction of the ssDNAto the surface. An additional shift of 0.19! was observed. Asix-phase Fresnel calculation (SF10/gold/MUAM/pGlu/ssDNA/buffer) was used to determine a ssDNA monolayerthickness of 1.1 nm. This value is similar to that obtainedpreviously from SPR measurements on ssDNA monolayersattached onto pLys-modified gold thin films.23 From thisseries of SPR angle shift measurements, we can confirm that(i) the reaction scheme in Figure 1 reliably leads to theformation of a 1.1 nm ssDNAmonolayer and (ii) this ssDNAmonolayer is spaced from the gold surface by an ultrathin(1.7 nm) pGlu monolayer for increased bioavailability.
B. SPRI Measurements of Hybridization Adsorption.Having characterized the pGlu ssDNA attachment chemis-try, a set of SPRI measurements were performed to deter-mine the fidelity of DNA hybridization adsorption ontothese ssDNA monolayers. Quantitative SPRI measure-ments of DNA hybridization adsorption were performedon a six-element DNA microarray; the six ssDNA elementswere created by spotting solutions containing mixtures oftwo amine-terminated 30mer oligonucleotides A and B(sequences for A and B are listed in the II ExperimentalConsiderations) with an A:B percentage of 100:0, 80:20,60:40, 40:60, 20:80, and 0:100. Sequences A and B werechecked using mfold RNA/DNA folding calculations(developed by M. Zuker)29 to avoid any hairpin formation.It is reasonable to assume that the two amine-terminatedssDNA sequences have equivalent surface reactivity, so thatthe A:B percentage of the surface bound ssDNA should bethe same as in solution. Figure 4a shows the arrangement ofthe ssDNAarray elements used in the SPRI experiments, andFigures 4b and 4c show the SPR images obtained afterexposing the array to a 1 !M solution of either the 30mercomplement of A (denoted Ac) or the 30mer complement ofB (denoted Bc), respectively. The sequences for Ac and Bcare listed in the II Experimental Considerations. Previousmeasurements have shown that the surface coverage ofadsorbed complementary ssDNA is directly propor-tional to the SPR reflectivity increase (!%R) when !%Ris less than 10%.30 In addition, the Langmuir adsorp-tion coefficient for DNA hybridization adsorption has
Figure 2. PM-FTIR spectra of the three-step ssDNA surfaceattachment chemistry: (a) self-assembled MUAM monolayer;(b) addition of an electrostatically adsorbed pGlu monolayer; (c)addition of covalently attached ssDNA to the pGlu monolayer.FTIR band assignments are listed in Table 1.
Figure 3. In-situ scanning SPR curves (reflectivity vs incidentangle) of the three-step DNA attachment chemistry onto a 45 nmgold thin film. The four SPR curves are obtained from bare gold(dashed line), after the formation of a self-assembled MUAMmonolayer (solid line), after the electrostatic adsorption of a pGlumonolayer (dash-dotted line), and after the attachment of amine-terminated ssDNA (dotted line). See Table 2 for the SPR angle shiftsand film thicknesses.
Table 1. PM-FTIR Assignments for the MUAM-pGlu Monolayer
surfacewavenumber
(cm-1) assignment Figure
MUAM 1461 CH2 scissors deformation 2apGlu 1265 CH2 bending 2b
1400 COO- 2b1660 amide I 2b1542 amide II 2b1720 COOH 2b
ssDNA 1106, 1255 phosphate band 2c
Table 2. SPR Angle Shifts and Calculated Film Thicknesses
!" (deg)refractiveindex
no. ofphases
effectivethinckness
(nm)
MUAM 0.26( 0.01 1.4525 4 1.80( 0.03+ PGlu 0.43 1.5228 5 1.72+ ssDNA 0.19 1.4136 6 1.07
(25) Frey, B. L.; Jordan, C. E.; Kornguth, S.; Corn, R. M. Anal. Chem.1995, 67, 4452–4457.
(26) Hansen, W. N. J. Opt. Soc. Am. 1968, 58, 380-388.(27) Jordan, C. E.; Frey, B. L.; Kornguth, S.; Corn, R.M.Langmuir 1994,
10, 3642–3648.
(28) Frutos, A. G.; Weibel, S. C.; Corn, R. M. Anal. Chem. 1999, 71,3935–3940.
(29) Zuker, M. Nucleic Acids Res. 2003, 31, 3406–3415.(30) Nelson, B. P.; Grimsrud, T. E.; Liles, M. R.; Goodman, R.M.; Corn,
R. M. Anal. Chem. 2001, 73, 1–7.
DOI: 10.1021/la804021tLangmuir 2009, 25(9), 5054–5060 5057
ArticleChen et al.
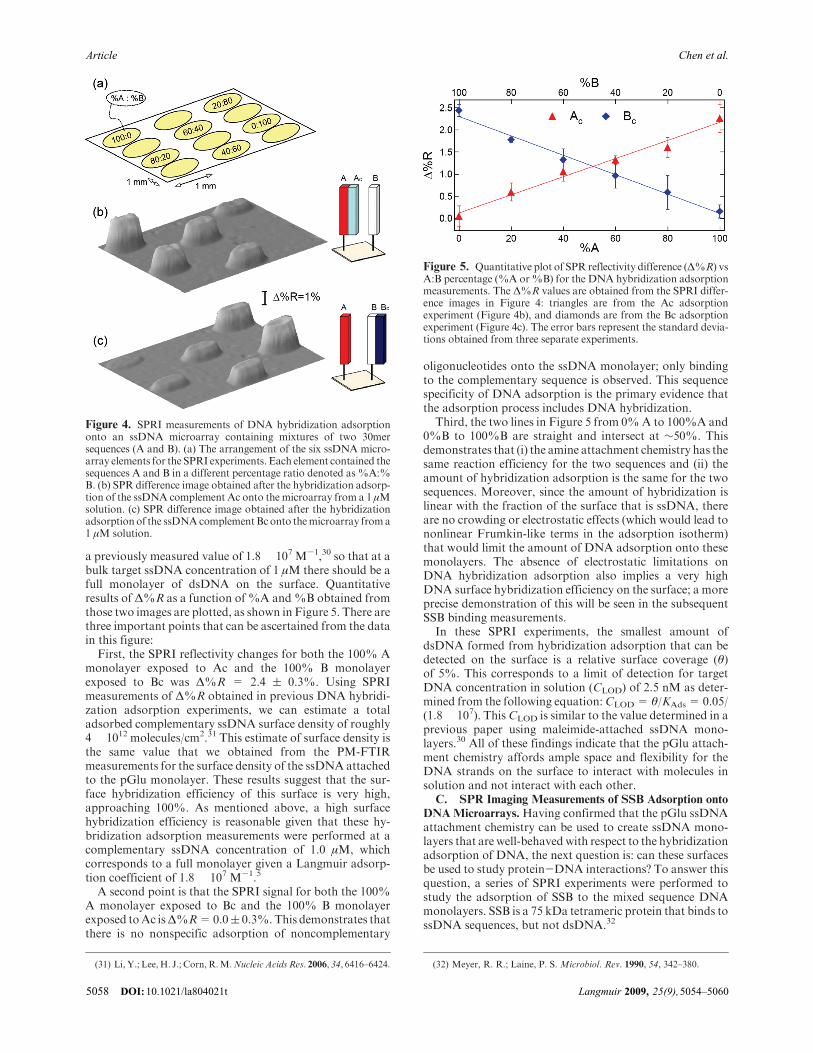
a previously measured value of 1.8 ! 107 M-1,30 so that at abulk target ssDNA concentration of 1 !M there should be afull monolayer of dsDNA on the surface. Quantitativeresults of !%R as a function of %A and%B obtained fromthose two images are plotted, as shown in Figure 5. There arethree important points that can be ascertained from the datain this figure:
First, the SPRI reflectivity changes for both the 100% Amonolayer exposed to Ac and the 100% B monolayerexposed to Bc was !%R = 2.4 ( 0.3%. Using SPRImeasurements of !%R obtained in previous DNA hybridi-zation adsorption experiments, we can estimate a totaladsorbed complementary ssDNA surface density of roughly4! 1012 molecules/cm2.31 This estimate of surface density isthe same value that we obtained from the PM-FTIRmeasurements for the surface density of the ssDNA attachedto the pGlu monolayer. These results suggest that the sur-face hybridization efficiency of this surface is very high,approaching 100%. As mentioned above, a high surfacehybridization efficiency is reasonable given that these hy-bridization adsorption measurements were performed at acomplementary ssDNA concentration of 1.0 !M, whichcorresponds to a full monolayer given a Langmuir adsorp-tion coefficient of 1.8 ! 107 M-1.5
A second point is that the SPRI signal for both the 100%A monolayer exposed to Bc and the 100% B monolayerexposed toAc is!%R=0.0( 0.3%.This demonstrates thatthere is no nonspecific adsorption of noncomplementary
oligonucleotides onto the ssDNA monolayer; only bindingto the complementary sequence is observed. This sequencespecificity of DNA adsorption is the primary evidence thatthe adsorption process includes DNA hybridization.
Third, the two lines in Figure 5 from 0%A to 100%A and0%B to 100%B are straight and intersect at !50%. Thisdemonstrates that (i) the amine attachment chemistry has thesame reaction efficiency for the two sequences and (ii) theamount of hybridization adsorption is the same for the twosequences. Moreover, since the amount of hybridization islinear with the fraction of the surface that is ssDNA, thereare no crowding or electrostatic effects (which would lead tononlinear Frumkin-like terms in the adsorption isotherm)that would limit the amount of DNA adsorption onto thesemonolayers. The absence of electrostatic limitations onDNA hybridization adsorption also implies a very highDNA surface hybridization efficiency on the surface; a moreprecise demonstration of this will be seen in the subsequentSSB binding measurements.
In these SPRI experiments, the smallest amount ofdsDNA formed from hybridization adsorption that can bedetected on the surface is a relative surface coverage (")of 5%. This corresponds to a limit of detection for targetDNA concentration in solution (CLOD) of 2.5 nM as deter-mined from the following equation:CLOD= "/KAds= 0.05/(1.8! 107). ThisCLOD is similar to the value determined in aprevious paper using maleimide-attached ssDNA mono-layers.30 All of these findings indicate that the pGlu attach-ment chemistry affords ample space and flexibility for theDNA strands on the surface to interact with molecules insolution and not interact with each other.
C. SPR Imaging Measurements of SSB Adsorption ontoDNAMicroarrays.Having confirmed that the pGlu ssDNAattachment chemistry can be used to create ssDNA mono-layers that are well-behavedwith respect to the hybridizationadsorption of DNA, the next question is: can these surfacesbe used to study protein-DNA interactions? To answer thisquestion, a series of SPRI experiments were performed tostudy the adsorption of SSB to the mixed sequence DNAmonolayers. SSB is a 75 kDa tetrameric protein that binds tossDNA sequences, but not dsDNA.32
Figure 4. SPRI measurements of DNA hybridization adsorptiononto an ssDNA microarray containing mixtures of two 30mersequences (A and B). (a) The arrangement of the six ssDNA micro-array elements for the SPRI experiments. Each element contained thesequences A and B in a different percentage ratio denoted as %A:%B. (b) SPR difference image obtained after the hybridization adsorp-tion of the ssDNA complement Ac onto the microarray from a 1 !Msolution. (c) SPR difference image obtained after the hybridizationadsorptionof the ssDNAcomplementBconto themicroarray froma1 !M solution.
Figure 5. Quantitative plot of SPR reflectivity difference (!%R) vsA:B percentage (%A or%B) for the DNA hybridization adsorptionmeasurements. The !%R values are obtained from the SPRI differ-ence images in Figure 4: triangles are from the Ac adsorptionexperiment (Figure 4b), and diamonds are from the Bc adsorptionexperiment (Figure 4c). The error bars represent the standard devia-tions obtained from three separate experiments.
(31) Li, Y.; Lee, H. J.; Corn,R.M.Nucleic Acids Res. 2006, 34, 6416–6424. (32) Meyer, R. R.; Laine, P. S. Microbiol. Rev. 1990, 54, 342–380.
DOI: 10.1021/la804021t Langmuir 2009, 25(9),5054–50605058
Article Chen et al.
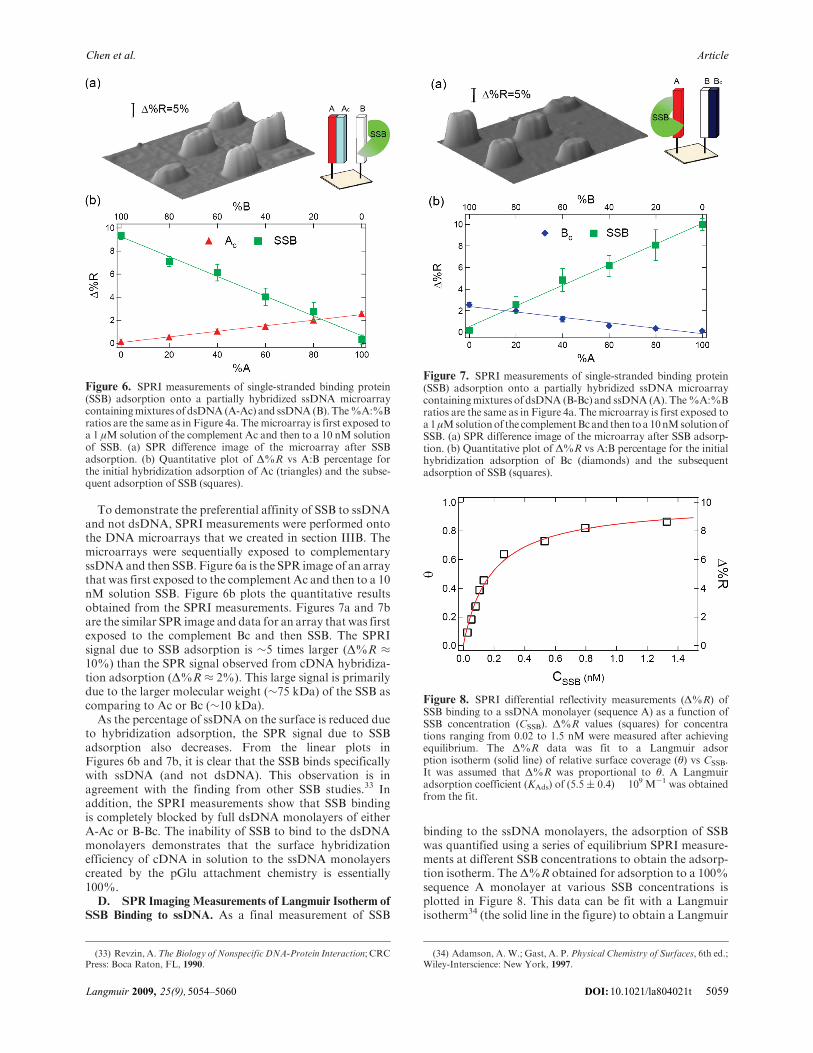
To demonstrate the preferential affinity of SSB to ssDNAand not dsDNA, SPRI measurements were performed ontothe DNA microarrays that we created in section IIIB. Themicroarrays were sequentially exposed to complementaryssDNAand then SSB. Figure 6a is the SPR image of an arraythat was first exposed to the complement Ac and then to a 10nM solution SSB. Figure 6b plots the quantitative resultsobtained from the SPRI measurements. Figures 7a and 7bare the similar SPR image and data for an array that was firstexposed to the complement Bc and then SSB. The SPRIsignal due to SSB adsorption is !5 times larger (!%R "10%) than the SPR signal observed from cDNA hybridiza-tion adsorption (!%R " 2%). This large signal is primarilydue to the larger molecular weight (!75 kDa) of the SSB ascomparing to Ac or Bc (!10 kDa).
As the percentage of ssDNA on the surface is reduced dueto hybridization adsorption, the SPR signal due to SSBadsorption also decreases. From the linear plots inFigures 6b and 7b, it is clear that the SSB binds specificallywith ssDNA (and not dsDNA). This observation is inagreement with the finding from other SSB studies.33 Inaddition, the SPRI measurements show that SSB bindingis completely blocked by full dsDNA monolayers of eitherA-Ac or B-Bc. The inability of SSB to bind to the dsDNAmonolayers demonstrates that the surface hybridizationefficiency of cDNA in solution to the ssDNA monolayerscreated by the pGlu attachment chemistry is essentially100%.
D. SPR ImagingMeasurements of Langmuir Isotherm ofSSB Binding to ssDNA. As a final measurement of SSB
binding to the ssDNA monolayers, the adsorption of SSBwas quantified using a series of equilibrium SPRI measure-ments at different SSB concentrations to obtain the adsorp-tion isotherm. The!%R obtained for adsorption to a 100%sequence A monolayer at various SSB concentrations isplotted in Figure 8. This data can be fit with a Langmuirisotherm34 (the solid line in the figure) to obtain a Langmuir
Figure 6. SPRI measurements of single-stranded binding protein(SSB) adsorption onto a partially hybridized ssDNA microarraycontainingmixtures of dsDNA(A-Ac) and ssDNA (B).The%A:%Bratios are the same as in Figure 4a. The microarray is first exposed toa 1 !M solution of the complement Ac and then to a 10 nM solutionof SSB. (a) SPR difference image of the microarray after SSBadsorption. (b) Quantitative plot of !%R vs A:B percentage forthe initial hybridization adsorption of Ac (triangles) and the subse-quent adsorption of SSB (squares).
Figure 7. SPRI measurements of single-stranded binding protein(SSB) adsorption onto a partially hybridized ssDNA microarraycontainingmixtures of dsDNA (B-Bc) and ssDNA (A). The%A:%Bratios are the same as in Figure 4a. The microarray is first exposed toa 1!Msolutionof the complementBcand then toa 10nMsolutionofSSB. (a) SPR difference image of the microarray after SSB adsorp-tion. (b) Quantitative plot of !%R vs A:B percentage for the initialhybridization adsorption of Bc (diamonds) and the subsequentadsorption of SSB (squares).
Figure 8. SPRI differential reflectivity measurements (!%R) ofSSB binding to a ssDNA monolayer (sequence A) as a function ofSSB concentration (CSSB). !%R values (squares) for concentrations ranging from 0.02 to 1.5 nM were measured after achievingequilibrium. The !%R data was fit to a Langmuir adsorption isotherm (solid line) of relative surface coverage (") vs CSSB.It was assumed that !%R was proportional to ". A Langmuiradsorption coefficient (KAds) of (5.5( 0.4)! 109 M-1 was obtainedfrom the fit.
(33) Revzin, A.The Biology of Nonspecific DNA-Protein Interaction; CRCPress: Boca Raton, FL, 1990.
(34) Adamson, A. W.; Gast, A. P. Physical Chemistry of Surfaces, 6th ed.;Wiley-Interscience: New York, 1997.
DOI: 10.1021/la804021tLangmuir 2009, 25(9), 5054–5060 5059
ArticleChen et al.
adsorption coefficient,KAds, of (5.5( 0.4)! 109M-1, whichis similar to the value of 1.7! 1010M-1 measured byKozlovet al.35 This large value of KAds confirms that in the mixedmonolayer SSB binding experiments shown in Figures 6and 7 all of the available ssDNA binding sites were occupiedsince the SSB solution concentration was 10 nM.
IV. Conclusions
The combination of PM-FTIR spectroscopy, SPR angleshift measurements, and SPR imaging measurements pro-vides a powerful method for quantitating the chemical struc-ture and bioavailability of ssDNA monolayers. Using thesespectroscopic methods, we have demonstrated that the novelpGlu DNA surface attachment chemistry described andcharacterized in this paper leads to the fabrication of robustssDNAmicroarrays that have very high surface hybridizationefficiency, very little nonspecific adsorption, and can be used
in complex, multistep biosensing assays. One condition thatthese monolayers cannot survive is very high temperaturesdue to the cleavage of the MUAM gold-thiol bond. Thisproblem can be alleviated by using this pGlu attachmentchemistry on silicate or carbon modified gold surfaces.14,15
As observed in the SPRImeasurements of SSB binding to themicroarrays, these surfaces can also be used to quantitativelystudy the adsorption of proteins onto ssDNA and dsDNAmonolayers. Future efforts will be directed toward the de-monstrationof surface enzyme reactionson thesemonolayers.This pGlu attachment chemistry may also be used to attachother amine-containing biomolecules (e.g., proteins, peptides)to gold films for biosensing applications.
Acknowledgment. This research was supported by theNational Institute of Health (2RO1 GM059622-04 and1R21 RR018475-01A2), the National Science Foundation(CHE-0551935), and the DARPA Micro/Nano FluidicsFundamentals Focus MF3 Center at UCI. R.M.C. has afinancial interest in GWC technologies.
(35) Kozlov, A. G.; Lohman, T. M. Biochemistry 2002, 41, 6032–6044.(36) Georgiadis, R. M.; Peterlinz, K. P.; Peterson, A. W. J. Am. Chem.
Soc. 2000, 122, 3166–3173.
DOI: 10.1021/la804021t Langmuir 2009, 25(9),5054–50605060
Article Chen et al.