


© 2008 - Proprietary and Confidential Information of Radieux. Alvaro Baeza Angela Raub Bruce Smith...
26
© 2008 - Proprietary and Confidential Information of Radieux. Alvaro Baeza Angela Raub Bruce Smith Mary Udie Navaneeth Aguru Rob Latham
-
Upload
drusilla-eaton -
Category
Documents
-
view
216 -
download
0
Transcript of © 2008 - Proprietary and Confidential Information of Radieux. Alvaro Baeza Angela Raub Bruce Smith...

© 2008 - Proprietary and Confidential Information of Radieux.
Alvaro Baeza Angela Raub Bruce Smith Mary Udie Navaneeth Aguru Rob Latham
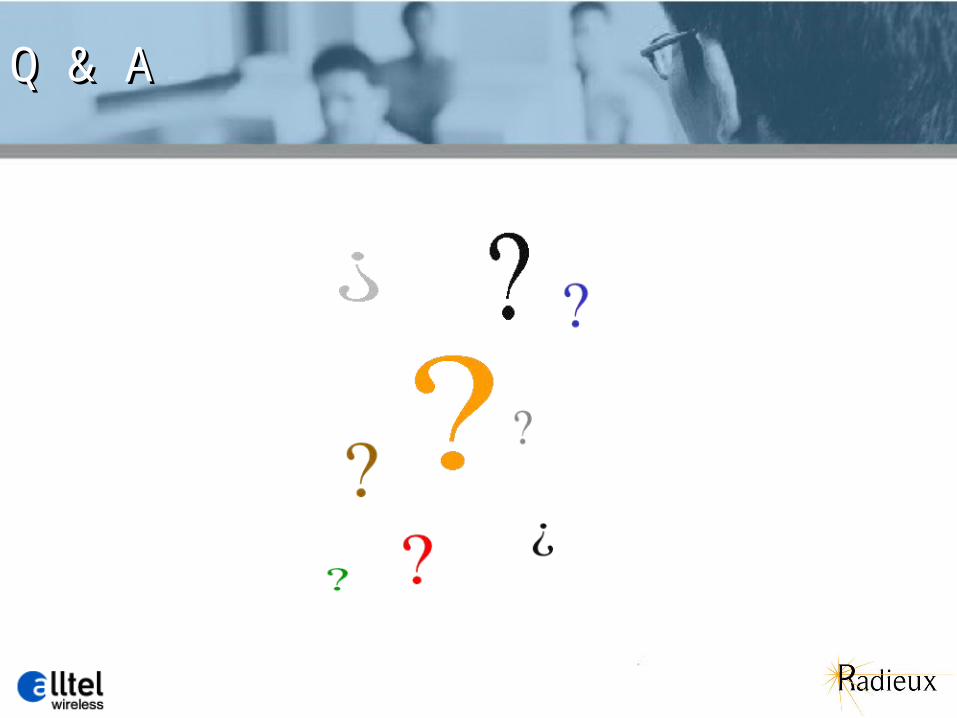
600 companies with combined annual revenue of over $110 billion.
Major companies earn about 85 percent of industry revenueVerizon WirelessAT&T Mobility Sprint NextelT-Mobile
The industry is capital intensive:95 % of wireless services sales are end-users 5 % to resellers. 75 % of the population subscribe to cell phone services
Description of IndustryDescription of Industry
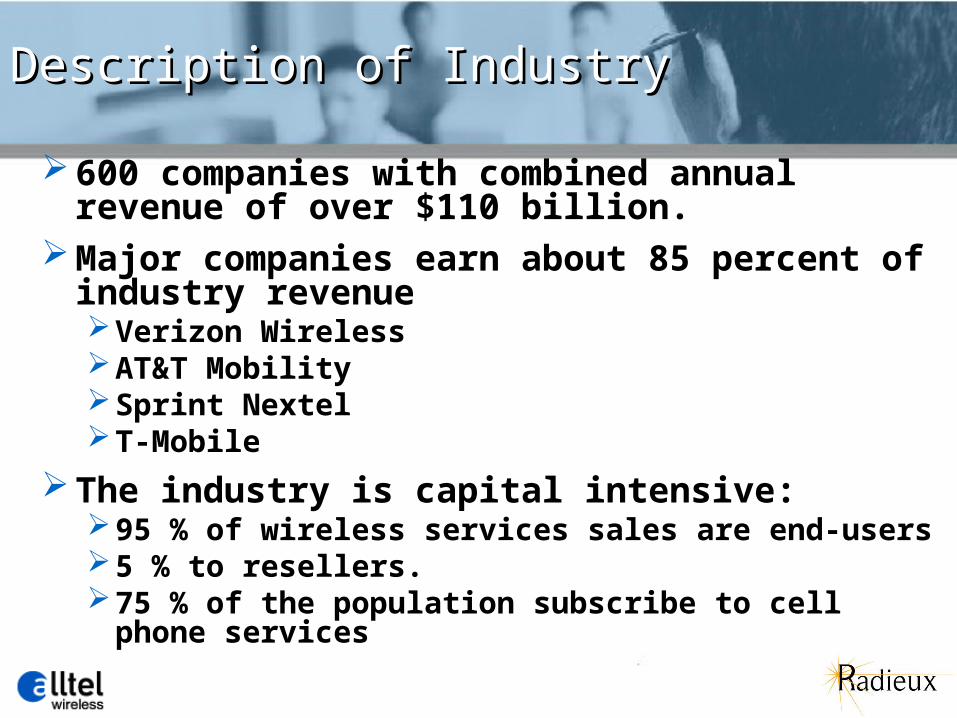
AT&T Mobility Verizon Wireless
53.1 million customers Third largest wireless carrier in
the United States Lost market share due poor
execution during merger
53.1 million customers Third largest wireless carrier in
the United States Lost market share due poor
execution during merger
27 million customers Fourth largest wireless carrier in
the United States 101 million subscribers worldwide
(Sixth largest in the world) Has the highest customer rating
27 million customers Fourth largest wireless carrier in
the United States 101 million subscribers worldwide
(Sixth largest in the world) Has the highest customer rating
67.3 million customers
Largest digital voice and data network in the United States
40,000 union workers.
67.3 million customers
Largest digital voice and data network in the United States
40,000 union workers.
59.1 million customers
Second largest market share in the United States
Expected double digit growth in revenue from data and entertainment services
59.1 million customers
Second largest market share in the United States
Expected double digit growth in revenue from data and entertainment services
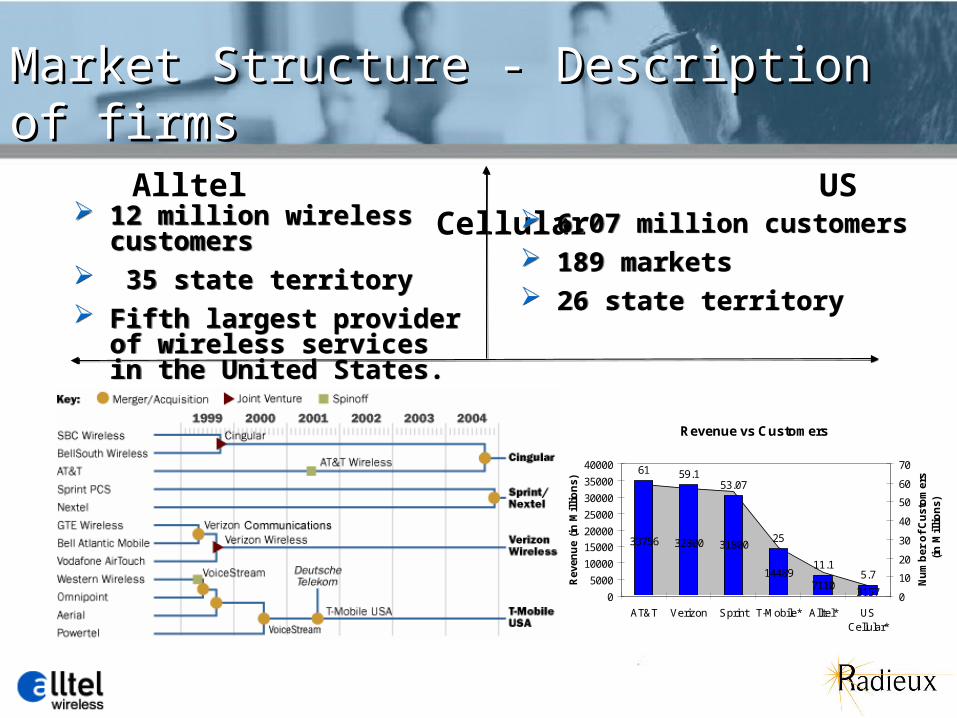
Market Structure - Description of firmsMarket Structure - Description of firms
Sprint Nextel T- Mobile
Market Structure - Description of firmsMarket Structure - Description of firms
Alltel US Cellular
12 million wireless customers 35 state territory Fifth largest provider of
wireless services in the United States.
12 million wireless customers 35 state territory Fifth largest provider of
wireless services in the United States.
6.07 million customers 189 markets 26 state territory
6.07 million customers 189 markets 26 state territory
Revenue vs Customers
33756 32800 31800
144897110
3157
61 59.153.07
25
11.15.7
0
5000
10000
15000
20000
25000
30000
35000
40000
AT&T Verizon Sprint T-Mobile* Alltel* USCellular*
Rev
enu
e (i
n M
illi
on
s)
0
10
20
30
40
50
60
70
Nu
mb
er o
f C
ust
om
ers
(in
Mil
lio
ns)
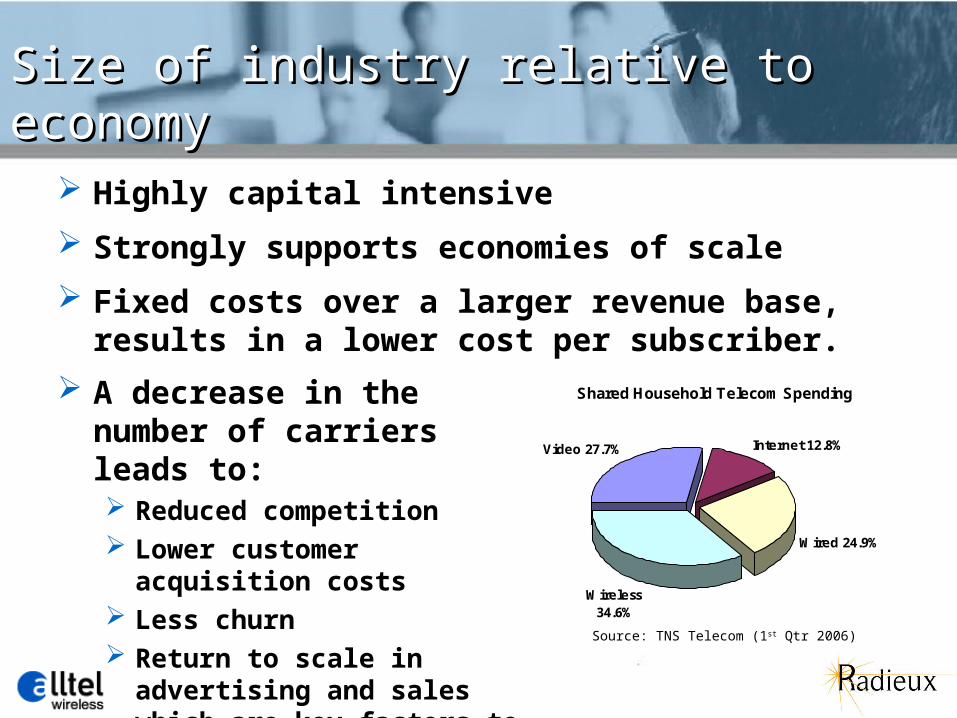
Size of industry relative to economySize of industry relative to economy
Highly capital intensive
Strongly supports economies of scale
Fixed costs over a larger revenue base, results in a lower cost per subscriber.
Shared Household Telecom Spending
Video 27.7% Internet 12.8%
Wired 24.9%
Wireless 34.6%
A decrease in the number of carriers leads to: Reduced competition Lower customer acquisition costs Less churn Return to scale in advertising and
sales which are key factors to drive revenue growth and profitability.
Source: TNS Telecom (1st Qtr 2006)
Demand FactorsDemand Factors
Voice
Higher data speed
Multi-useGamesVideoAudioEmailInternet
Bundled packages
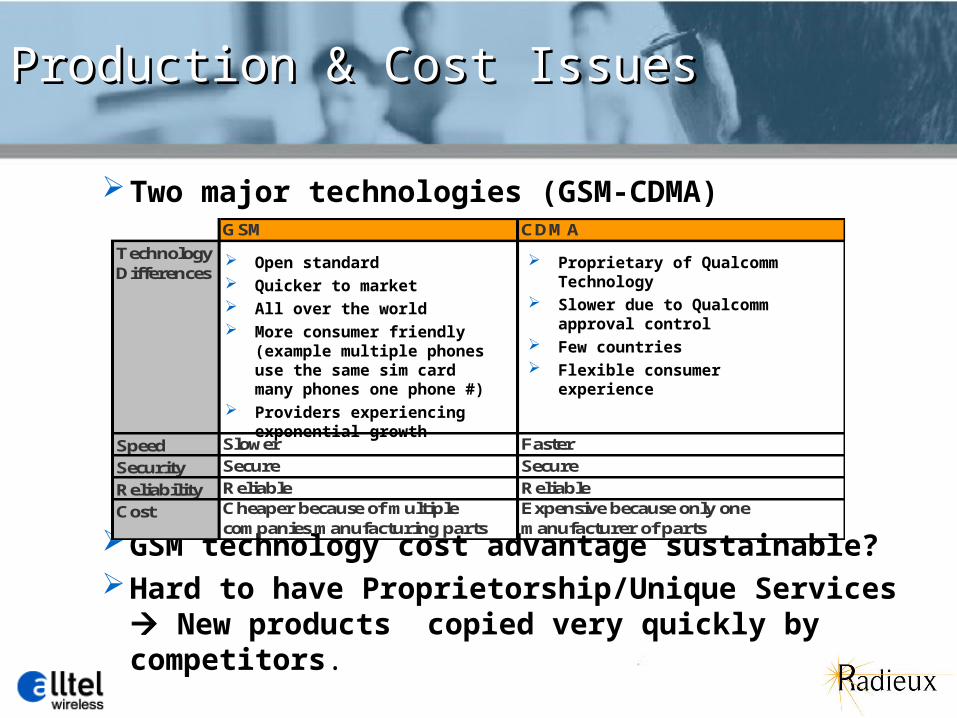
Production & Cost IssuesProduction & Cost Issues
Two major technologies (GSM-CDMA)
GSM technology cost advantage sustainable? Hard to have Proprietorship/Unique Services New
products copied very quickly by competitors.
Open standard Quicker to market All over the world More consumer friendly (example
multiple phones use the same sim card many phones one phone #)
Providers experiencing exponential growth
Proprietary of Qualcomm Technology Slower due to Qualcomm approval
control Few countries Flexible consumer experience
GSM CDMA
Speed Slower Faster
Security Secure Secure
Reliability Reliable Reliable
Cost Cheaper because of multiple companies manufacturing parts
Expensive because only one manufacturer of parts
Technology Differences
Non-Economic FactorsNon-Economic Factors
Health Issues
Interference with Sleep
Drag on the Commute
Government Regulations
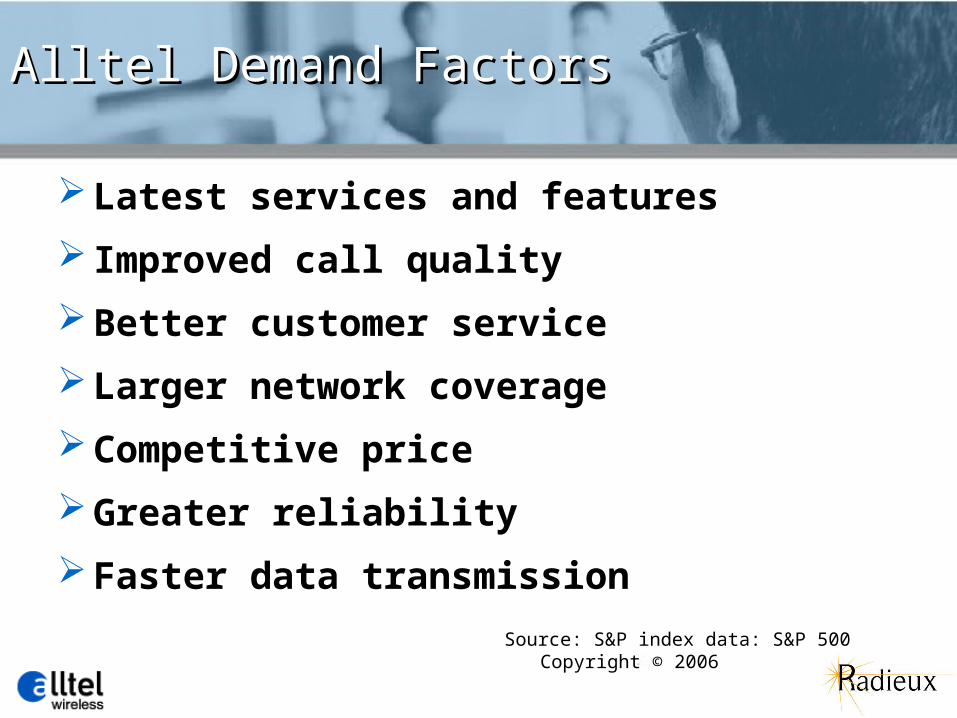
Alltel Demand FactorsAlltel Demand Factors
Source: S&P index data: S&P 500 Copyright © 2006
Latest services and features
Improved call quality
Better customer service
Larger network coverage
Competitive price
Greater reliability
Faster data transmission
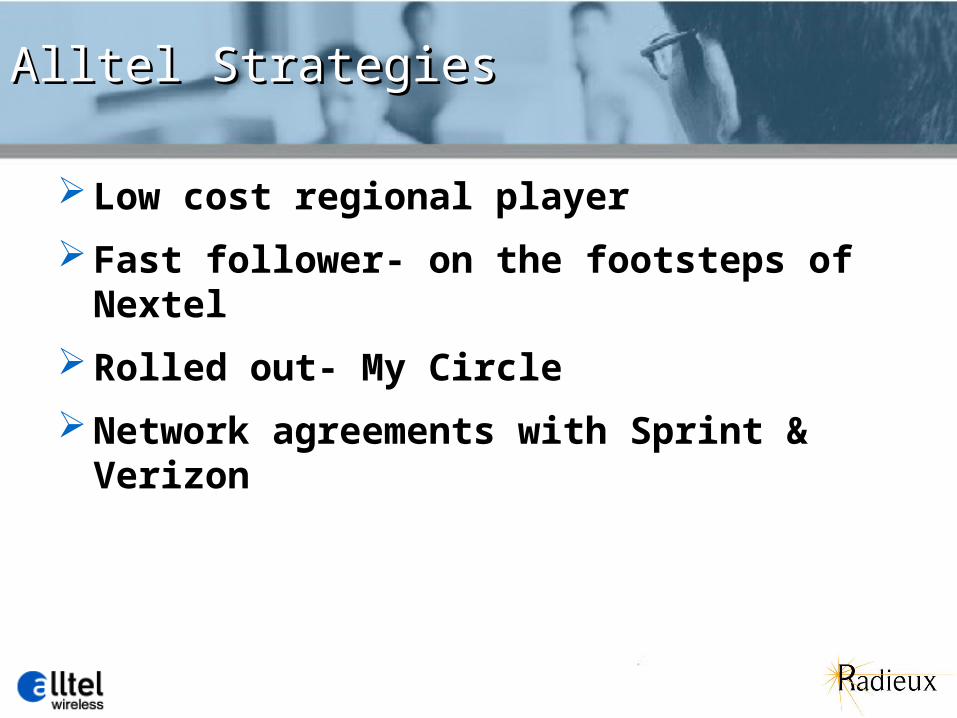
Alltel StrategiesAlltel Strategies
Low cost regional player
Fast follower- on the footsteps of Nextel
Rolled out- My Circle
Network agreements with Sprint & Verizon
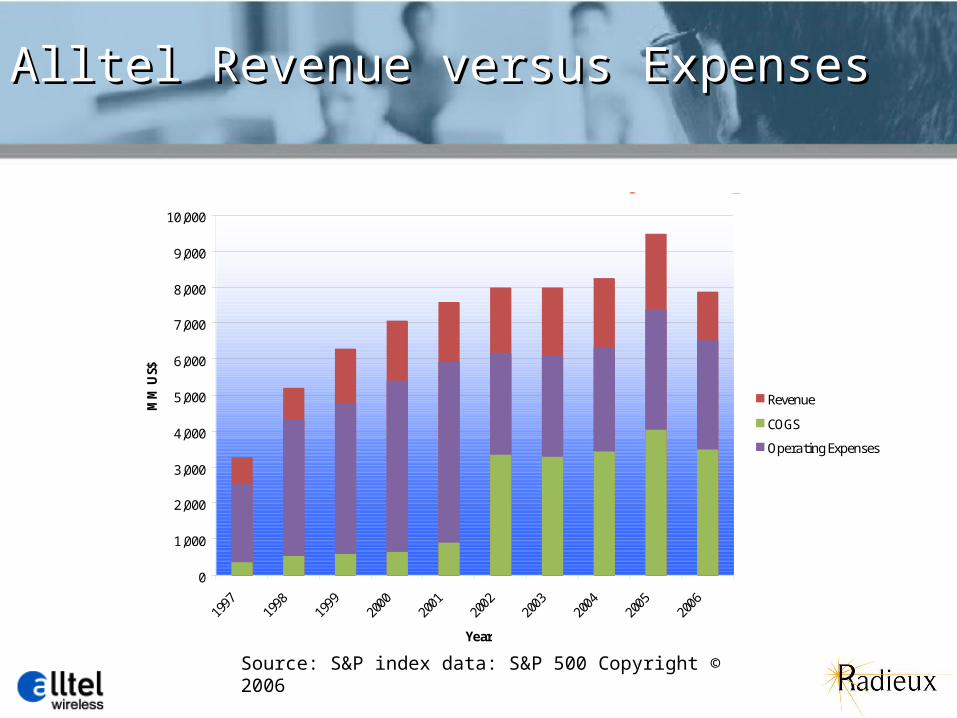
Alltel Revenue versus ExpensesAlltel Revenue versus Expenses
UPDATE Required
0
1,000
2,000
3,000
4,000
5,000
6,000
7,000
8,000
9,000
10,000
1997
1998
1999
2000
2001
2002
2003
2004
2005
2006
Year
MM
US$
Revenue
COGS
Operating Expenses
Source: S&P index data: S&P 500 Copyright © 2006

ForecastsForecasts
Projections Projections RecommendationsRecommendations
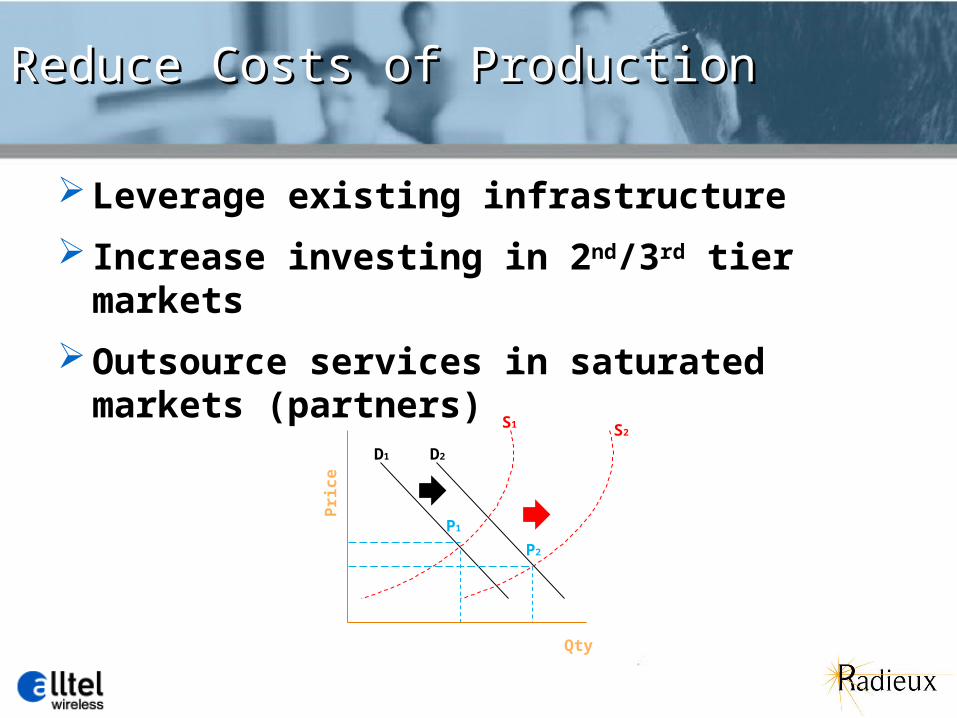
Reduce Costs of ProductionReduce Costs of Production
Leverage existing infrastructure
Increase investing in 2nd/3rd tier markets
Outsource services in saturated markets (partners)
S1 S2
D1 D2
P1
P2
Pri
ce
Qty
Expansion / New ProductsExpansion / New Products
EVDO- rev.A network, evolution of the highest speed network
Increase investment in high speed network - will provide framework for convergence and bundling of services
Position for merger opportunities (must have national footprint, must show increasing margins)
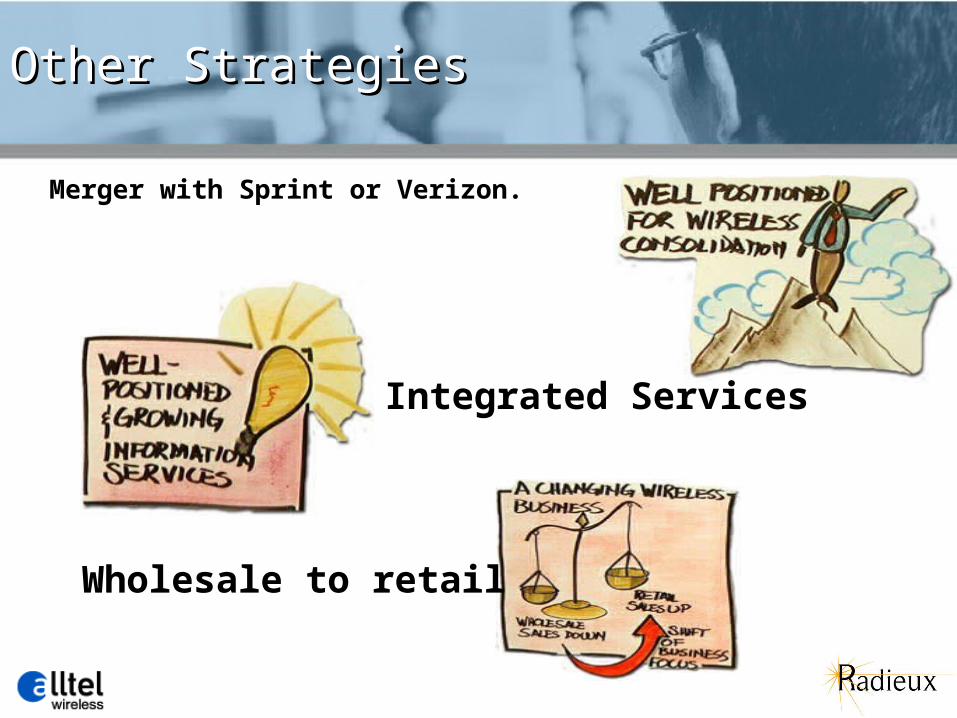
Other StrategiesOther Strategies
Merger with Sprint or Verizon.
Integrated Services
Wholesale to retail
The US has the largest and most technologically powerful economy in the world, with a per capita GDP of $45,700
U.S. consumers are paying less, using wireless more and have more choices than any others in the world.
The U.S. telecommunications market grew, with total revenues reaching $856.9 billion in 2005 – up 8.9 percent for the year – and is projected to reach over $1 trillion by 2009. [TIA Telecom Market Review and Forecast]
Description of Current EnvironmentDescription of Current Environment
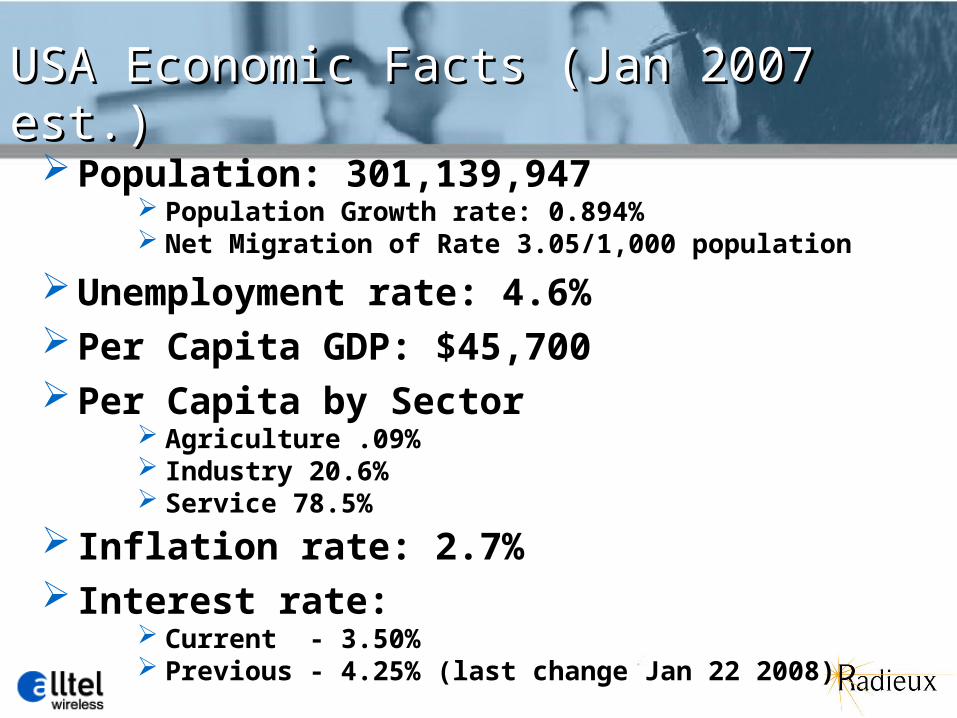
Population: 301,139,947 Population Growth rate: 0.894% Net Migration of Rate 3.05/1,000 population
Unemployment rate: 4.6% Per Capita GDP: $45,700 Per Capita by Sector
Agriculture .09% Industry 20.6% Service 78.5%
Inflation rate: 2.7%
Interest rate: Current - 3.50% Previous - 4.25% (last change Jan 22 2008)
USA Economic Facts (Jan 2007 est.)USA Economic Facts (Jan 2007 est.)
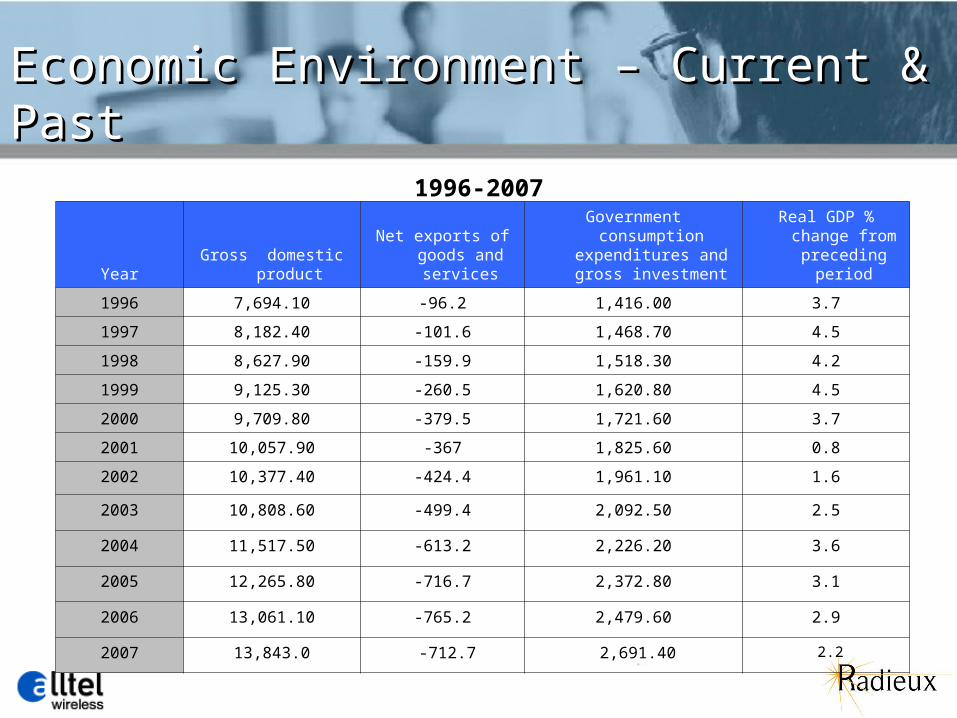
Economic Environment – Current & PastEconomic Environment – Current & Past
1996-2007
Year Gross domestic
product
Net exports of goods and services
Government consumption expenditures and gross investment
Real GDP % change from preceding
period
1996 7,694.10 -96.2 1,416.00 3.7
1997 8,182.40 -101.6 1,468.70 4.5
1998 8,627.90 -159.9 1,518.30 4.2
1999 9,125.30 -260.5 1,620.80 4.5
2000 9,709.80 -379.5 1,721.60 3.7
2001 10,057.90 -367 1,825.60 0.8
2002 10,377.40 -424.4 1,961.10 1.6
2003 10,808.60 -499.4 2,092.50 2.5
2004 11,517.50 -613.2 2,226.20 3.6
2005 12,265.80 -716.7 2,372.80 3.1
2006 13,061.10 -765.2 2,479.60 2.9
2007 13,843.0 -712.7 2,691.40 2.2
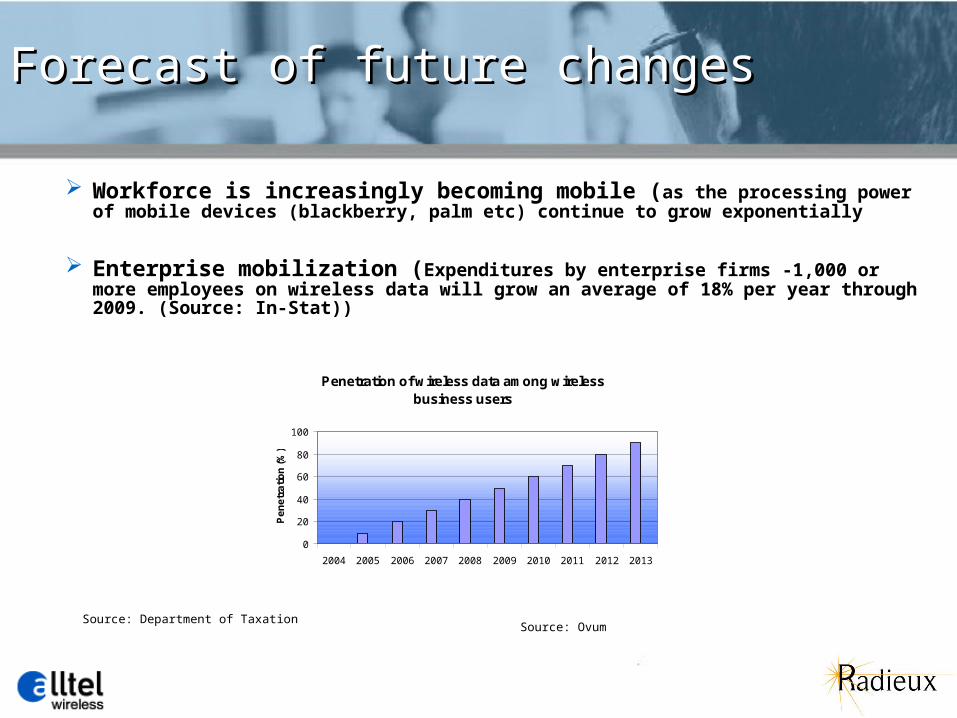
Workforce is increasingly becoming mobile (as the processing power of mobile devices (blackberry, palm etc) continue to grow exponentially
Enterprise mobilization (Expenditures by enterprise firms -1,000 or more employees on wireless data will grow an average of 18% per year through 2009. (Source: In-Stat))
Penetration of wireless data among wireless business users
0
20
40
60
80
100
2004 2005 2006 2007 2008 2009 2010 2011 2012 2013
Pe
ne
tra
tio
n (
%)
Source: Ovum
Source: Department of Taxation
Forecast of future changesForecast of future changes
Macro Impact on Firm and IndustryMacro Impact on Firm and Industry
Consolidation within industry
Growth in economy
Rising demand for latest technology
“Everyone wants the phone to do everything with the fastest service. Alltel's challenge is to find the appropriate packaging prices for their "sub-prime"/pre-paid customers.”
Kevin L. Beebe
Ex- President & CEO
ALLTEL Corporation
Macro Impact on Firm and IndustryMacro Impact on Firm and Industry
![Performance Evaluation of Face Recognition based on ... · using various state- of-the-art feature extraction methods. Navaneeth Bodla et al., [21] developed a deep heterogeneous](https://static.fdocuments.in/doc/165x107/5f08d5a37e708231d423f2eb/performance-evaluation-of-face-recognition-based-on-using-various-state-of-the-art.jpg)