© 2008 Nelson Education Ltd. N. G R E G O R Y M A N K I W R O N A L D D. K N E E B O N E K E N N E...
43
© 2008 Nelson Education Ltd. N. G R E G O R Y M A N K I W R O N A L D D. K N E E B O N E K E N N E T H J. M c K ENZIE NICHOLAS ROWE PowerPoint ® Slides by Ron Cronovich Canadian adaptation by Marc Prud’Homme 5 Measuring a Nation’s Measuring a Nation’s Income Income P R I N C I P L E S O F F O U R T H C A N A D I A N E D I T I O N M ACROECONOM ICS
-
Upload
emmeline-paul -
Category
Documents
-
view
216 -
download
0
Transcript of © 2008 Nelson Education Ltd. N. G R E G O R Y M A N K I W R O N A L D D. K N E E B O N E K E N N E...
© 2008 Nelson Education Ltd.
N. G R E G O R Y M A N K I W
R O N A L D D. K N E E B O N E
K E N N E T H J. M c K ENZIE
NICHOLAS ROWE
PowerPoint® Slides by Ron Cronovich
Canadian adaptation by Marc Prud’Homme
5 Measuring a Nation’s IncomeMeasuring a Nation’s Income
P R I N C I P L E S O F
F O U R T H C A N A D I A N E D I T I O N
MACROECONOMICS
© 2008 Nelson Education Ltd. 2
In this chapter, look for the answers to these questions:
What is Gross Domestic Product (GDP)?
How is GDP related to a nation’s total income and spending?
What are the components of GDP?
How is GDP corrected for inflation?
Does GDP measure society’s well-being?

© 2008 Nelson Education Ltd. 3
Micro vs. Macro
Microeconomics: The study of how individual households and firms make decisions, interact with one another in markets.
Macroeconomics: The study of the economy as a whole.
We begin our study of macroeconomics with the country’s total income and expenditure.
© 2008 Nelson Education Ltd. 4
Income and Expenditure
Gross Domestic Product (GDP) measures two things at one:
• total income of everyone in the economy.
• total expenditure on the economy’s output of goods & services.
For the economy as a whole,
income equals expenditureincome equals expenditure, because
every dollar of expenditure by a buyer
is a dollar of income for the seller.
For the economy as a whole,
income equals expenditureincome equals expenditure, because
every dollar of expenditure by a buyer
is a dollar of income for the seller.
© 2008 Nelson Education Ltd. 5
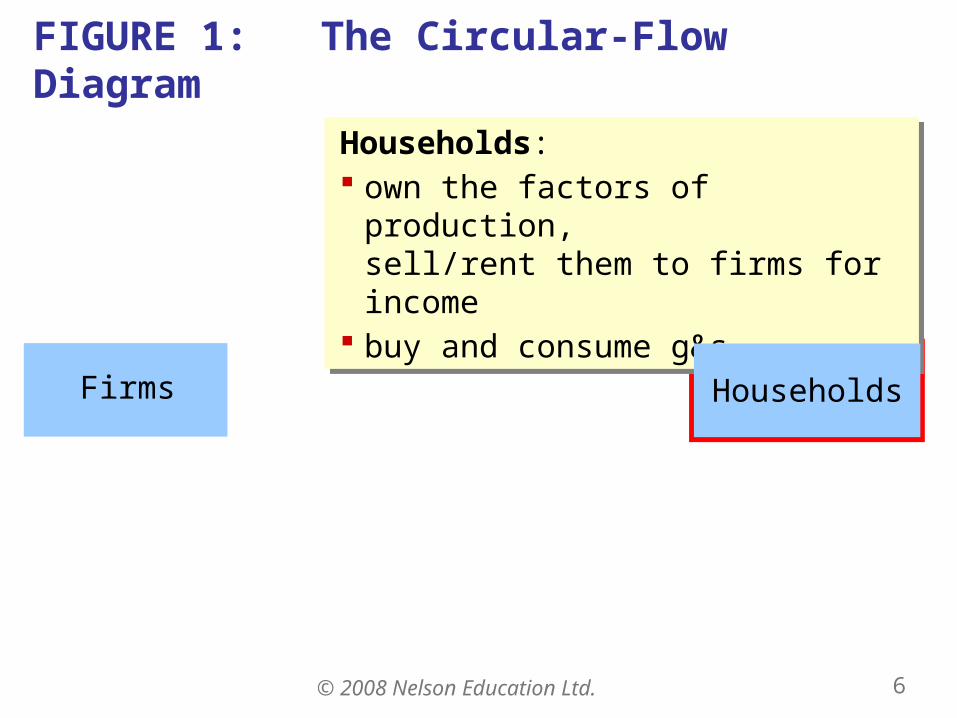
The Circular-Flow Diagram
is a simple depiction of the macroeconomy.
illustrates GDP as spending, revenue, factor payments, and income.
First, some preliminaries:
• Factors of production are inputs like labour, land, capital, and natural resources.
• Factor payments are payments to the factors of production. (e.g., wages, rent)
© 2008 Nelson Education Ltd. 6
FIGURE 1: The Circular-Flow Diagram
Households: own the factors of production,
sell/rent them to firms for income buy and consume g&s
Households: own the factors of production,
sell/rent them to firms for income buy and consume g&s
HouseholdsFirms
© 2008 Nelson Education Ltd. 7
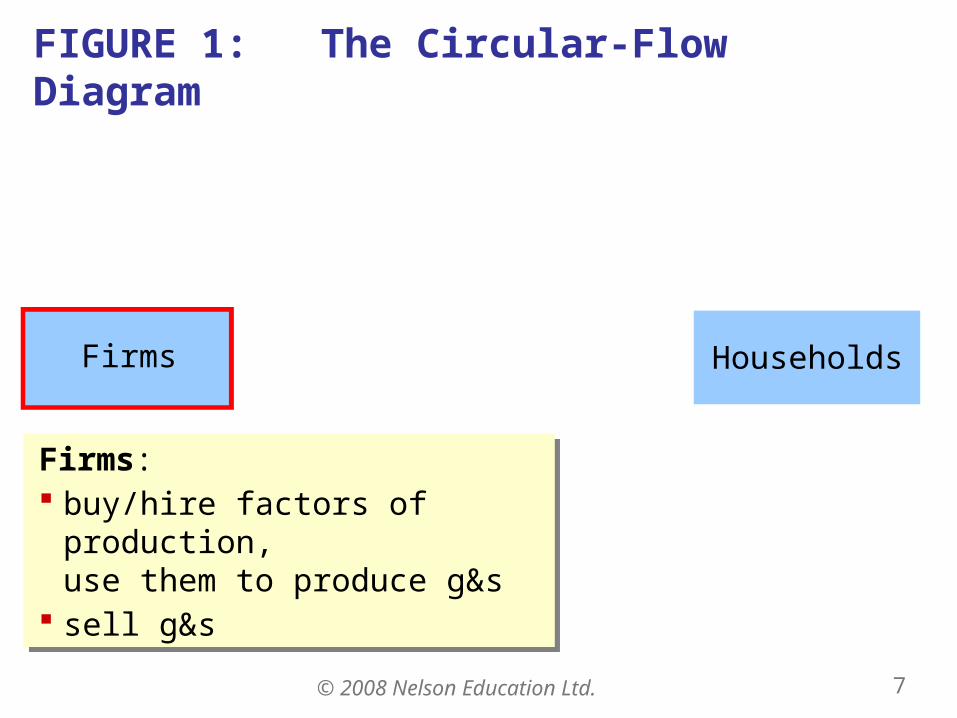
FIGURE 1: The Circular-Flow Diagram
HouseholdsFirms
Firms: buy/hire factors of production,
use them to produce g&s sell g&s
Firms: buy/hire factors of production,
use them to produce g&s sell g&s

© 2008 Nelson Education Ltd. 8
FIGURE 1: The Circular-Flow Diagram
Markets for Factors of Production
HouseholdsFirms
Income (=GDP)Wages, rent, profit (=GDP)
Factors of production
labour, land, capital
Spending (=GDP)
G & S bought
G & S sold
Revenue (=GDP)Markets for
Goods & Services
© 2008 Nelson Education Ltd. 9
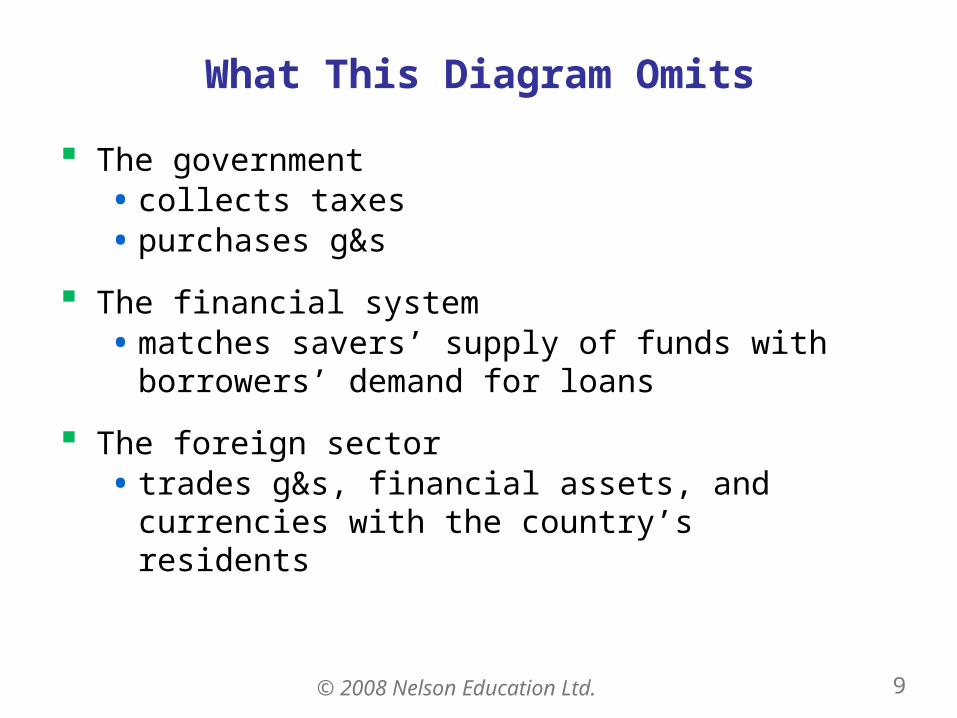
What This Diagram Omits
The government• collects taxes• purchases g&s
The financial system• matches savers’ supply of funds with borrowers’
demand for loans
The foreign sector• trades g&s, financial assets, and currencies with
the country’s residents
© 2008 Nelson Education Ltd. 10
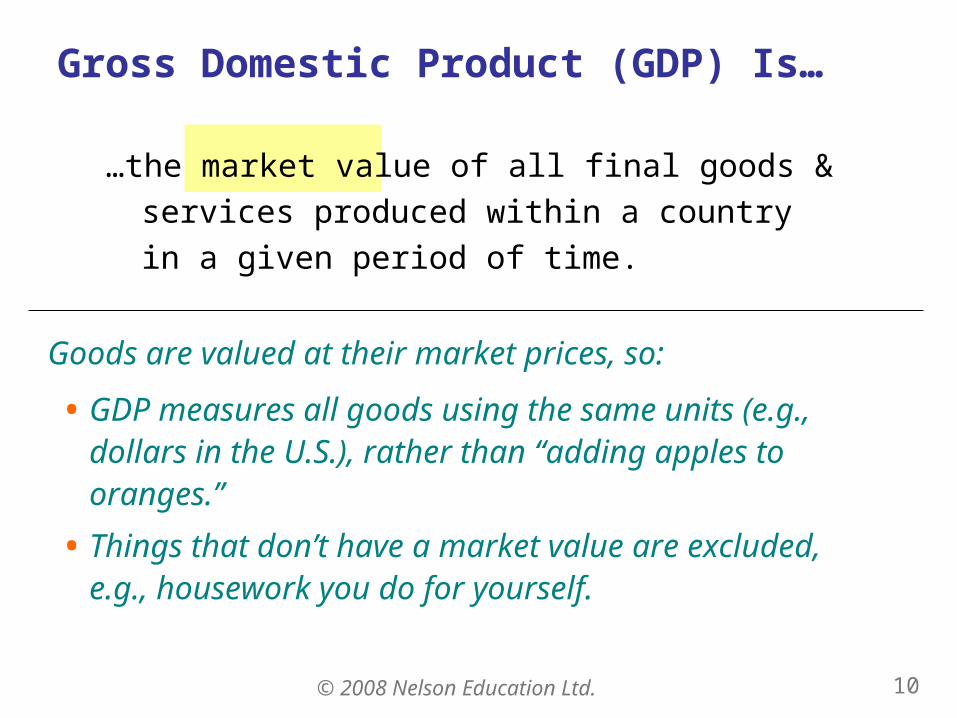
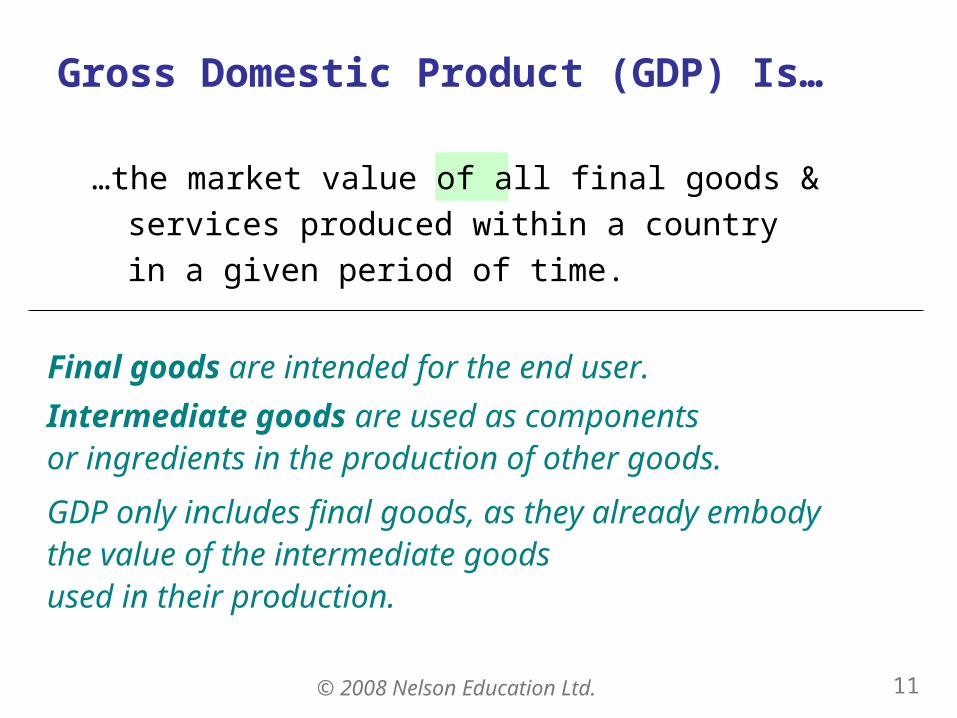
…the market value of all final goods & services
produced within a country
in a given period of time.
Gross Domestic Product (GDP) Is…
Goods are valued at their market prices, so:
• GDP measures all goods using the same units (e.g., dollars in the U.S.), rather than “adding apples to oranges.”
• Things that don’t have a market value are excluded, e.g., housework you do for yourself.
© 2008 Nelson Education Ltd. 11
…the market value of all final goods & services
produced within a country
in a given period of time.
Gross Domestic Product (GDP) Is…
Final goods are intended for the end user. Intermediate goods are used as components or ingredients in the production of other goods.
GDP only includes final goods, as they already embody the value of the intermediate goods used in their production.
© 2008 Nelson Education Ltd. 12
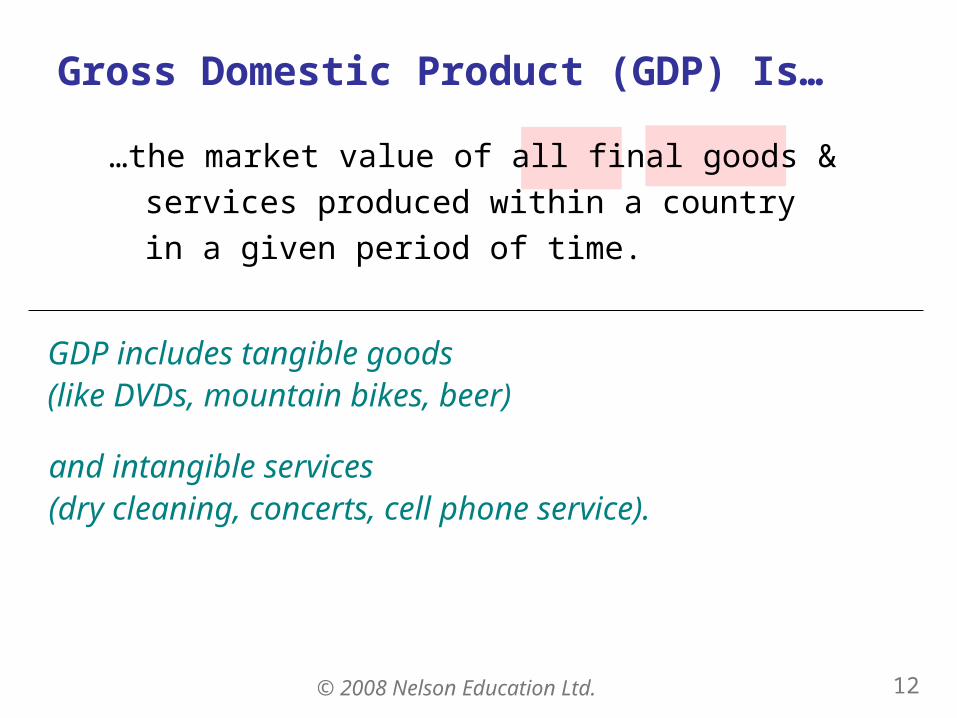
…the market value of all final goods & services
produced within a country
in a given period of time.
Gross Domestic Product (GDP) Is…
GDP includes tangible goods (like DVDs, mountain bikes, beer)
and intangible services (dry cleaning, concerts, cell phone service).

© 2008 Nelson Education Ltd. 13
…the market value of all final goods & services
produced within a country
in a given period of time.
Gross Domestic Product (GDP) Is…
GDP includes currently produced goods, not goods produced in the past.
© 2008 Nelson Education Ltd. 14
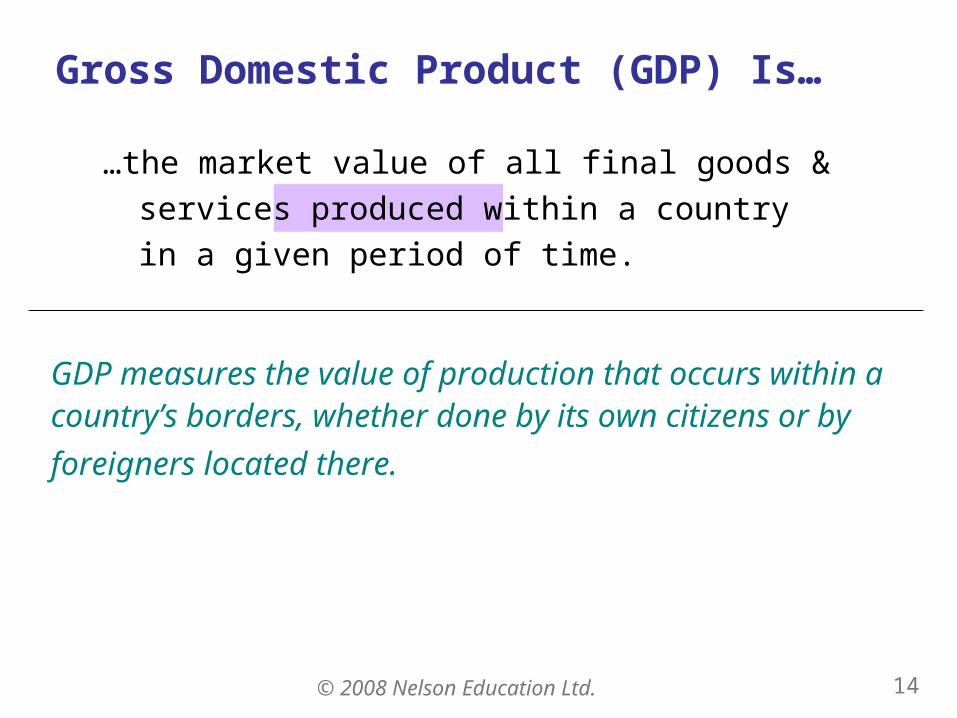
…the market value of all final goods & services
produced within a country
in a given period of time.
Gross Domestic Product (GDP) Is…
GDP measures the value of production that occurs within a country’s borders, whether done by its own citizens or by
foreigners located there.

© 2008 Nelson Education Ltd. 15
…the market value of all final goods & services
produced within a country
in a given period of time.
Gross Domestic Product (GDP) Is…
usually a year or a quarter (3 months).
© 2008 Nelson Education Ltd. 16
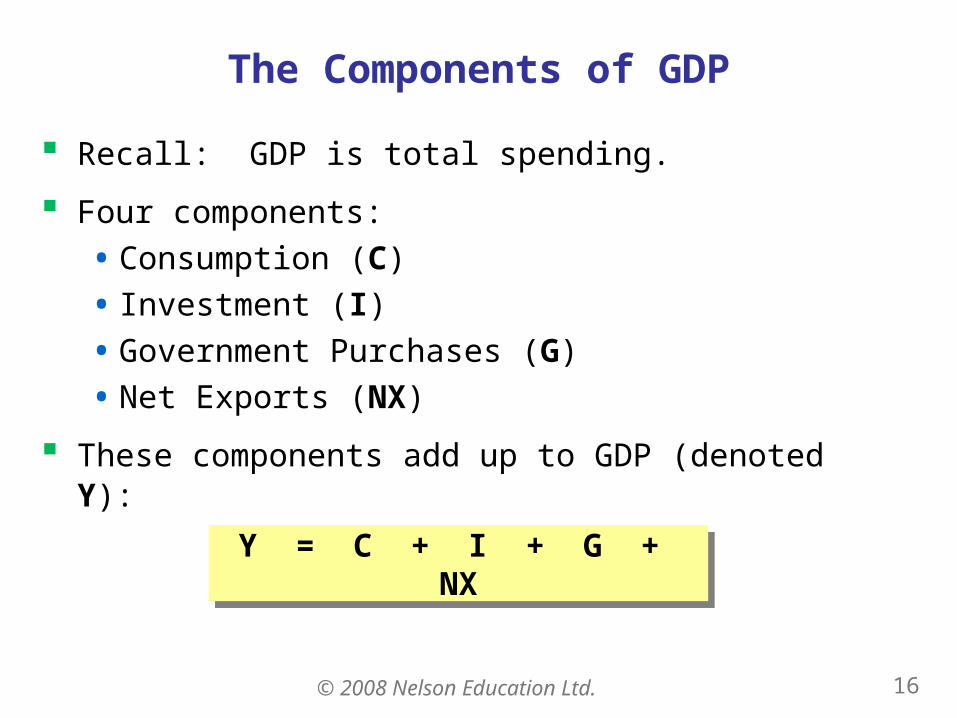
The Components of GDP
Recall: GDP is total spending.
Four components:
• Consumption (C)
• Investment (I)
• Government Purchases (G)
• Net Exports (NX)
These components add up to GDP (denoted Y):
Y = C + I + G + NXY = C + I + G + NX

© 2008 Nelson Education Ltd. 17
Consumption (C)
is total spending by households on goods & services.
Note on housing costs:
• For renters, consumption includes rent payments.
• For homeowners, consumption includes the imputed rental value of the house, but not the purchase price or mortgage payments.
© 2008 Nelson Education Ltd. 18
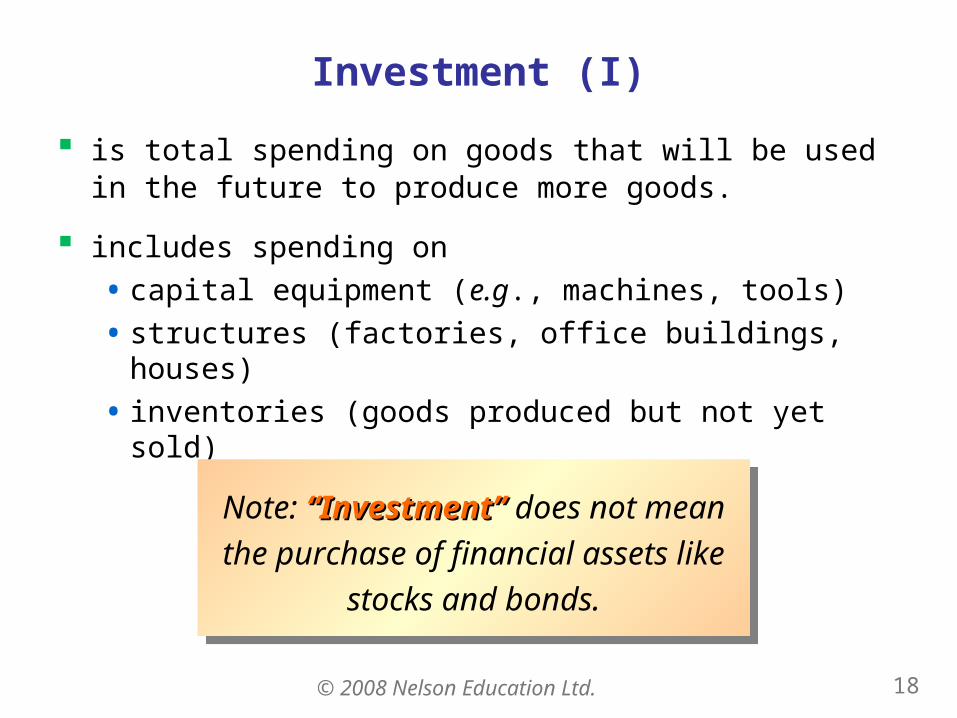
Investment (I)
is total spending on goods that will be used in the future to produce more goods.
includes spending on
• capital equipment (e.g., machines, tools)
• structures (factories, office buildings, houses)
• inventories (goods produced but not yet sold)
Note: “Investment”“Investment” does not mean
the purchase of financial assets like
stocks and bonds.
Note: “Investment”“Investment” does not mean
the purchase of financial assets like
stocks and bonds.
© 2008 Nelson Education Ltd. 19
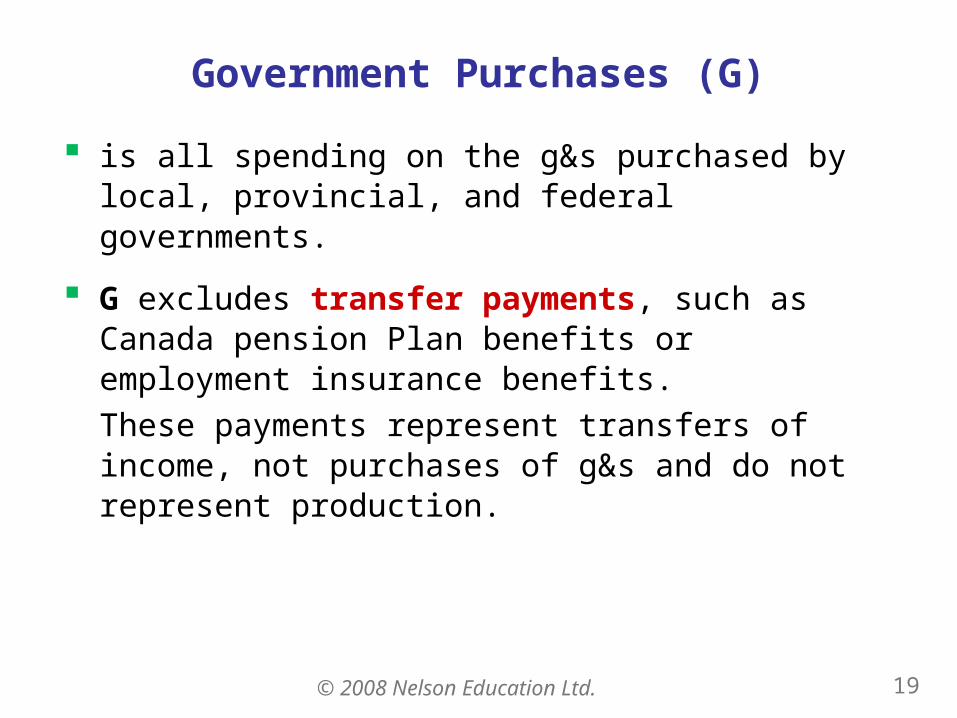
Government Purchases (G)
is all spending on the g&s purchased by local, provincial, and federal governments.
G excludes transfer payments, such as Canada pension Plan benefits or employment insurance benefits.
These payments represent transfers of income, not purchases of g&s and do not represent production.
© 2008 Nelson Education Ltd. 20
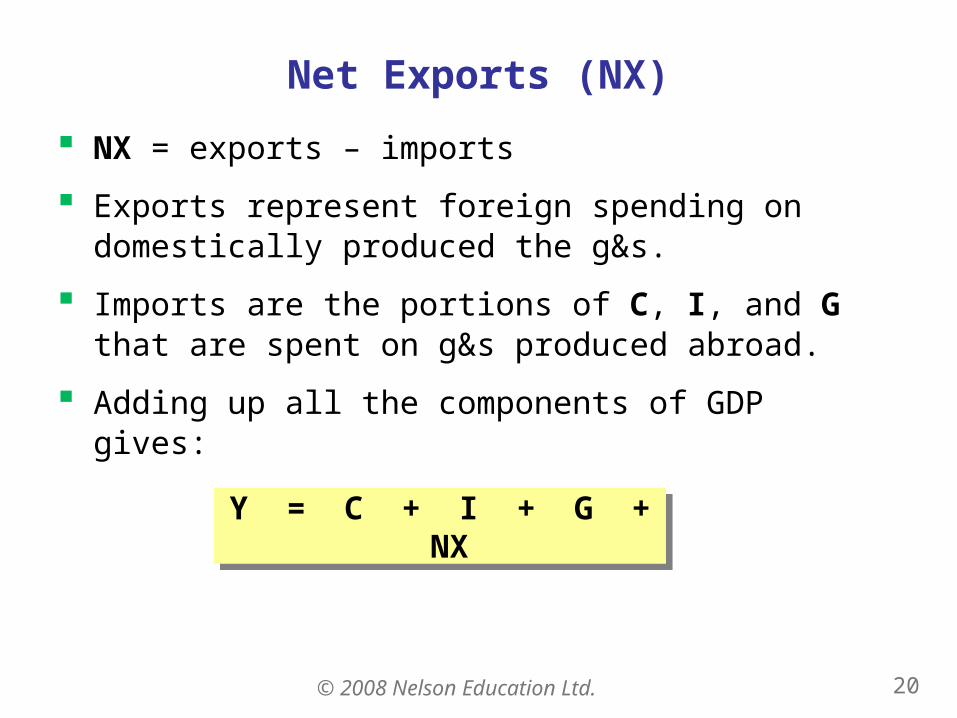
Net Exports (NX)
NX = exports – imports
Exports represent foreign spending on domestically produced the g&s.
Imports are the portions of C, I, and G that are spent on g&s produced abroad.
Adding up all the components of GDP gives:
Y = C + I + G + NXY = C + I + G + NX

© 2008 Nelson Education Ltd. 21
Canadian GDP and Its Components, 2005
1,605
8,148
9,105
23,457
$42,315
per person
4
19
21
55
100.0
% of GDP
52
264
295
760
$1,371
billions
NX
G
I
C
Y
AA CC TT II VV E LE L EE AA RR NN II NN G G 11: : GDP and its componentsGDP and its components
22
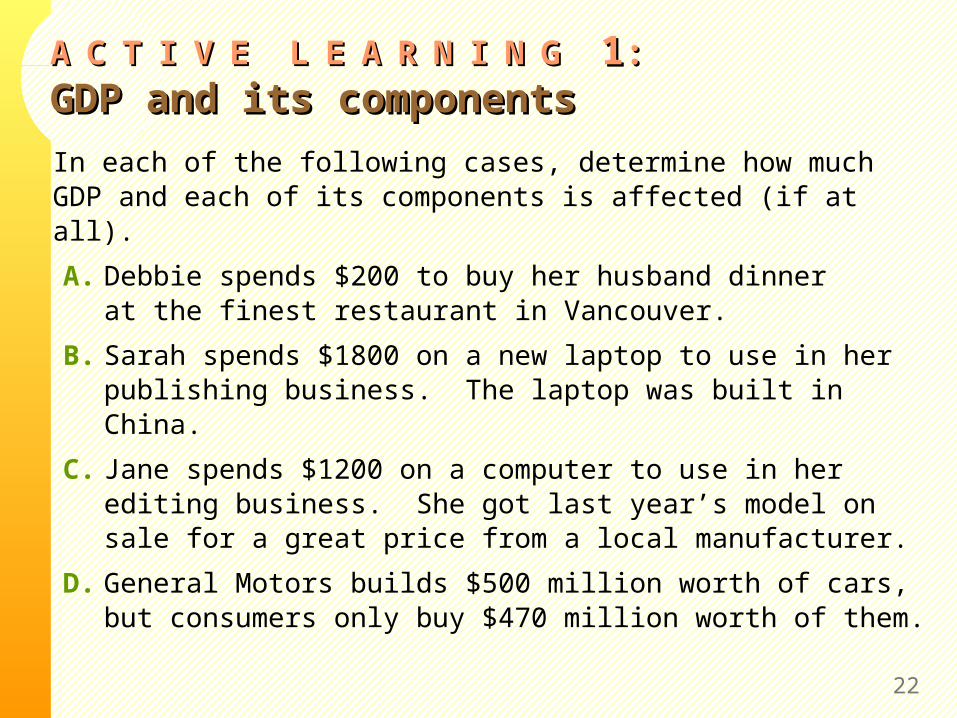
In each of the following cases, determine how much GDP and each of its components is affected (if at all).
A. Debbie spends $200 to buy her husband dinner at the finest restaurant in Vancouver.
B. Sarah spends $1800 on a new laptop to use in her publishing business. The laptop was built in China.
C. Jane spends $1200 on a computer to use in her editing business. She got last year’s model on sale for a great price from a local manufacturer.
D. General Motors builds $500 million worth of cars, but consumers only buy $470 million worth of them.

AA CC TT II VV E LE L EE AA RR NN II NN G G 11: : AnswersAnswers
23
A. Debbie spends $200 to buy her husband dinner at the finest restaurant in Vancouver.
Consumption and GDP rise by $200.
B. Sarah spends $1800 on a new laptop to use in her publishing business. The laptop was built in China.
Investment rises by $1800, net exports fall by $1800, GDP is unchanged.

AA CC TT II VV E LE L EE AA RR NN II NN G G 11: : AnswersAnswers
24
C. Jane spends $1200 on a computer to use in her editing business. She got last year’s model on sale for a great price from a local manufacturer.
Current GDP and investment do not change, because the computer was built last year.
D. General Motors builds $500 million worth of cars, but consumers only buy $470 million of them.
Consumption rises by $470 million, inventory investment rises by $30 million, and GDP rises by $500 million.
© 2008 Nelson Education Ltd. 25
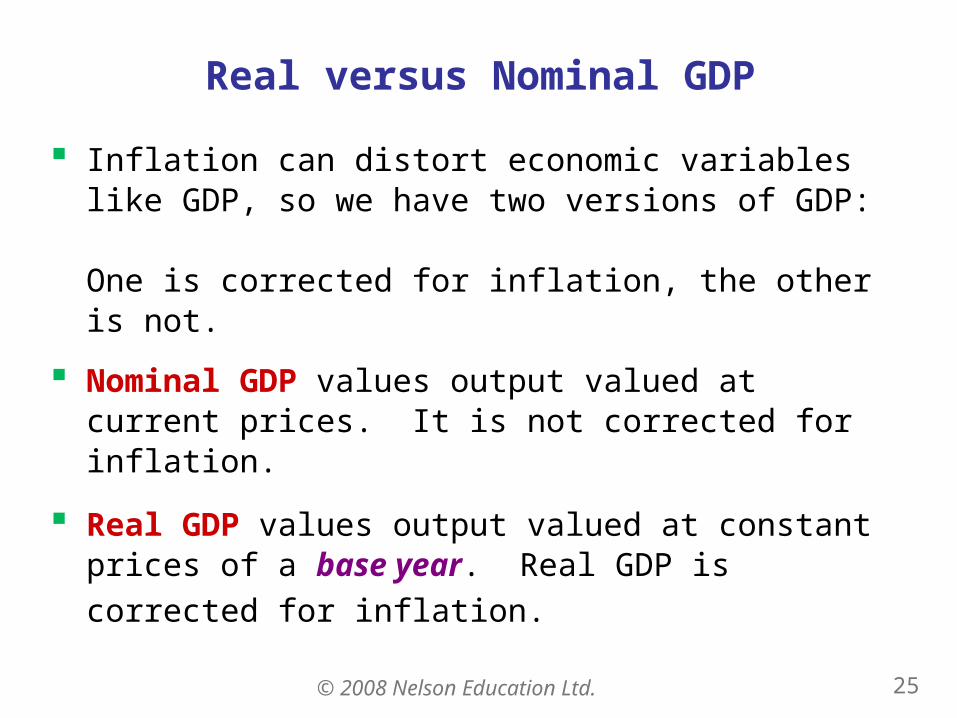
Real versus Nominal GDP
Inflation can distort economic variables like GDP, so we have two versions of GDP: One is corrected for inflation, the other is not.
Nominal GDP values output valued at current prices. It is not corrected for inflation.
Real GDP values output valued at constant prices of a
base year. Real GDP is corrected for inflation.

© 2008 Nelson Education Ltd. 26
EXAMPLE:
Compute nominal GDP in each year:
2004: $10 x 400 + $2 x 1000 = $6,000
2005: $11 x 500 + $2.50 x 1100 = $8,250
2006: $12 x 600 + $3 x 1200 = $10,800
Pizza Latte
year P Q P Q
2004 $10 400 $2.00 1000
2005 $11 500 $2.50 1100
2006 $12 600 $3.00 1200
37.5%
Increase:
30.9%

© 2008 Nelson Education Ltd. 27
EXAMPLE:
Compute real GDP in each year, using 2002 as the base year:
Pizza Latte
year P Q P Q
2004 $10 400 $2.00 1000
2005 $11 500 $2.50 1100
2006 $12 600 $3.00 1200
20.0%
Increase:
16.7%
$10 $2.00
2004: $10 x 400 + $2 x 1000 = $6,000
2005: $10 x 500 + $2 x 1100 = $7,200
2006: $10 x 600 + $2 x 1200 = $8,400
© 2008 Nelson Education Ltd. 28
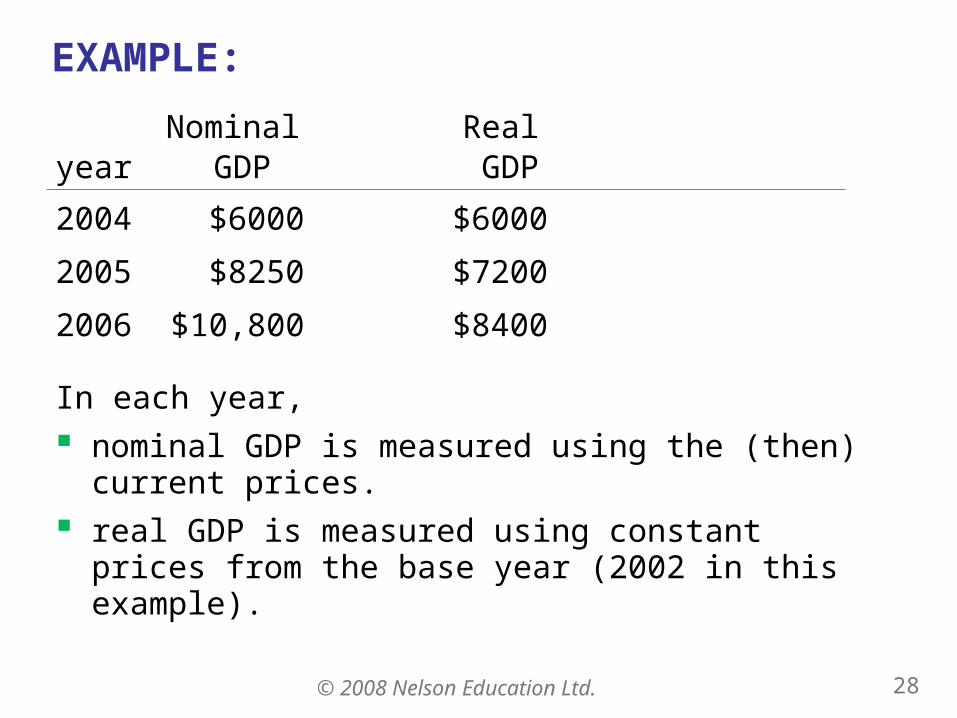
EXAMPLE:
In each year,
nominal GDP is measured using the (then) current prices.
real GDP is measured using constant prices from the base year (2002 in this example).
yearNominal
GDPReal GDP
2004 $6000 $6000
2005 $8250 $7200
2006 $10,800 $8400

© 2008 Nelson Education Ltd. 29
EXAMPLE:
The change in nominal GDP reflects both prices and quantities.
yearNominal
GDPReal GDP
2004 $6000 $6000
2005 $8250 $7200
2006 $10,800 $8400
20.0%
16.7%
37.5%
30.9%
The change in real GDP is the amount that GDP would change if prices were constant (i.e., if zero inflation).
Hence, real GDP is corrected for inflation.

© 2008 Nelson Education Ltd. 30
Real GDP in CanadaReal GDP in Canada
$0
$3,214
1965 1970 1975 1980 1985 1990 1995 2000 2005
Billions
0
200
400
600
800
1000
1200
1400
1600
1800
1981 1985 1989 1992 1996 2000 2004 2007
Real GDP (base year
2000)
Nominal GDP

© 2008 Nelson Education Ltd. 31
The GDP Deflator
The GDP deflator is a measure of the overall level of prices.
Definition:
One way to measure the economy’s inflation rate is to compute the percentage increase in the GDP deflator
from one year to the next.
GDP deflator = 100 x GDP deflator = 100 x nominal GDP
real GDP

© 2008 Nelson Education Ltd. 32
EXAMPLE:
Compute the GDP deflator in each year:
yearNominal
GDPReal GDP
GDP Deflator
2004 $6000 $6000
2005 $8250 $7200
2006 $10,800 $8400
2004: 100 x (6000/6000) = 100.0
100.0
2005: 100 x (8250/7200) = 114.6
114.6
2006: 100 x (10,800/8400) = 128.6
128.6
14.6%
12.2%

AA CC TT II VV E LE L EE AA RR NN II NN G G 22: : Computing GDPComputing GDP
33
Use the above data to solve these problems:
A. Compute nominal GDP in 2004.
B. Compute real GDP in 2005.
C. Compute the GDP deflator in 2006.
2004 (base yr) 2005 2006
P Q P Q P Q
good A $30 900 $31 1,000 $36 1050
good B $100 192 $102 200 $100 205
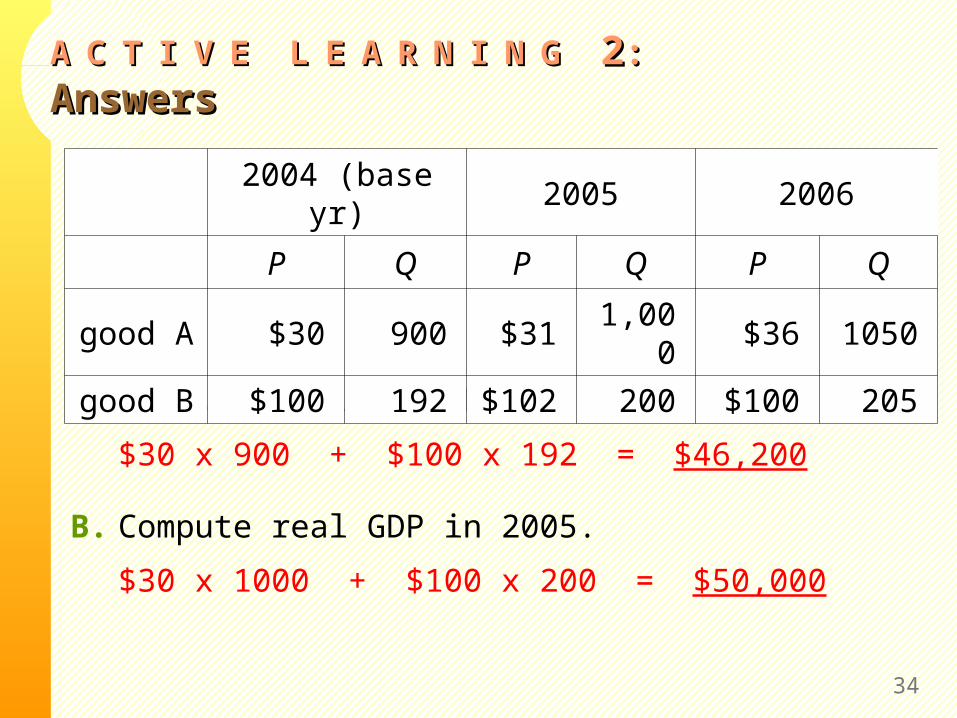
AA CC TT II VV E LE L EE AA RR NN II NN G G 22: : AnswersAnswers
34
A. Compute nominal GDP in 2004.
$30 x 900 + $100 x 192 = $46,200
B. Compute real GDP in 2005.
$30 x 1000 + $100 x 200 = $50,000
2004 (base yr) 2005 2006
P Q P Q P Q
good A $30 900 $31 1,000 $36 1050
good B $100 192 $102 200 $100 205
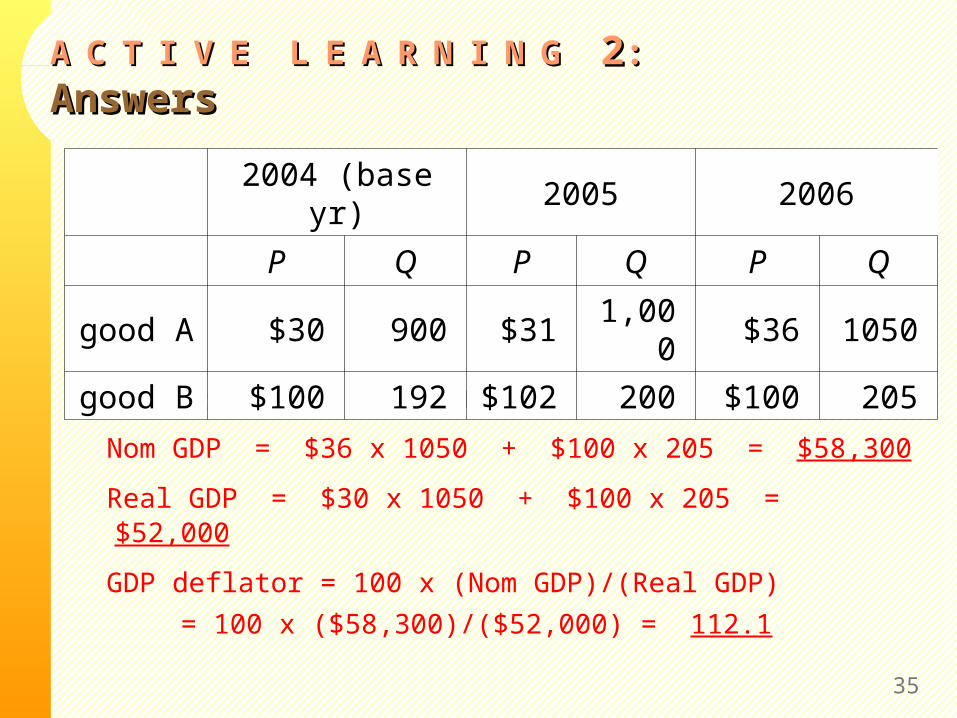
AA CC TT II VV E LE L EE AA RR NN II NN G G 22: : AnswersAnswers
35
C. Compute the GDP deflator in 2006.
Nom GDP = $36 x 1050 + $100 x 205 = $58,300
Real GDP = $30 x 1050 + $100 x 205 = $52,000
GDP deflator = 100 x (Nom GDP)/(Real GDP)
= 100 x ($58,300)/($52,000) = 112.1
2004 (base yr) 2005 2006
P Q P Q P Q
good A $30 900 $31 1,000 $36 1050
good B $100 192 $102 200 $100 205
© 2008 Nelson Education Ltd. 36
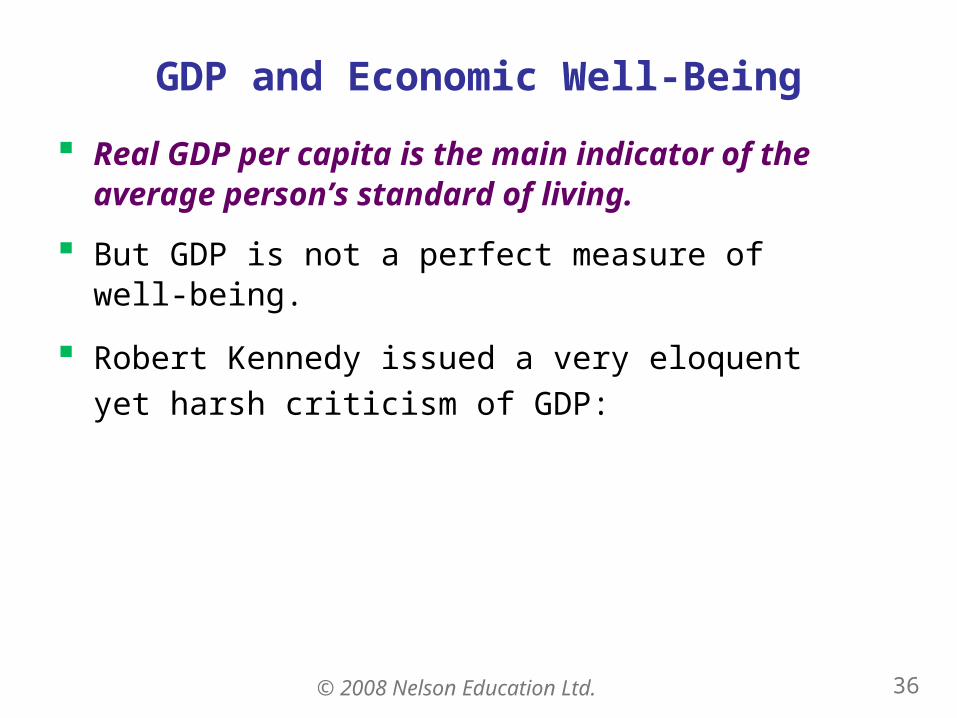
GDP and Economic Well-Being
Real GDP per capita is the main indicator of the average person’s standard of living.
But GDP is not a perfect measure of well-being.
Robert Kennedy issued a very eloquent
yet harsh criticism of GDP:

Gross Domestic Product…“… does not allow for the health of our children, the quality of their education, or the joy of their play. It does not include the beauty of our poetry or the strength of our marriages, the intelligence of our public debate or the integrity of our public officials. It measures neither our courage, nor our wisdom, nor our devotion to our country. It measures everything, in short, except that which makes life worthwhile, and it can tell us everything about America except why we are proud that we are Americans.”
- Senator Robert Kennedy, 1968
© 2008 Nelson Education Ltd. 38
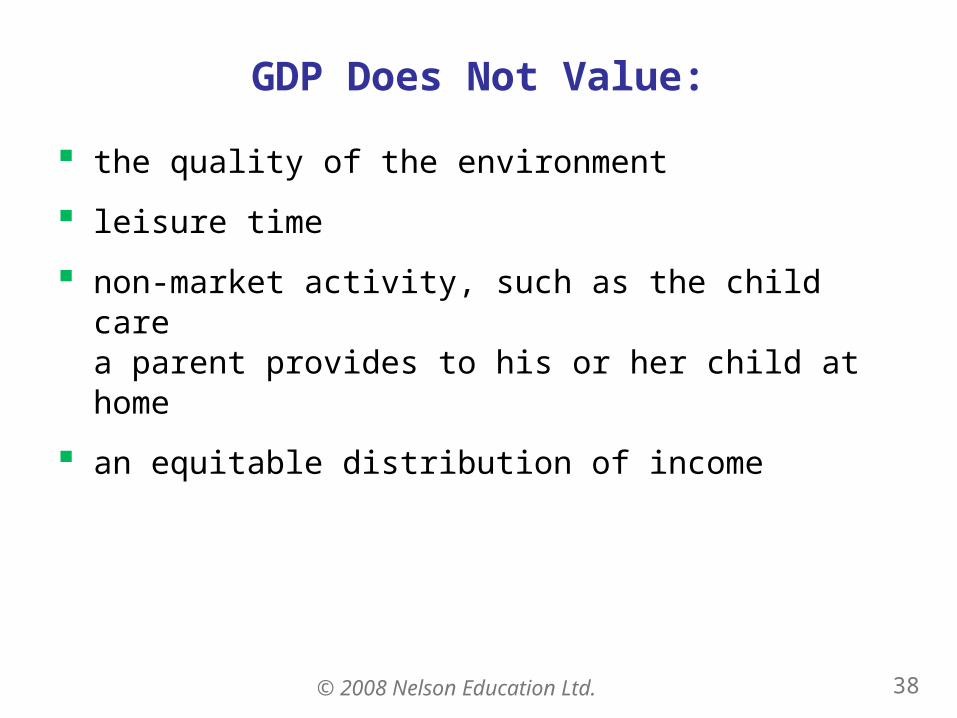
GDP Does Not Value:
the quality of the environment
leisure time
non-market activity, such as the child care a parent provides to his or her child at home
an equitable distribution of income
© 2008 Nelson Education Ltd. 39
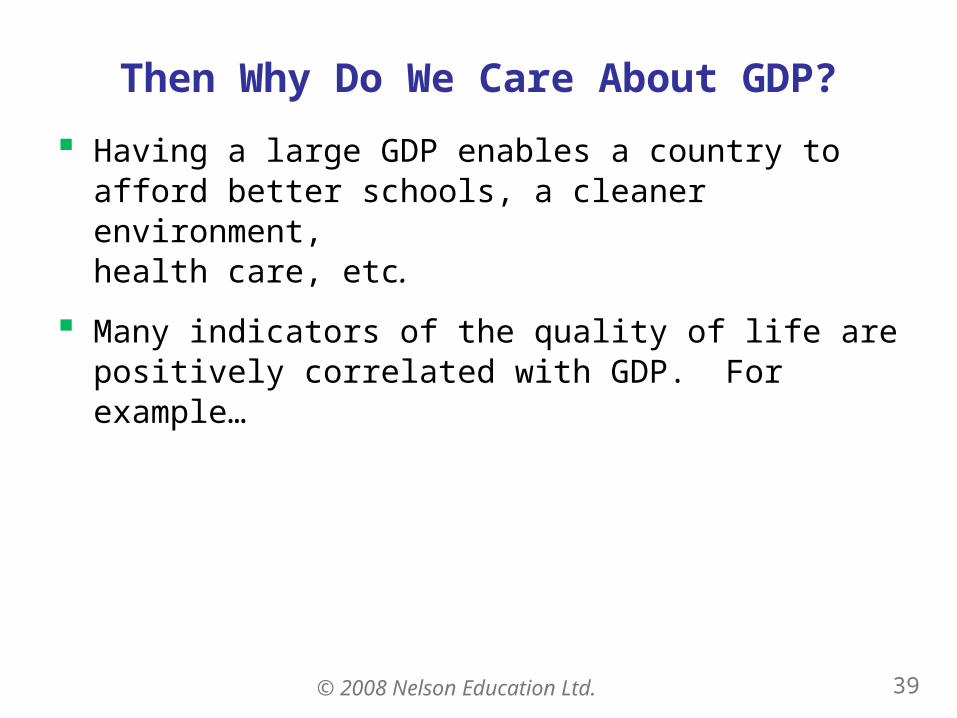
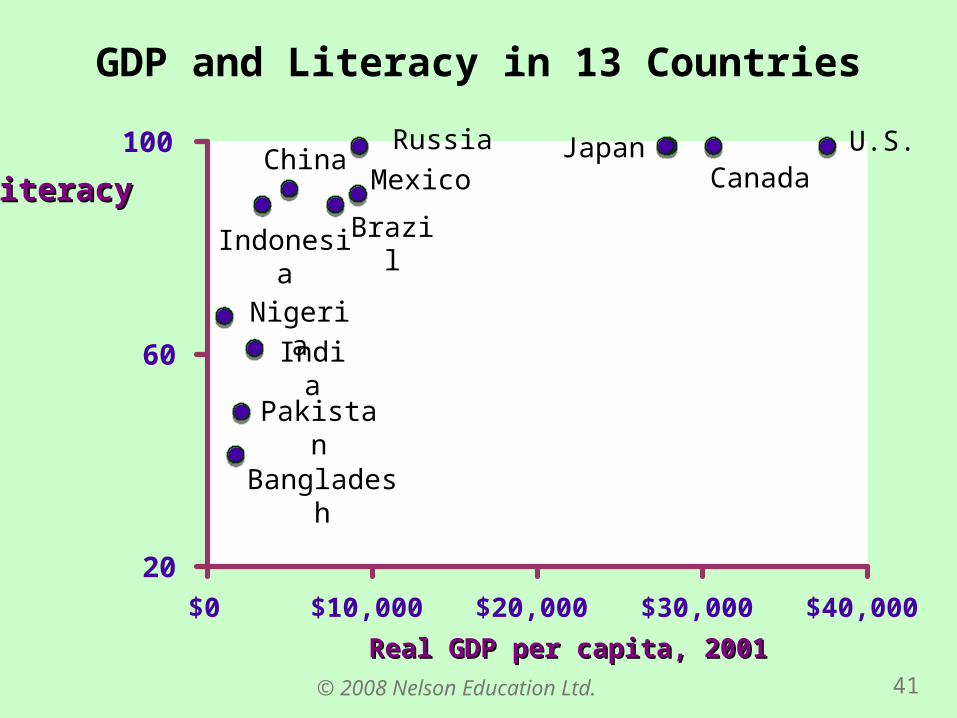
Then Why Do We Care About GDP?
Having a large GDP enables a country to afford better schools, a cleaner environment, health care, etc.
Many indicators of the quality of life are positively correlated with GDP. For example…
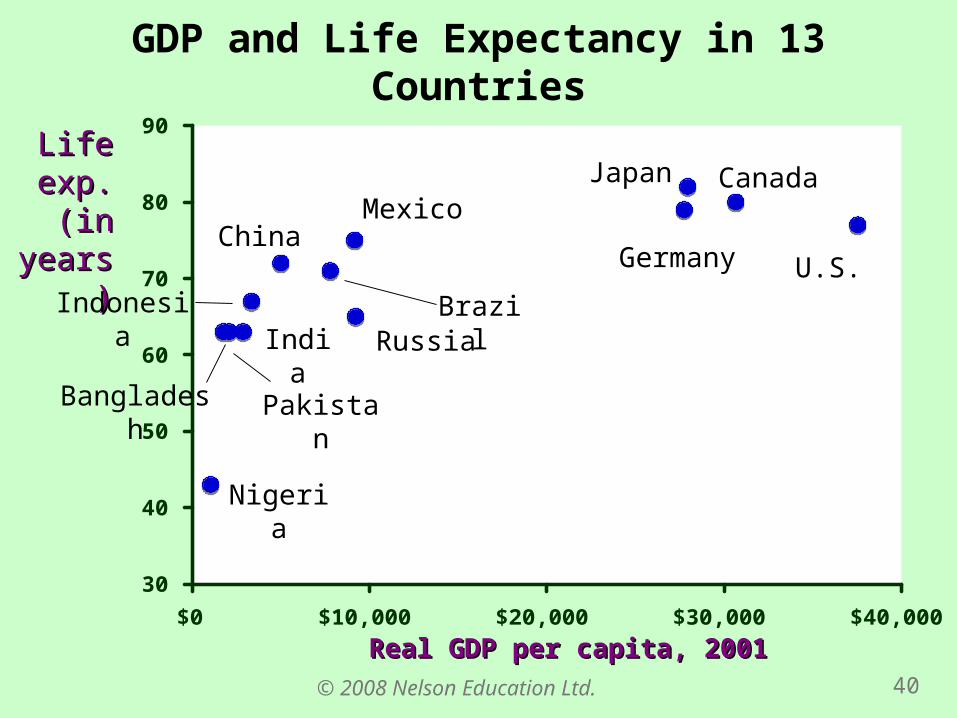
© 2008 Nelson Education Ltd. 40
30
40
50
60
70
80
90
$0 $10,000 $20,000 $30,000 $40,000
GDP and Life Expectancy in 13 Countries
Life Life exp.(in exp.(in years)years)
U.S.Germany
Japan
Nigeria
Mexico
RussiaBrazil
China
PakistanBangladesh
IndiaIndonesia
Canada
Real GDP per capita, 2001Real GDP per capita, 2001
© 2008 Nelson Education Ltd. 41
20
60
100
$0 $10,000 $20,000 $30,000 $40,000
GDP and Literacy in 13 Countries
LiteracyLiteracy
Real GDP per capita, 2001Real GDP per capita, 2001
U.S.Japan
Nigeria
Mexico
Russia
Brazil
China
Pakistan
Bangladesh
India
Indonesia
Canada
© 2008 Nelson Education Ltd. 42
CHAPTER SUMMARY
Gross Domestic Product (GDP) measures a country’s total income and expenditure.
The four spending components of GDP include: Consumption, Investment, Government Purchases, and Net Exports.
Nominal GDP is measured using current prices. Real GDP is measured using the prices of a constant base year, and is corrected for inflation.
GDP is the main indicator of a country’s economic well-being, even though it is not perfect.

© 2008 Nelson Education Ltd. 43
End: Chapter 5