© 2004 Population Reference Bureau Population Structures by Age and Sex, 2005 Millions Less...
28
© 2004 Population Reference Bureau Population Structures by Age and Sex, 2005 Millions Less Developed Regions More Developed Regions Male Female Male Female 80+ 75- 79 70- 74 65- 69 60- 64 55- 59 50- 54 45- 49 40- 44 35- 39 30- 34 25- 29 20- Age Source: United Nations, World Population Prospects: The 2002 Revision (medium scenario), 2003. Age Distribution of the World’s Population
-
Upload
peter-poole -
Category
Documents
-
view
225 -
download
0
Transcript of © 2004 Population Reference Bureau Population Structures by Age and Sex, 2005 Millions Less...

© 2004 Population Reference Bureau
Population Structures by Age and Sex, 2005 Millions
Less Developed Regions
More Developed Regions
Male Female Male Female
80+ 75-79 70-74 65-69 60-64 55-59 50-54 45-49 40-44 35-39 30-34 25-29 20-24 17-19 10-16
5-90-4
Age
Source: United Nations, World Population Prospects: The 2002 Revision (medium scenario), 2003.
Age Distribution of the World’s Population
© 2004 Population Reference Bureau
Rates of birth, death, and natural increase per 1,000 population
Natural Increase
Source: United Nations, World Population Prospects: The 2002 Revision (medium scenario), 2003.
Birth and Death Rates, Worldwide
© 2004 Population Reference Bureau
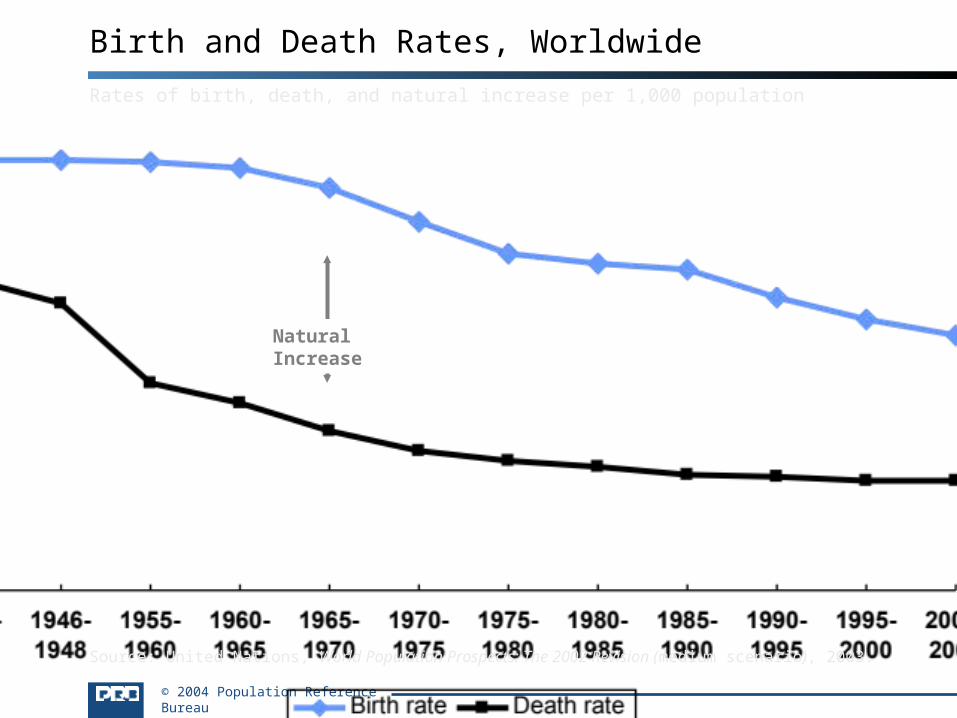
Desire for Smaller Families
Women With Two Children Who Say They Want No More ChildrenPercent
Source: ORC Macro, Demographic and Health Surveys, 1988-2000.
© 2004 Population Reference Bureau
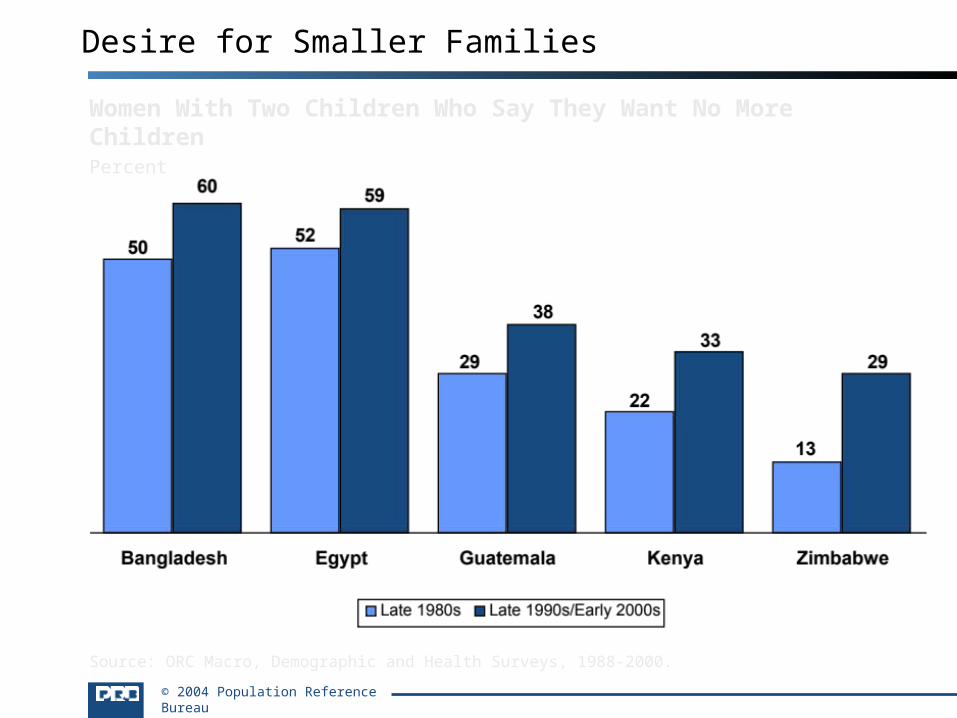
Millions
Source: United Nations, World Urbanization Prospects: The 2003 Revision (medium scenario), 2004.
1950 2000 2015
Largest Cities, Worldwide

© 2004 Population Reference Bureau
Trends in Aging, by World Region
Population Ages 65 and OlderPercent
Source: United Nations, World Population Prospects: The 2002 Revision (medium scenario), 2003.

© 2004 Population Reference Bureau
Life Expectancy at Birth, in Years
Source: United Nations, World Population Prospects: The 2002 Revision (medium scenario), 2003.
Trends in Life Expectancy, by Region

© 2004 Population Reference Bureau
Trends in Population Growth Worldwide
Population Increase and Growth Rate, Five-Year PeriodsM
illio
ns
Perc
en
t in
crease
per
year
Source: United Nations, World Population Prospects: The 2002 Revision (medium scenario), 2003.

© 2004 Population Reference Bureau
Worldwide
Source: United Nations, World Population Prospects: The 2002 Revision (medium scenario), 2003.
Women of Childbearing Age and Fertility

© 2004 Population Reference Bureau
Number of years to add each billion (year)
All of Human History (1800)
123 (1930)
33 (1960)
15 (1975)
12 (1987)12 (1999)13 (2012)16 (2028)
26 (2054)
Sources: First and second billion: Population Reference Bureau. Third through ninth billion: United Nations, World Population in 2300 (medium scenario), 2003.
World Population Growth, in Billions

© 2004 Population Reference Bureau
A.D.2000
A.D.1000
A.D.1
1000B.C.
2000B.C.
3000B.C.
4000B.C.
5000B.C.
6000B.C.
7000B.C.
1+ million years
8
7
6
5
2
1
4
3
OldStoneAge New Stone Age
BronzeAge
IronAge
MiddleAges
ModernAge
Black Death—The Plague
9
10
11
12
A.D.3000
A.D.4000
A.D.5000
18001900
1950
1975
2000
2100
Future
Billions
Source: Population Reference Bureau; and United Nations, World Population Projections to 2100 (1998).
World Population Growth Through History

DemographicsDemographicsApplying The NumbersApplying The Numbers
Chapter #8 – Global ConnectionsChapter #8 – Global Connections

World Population Patterns & TrendsWorld Population Patterns & Trends
When demographers examine the worlWhen demographers examine the worldd ’’s population, they see s population, they see FIVEFIVE major major trends: trends:
Large and Growing LargerLarge and Growing Larger Growing Population DisparityGrowing Population Disparity Declining Growth/Increasing NumbersDeclining Growth/Increasing Numbers Changing Age StructureChanging Age Structure Movement Towards The CitiesMovement Towards The Cities


Population Density & DistributionPopulation Density & Distribution
Population DensityPopulation Density – the average number – the average number of people living in a specific unit of land.of people living in a specific unit of land.
Population DistributionPopulation Distribution – determines – determines where those people live.where those people live.
There Are Two Population Density Types:There Are Two Population Density Types:
Arithmetic Population DensityArithmetic Population Density Physiologic Population DensityPhysiologic Population Density

Arithmetic Population DensityArithmetic Population Density Refers to the exact number of people in Refers to the exact number of people in
a certain area of the land.a certain area of the land. These statistics are always presented These statistics are always presented
as number of people per square as number of people per square kilometers/miles.kilometers/miles.
This statistic provides you with a fairly This statistic provides you with a fairly accurate idea of how crowded a accurate idea of how crowded a country is.country is.
However, in many cases this statistic However, in many cases this statistic provides a false impression. Why?provides a false impression. Why?

Canada has an arithmetic population Canada has an arithmetic population density of 3.3 per square kilometer. density of 3.3 per square kilometer.
Total PopulationTotal Population = = 30,600,00030,600,000 = 3.3= 3.3Total Land AreaTotal Land Area 9,220,970 km 9,220,970 km22
3.3 people/km3.3 people/km2 2 would suggest Canadawould suggest Canada’’s s population is very dispersed; however we population is very dispersed; however we know that this is not the case.know that this is not the case.
The majority of CanadaThe majority of Canada’’s population lives s population lives in a narrow strip above the US border in a narrow strip above the US border while the rest of the country is relatively while the rest of the country is relatively empty. empty.
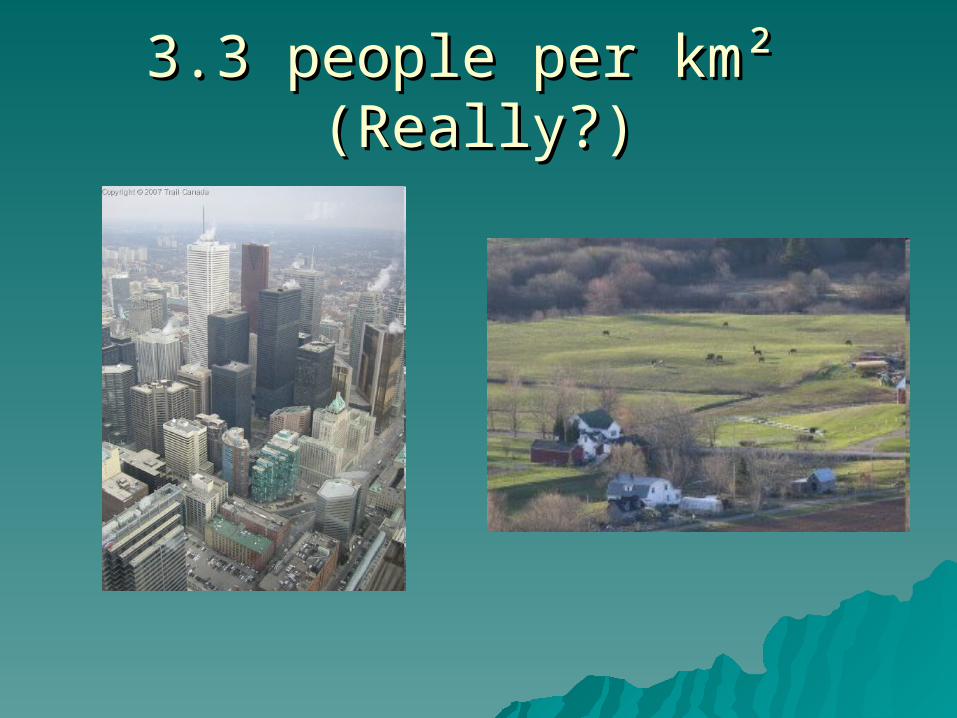
3.3 people per km² 3.3 people per km² (Really?)(Really?)
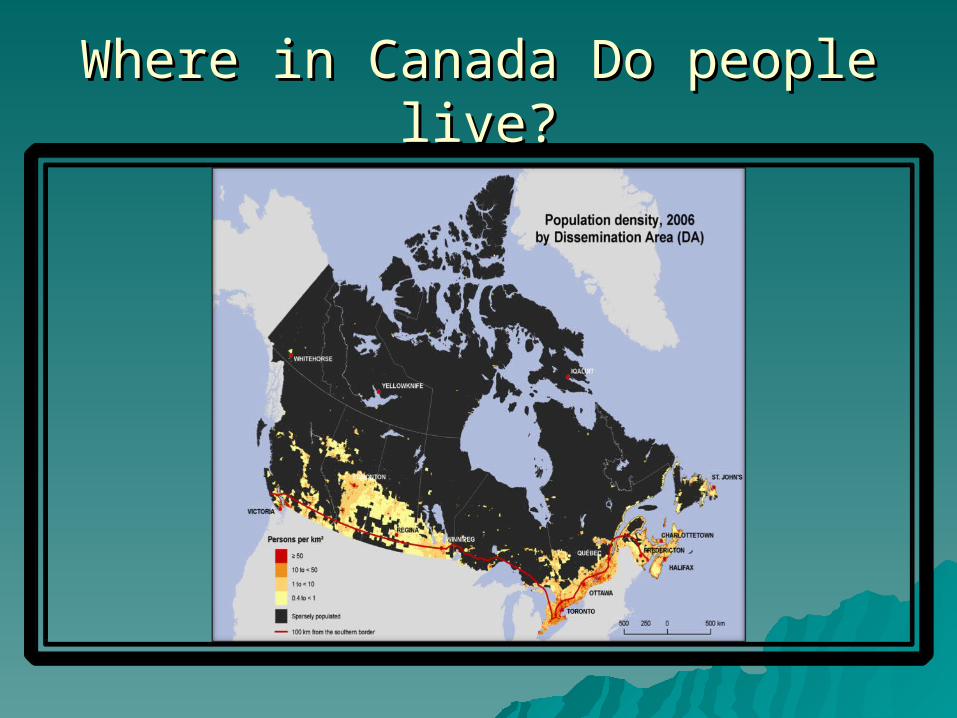
Where in Canada Do people live?Where in Canada Do people live?

The factors that tend to attract low The factors that tend to attract low population densities (Constraints)population densities (Constraints)
Extreme climate - too cold, hot, wet Extreme climate - too cold, hot, wet
or dry or dry Extreme relief - too high and too Extreme relief - too high and too
steep steep Extreme remoteness - places that Extreme remoteness - places that
are difficult to reach are difficult to reach Infertile landInfertile land

The factors that can produce a The factors that can produce a high population density high population density
(Opportunities)(Opportunities) Moderate ClimateModerate Climate Fertile farming land - many, small farms able to Fertile farming land - many, small farms able to
support a large population support a large population Mineral resources - mines produce jobs, and Mineral resources - mines produce jobs, and
provide raw materials for other industries provide raw materials for other industries Low land - with gentle slopes or flat ground Low land - with gentle slopes or flat ground Good water supply Good water supply Wealthier areas - people will move to where the Wealthier areas - people will move to where the
jobs and money are found jobs and money are found

Because of arithmetic inaccuracies Because of arithmetic inaccuracies Physiologic Population Density is also Physiologic Population Density is also calculated.calculated.
Physiologic describes population density Physiologic describes population density relative to the amount of cultivated land relative to the amount of cultivated land a country has.a country has.
Cultivated land represents an area of Cultivated land represents an area of highly occupied land. highly occupied land.
(Canada=64.3 people/km(Canada=64.3 people/km22))
Total PopulationTotal Population = = 30,600,00030,600,000 =64.3 =64.3Cultivated LandCultivated Land 455,000 km 455,000 km22
Physiologic Population DensityPhysiologic Population Density
Population DistributionPopulation Distribution Refers to the location of a population Refers to the location of a population
and how they have arranged and how they have arranged themselves on the land.themselves on the land.
Geographers try to understand why Geographers try to understand why people live close together in certain people live close together in certain areas of the country.areas of the country.
People settle where they can: People settle where they can:
a) Survive a) Survive b) Prosperb) Prosper The areas of greatest population The areas of greatest population
concentration are known as concentration are known as heartlandsheartlands..
Which three parts of the world Which three parts of the world do most people live in?do most people live in?