© 2015 IBM Corporation How z/VM Begins Tim Greer z/VM System Test [email protected].
date post
20-Dec-2015Category
view
229download
6
© 2004 IBM Corporation
IBM ^
z/VM Module 9: Performance

© 2004 IBM Corporation
IBM ^
Objectives
Describe what performance means in the z/VM environment List and explain the performance characteristics of the z/VM system Explain scheduling and dispatching and how they relate to
performance Describe the three lists used in scheduling and dispatching:
Dormant list Eligible list Dispatch list
© 2004 IBM Corporation
IBM ^
Objectives continued
Describe the planning and administration guidelines for improving z/VM system efficiency
Explain the areas of performance that need to be considered and the major factors affecting them
List and describe the CP performance facilities Describe performance guidelines in a virtual machine environment Explain the performance monitoring and analysis programs that are
available to tune your z/VM system
© 2004 IBM Corporation
IBM ^
Objectives continued
Describe how the INDICATE and MONITOR commands are used in performance testing
Explain why you would tune your z/VM system and the methods for doing so
List and describe the system resources that are capable of being tuned:
Processor subsystem
Paging subsystem
Storage subsystem
I/O subsystem
© 2004 IBM Corporation
IBM ^
Introducing Performance
Achieving optimum system performance is an elusive goal. This module will give you an understanding of z/VM system
characteristics and introduce: Performance methodology Planning measures Monitoring facility tools Tuning
© 2004 IBM Corporation
IBM ^
Real Processor Management
CP is responsible for allocating the processing power of the available real processors in order to process virtual machine instructions.
Any processor complex on which z/VM runs must have a master processor.
A dedicated processor runs only the work generated by that virtual machine’s processor.
To enhance the performance of the V=R machine, CP automatically dedicates as many processors as it can to the virtual processor belonging to the V=R machine.
© 2004 IBM Corporation
IBM ^
Real Processor Management continued
When the operator IPLs CP on the real machine, CP initially uses the master processor.
The CP in V=R machines automatically dedicates available real alternate processors under the following circumstances:
When the V=R machine defines a new virtual processor, using the DEFINE CPU command
After a VARY ONLINE PROCESSOR command, making a new real alternate processor available
When a V=R machine enters the DETACH CPU command and the detached virtual processor was dedicated
© 2004 IBM Corporation
IBM ^
Virtual Machine Scheduling and Dispatching
The dispatcher selects virtual machines (guests) from the dispatch list for the processors to run.
The CP scheduler function is responsible for calculating the priorities. A virtual machine is permitted to have processor control for a portion
of the elapsed time slice each time it is dispatched. An elapsed time slice is an interval of time that each virtual machine is
allocated and during which it has the use of the real processor.

© 2004 IBM Corporation
IBM ^
Virtual Machine Scheduling and Dispatching, continued
The scheduling and dispatching routines that are implemented in CP are designed to favor:
V=R machines
V=F machines
Interactive virtual machines over non-interactive virtual machines
Installation-specified virtual machines

© 2004 IBM Corporation
IBM ^
Elapsed Time Slice
When a virtual machine enters the eligible list, it is assigned an elapsed time slice.
The initial value of E1 elapsed time slice is 1.2 seconds.
The E0, E2, and E3 elapsed time slices are fixed multiples of the varying E1 elapsed time slice.
© 2004 IBM Corporation
IBM ^
Scheduling and Dispatching Lists
In order to schedule and dispatch the set of virtual machines, CP groups virtual machines according to their current execution characteristics and resource requirements into these groups:
Dormant list
Eligible list
Dispatch list
© 2004 IBM Corporation
IBM ^
Leaving and Entering the Dispatched List
Virtual machines alternate between the dispatch list and the eligible time slice.
When dropped from the dispatch list at the end of its elapsed time slice without completing its transaction, an E1 virtual machine becomes an E2 virtual machine.
A virtual machine is dropped from the dispatch list and placed in the dormant list if it enters an enable wait state (becomes idle) before its elapsed time slice ends.
© 2004 IBM Corporation
IBM ^
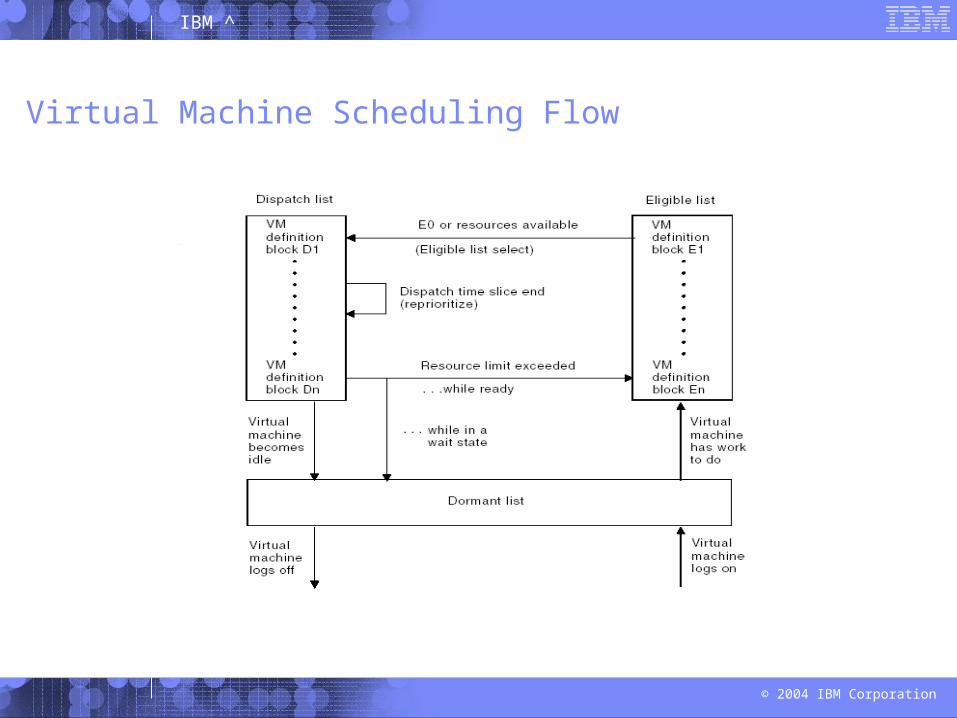
Virtual Machine Scheduling Flow
© 2004 IBM Corporation
IBM ^
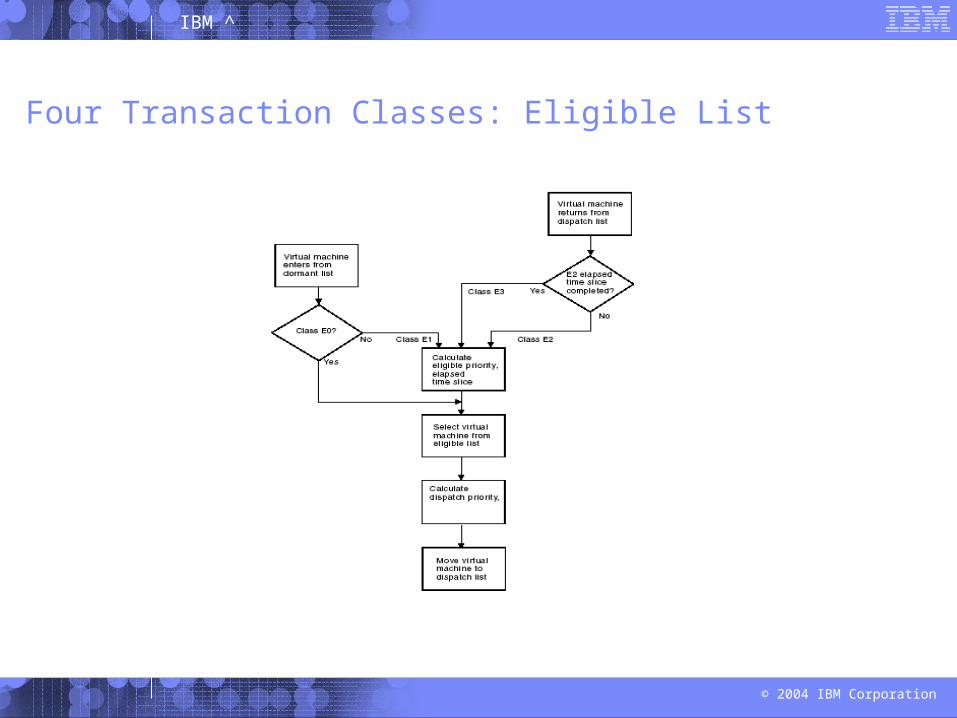
Four Transaction Classes: Eligible List
© 2004 IBM Corporation
IBM ^
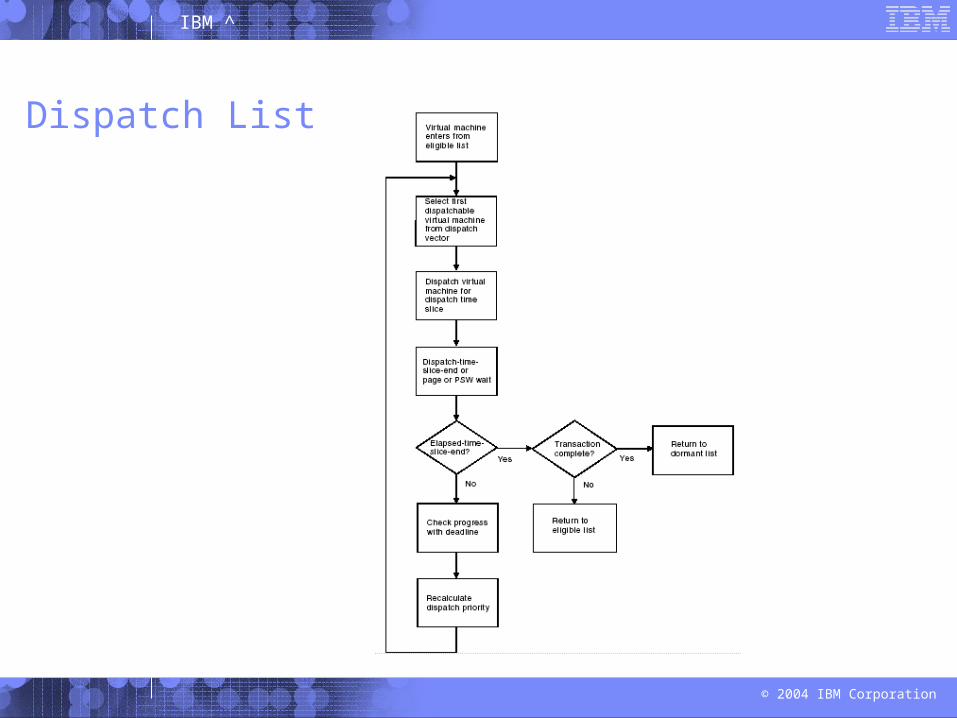
Dispatch List
© 2004 IBM Corporation
IBM ^
Planning and Administration Guidelines
Performance characteristics of an operating system are dependent on such factors as:
Hardware Number of users during peak periods Functions being performed by the system System parameters
The three general tasks for improving your z/VM system efficiency are:
Planning Monitoring Performing
© 2004 IBM Corporation
IBM ^
Performance Considerations
There are two areas of performance to consider: The performance of individual virtual machines
The performance of the total system The total system performance achieved in a virtual machine
environment may be equal to or better than the performance achieved in a native environment.
Current processor usage is the most important factor in determining the performance that will be achieved in a virtual machine environment.
© 2004 IBM Corporation
IBM ^
Major Factors Affecting Performance
The interrelationship of the following factors affect total system performance:
The speed and number of paging devices
Real storage size
Real processor speed
Workload characteristics

© 2004 IBM Corporation
IBM ^
CP Performance Facilities
CP provides a set of performance facilities that can be used by individual virtual machines to improve their performance, such as:
Processor dedication option Virtual machine multiprocessing Virtual=Real (V=R) option Virtual=Fixed (V=F) option System scheduling control options
© 2004 IBM Corporation
IBM ^
CP Performance Facilities continued
Other performance facilities are: Scheduling share option Scheduling maximum share option Quick dispatch option Expanded storage allocation option Locked pages option Real channel program execution option Name saved systems (NSS) Saved segments
© 2004 IBM Corporation
IBM ^
CP Performance Facilities continued
Other performance facilities are: VM/VS handshaking
Interpretive-execution facility
Guest wait-state interpretation capability
Minidisk Caching
VM Data Spaces
Spool file initialization
File caching option for CP-accessed minidisks
Hot I/O Detection
Virtual Disk in Storage
I/O Throttling
© 2004 IBM Corporation
IBM ^
Performance Guidelines in a Virtual Machine Environment
There are some guidelines and hints that can be used to improve the performance of a virtual machine and its applications.
A list of such guidelines is provided to help explain the performance characteristics of a z/VM system.
The guidelines cover the actions taken to increase performance of both the z/VM environment and application programs.
© 2004 IBM Corporation
IBM ^
Performance Monitoring
Performance monitoring is the periodic collection of performance data and serves two major purposes:
Early detection of performance problems
Problem determination for performance problems The INDICATE and MONITOR commands provide system
performance measurement facilities for z/VM, which include: Obtaining system resource usage data
Collecting measurement data using a z/VM monitor for later analysis

© 2004 IBM Corporation
IBM ^
Performance Analysis Programs
z/VM supports additional performance analysis programs: IBM Realtime Monitor VM/ESA – used to help detect and
diagnose problems and analyze system performance VM Performance Reporting Facility – a tool for performance
measurement, analysis, and problem determination Performance Analysis Facility/VM – a graphics-based facility
that helps the performance analyst
© 2004 IBM Corporation
IBM ^
z/VM 4.4 Performance Toolkit
The Performance Toolkit for VM is designed to assist operators and systems programmers or analysts in the following areas:
System console operation in full screen mode:– The features provided have been designed to facilitate the operation of VM
systems, hence improving operator efficiency and productivity. These features include:
• General system output can automatically be scrolled; however additional privilege classes may be needed depending on implemented functions
• Messages and actions from other virtual machines are numbered and left pending at the top of the screen until explicitly deleted
• A redisplay facility allows browsing through the day’s accumulated console log, or through previous days’ logs
© 2004 IBM Corporation
IBM ^
INDICATE Command
This command provides the system analyst with a “snapshot” of system activities. Subcommands include:
INDICATE USER
INDICATE USER EXPANDED
INDICATE LOAD These commands can help determine the execution
characteristics of a program with respect to the resources it uses.
© 2004 IBM Corporation
IBM ^
INDICATE Command continued
Other commands that can provide a “snapshot” include: INDICATE QUEUES
INDICATE I/O
INDICATE PAGING
INDICATE VECTOR
INDICATE SPACES
INDICATE NSS
© 2004 IBM Corporation
IBM ^
Monitor Performance Using CP Monitor
The CP Monitor facility collects system performance data that can be processed by an external data reduction program.
The user controls the amount and nature of the data collected. MONWRITE can be used as the application program that establishes
communication links with CP and retrieves records. The monitor collects user-defined sets of statistics about z/VM
system operations that are saved in domains.
© 2004 IBM Corporation
IBM ^
Monitor Data
CP Monitor collects data during CP operations and stores the data collected in the saved segment.
Monitor collects and reports two types of data: Event data
Sample data, which is broken into:
– Single-sample data– High-frequency sample data
The system is divided into different domains for the purpose of collecting monitor data and generating monitor records.
© 2004 IBM Corporation
IBM ^
CP Monitor Commands
You would use the MONITOR command to control monitoring. Monitor commands include:
SET MONDATA QUERY MONITOR QUERY MONDATA
Monitor utilities include: MONWRITE MONWSTOP
© 2004 IBM Corporation
IBM ^
CP Monitor Facility
To use the CP Monitor facility, a virtual machine must run an application program to retrieve data from the monitor saved segment.
The *MONITOR system service can be broken into four parts: The virtual machine makes the connection
*Monitor notifies all applicable virtual machines that the records are ready to be retrieved
The virtual machine accesses the saved segment
*MONITOR notifies the virtual machine that it is finished
© 2004 IBM Corporation
IBM ^
Tuning Agenda
Tuning z/VM Tuning Methods Controlling the Dispatch List Allocating System Resources – Allocating Processors Tuning the Processor Subsystem Tuning the Paging Subsystem Tuning the Storage Subsystem Tuning the I/O Subsystem
© 2004 IBM Corporation
IBM ^
Tuning z/VM
Why tune your z/VM system? Performance tuning is undertaken when you want to:
Process a large or more demanding work load without increasing the system’s configuration
Improve system response or throughput
Reduce processing costs without affecting service to your users Tuning is basically trial-and-error, but there is a step-by-step
approach to any tuning project.
© 2004 IBM Corporation
IBM ^
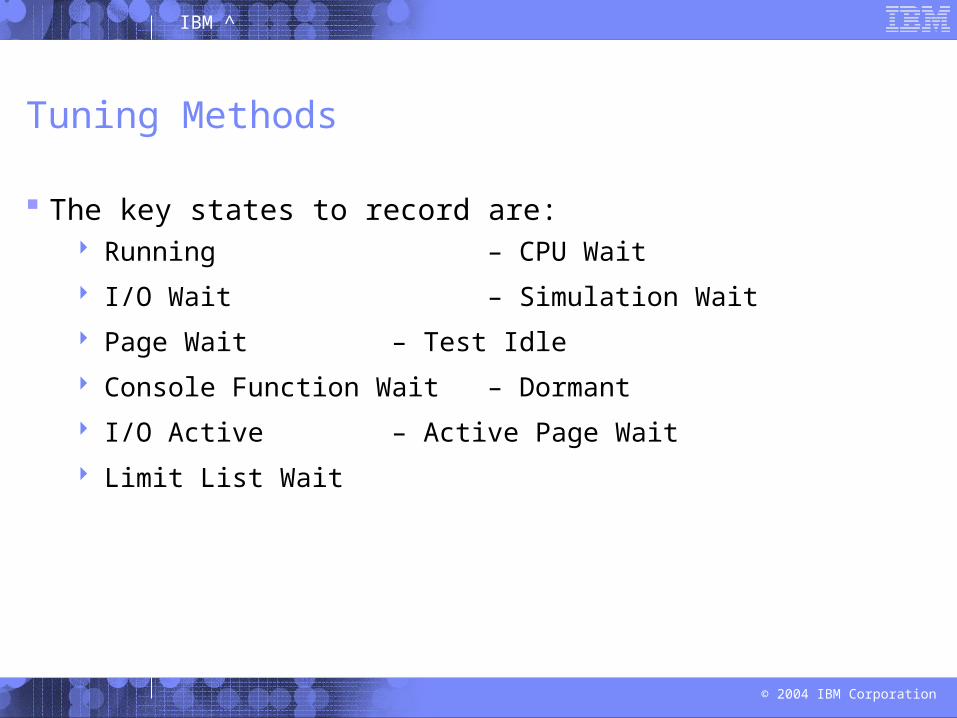
Tuning Methods
The key states to record are: Running – CPU Wait
I/O Wait – Simulation Wait
Page Wait – Test Idle
Console Function Wait – Dormant
I/O Active – Active Page Wait
Limit List Wait
© 2004 IBM Corporation
IBM ^
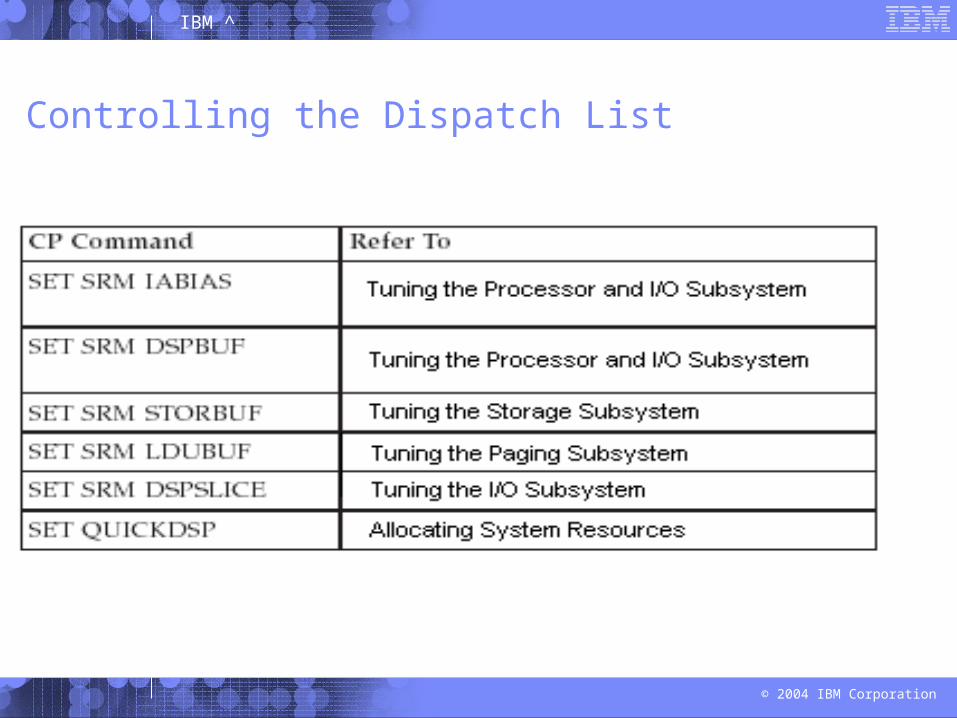
Controlling the Dispatch List
© 2004 IBM Corporation
IBM ^
Allocating System Resources – Allocating Processors
Allocating system resources is a preliminary step to tuning your system.
CP allocates a V=R virtual machine one processor to the system and assigns each virtual machine the same share of processor time
To remove a dedicated processor from the V=R virtual machine, enter the UNDEDICATE command, which by default has a CPU ALL operand for the V=R user ID.
© 2004 IBM Corporation
IBM ^
Allocating System Resources – Using SET SHARE
This command and directory statement allows you to control the percentage of system resources a user receives.
A normal share attempts to provide the least amount of resources to a virtual machine.
A maximum share attempts to prevent a virtual machine from using more than the amount of system processor resource available. The types are:
NOLIMIT LIMITHARD LIMITSOFT

© 2004 IBM Corporation
IBM ^
Allocating System Resources – Using SET SHARE continued
In general, you should assign typical users relative share rather than an absolute share.
A relative share setting lets you determine the percentage of system resources a virtual machine gets with respect to other virtual machines with relative shares.
© 2004 IBM Corporation
IBM ^
Allocating System Resources – SET QUICKDSP
This command and operand of the OPTION directory allows you to designate virtual machines that will not wait in the eligible list when they have work to do.
The types of virtual machines that should be considered for QUICKDSP include:
The V=R virtual machine Other virtual machines with critical response-time requirements A production V=V guest that has interactive characteristics
© 2004 IBM Corporation
IBM ^
Tuning the Processor Subsystem
The resources of the processors installed at your location are referred to as the processor subsystem.
Some guidelines for reducing the load on your processors are: Reduce the amount of CCW translations
Reduce the SHARE settings To measure the workload, use these commands:
INDICATE LOAD
INDICATE QUEUES
INDICATE VECTOR
© 2004 IBM Corporation
IBM ^
Tuning the Processor Subsystem continued
The command to display the current interactive bias is: Query srm iabias
To change the interactive bias CP use: Set srm iabias m n
The SET SRM DSPBUF command lets you control the number of users in the dispatch list
This command lets you over-commit and under-commit resources of the processors and I/O devices.
© 2004 IBM Corporation
IBM ^
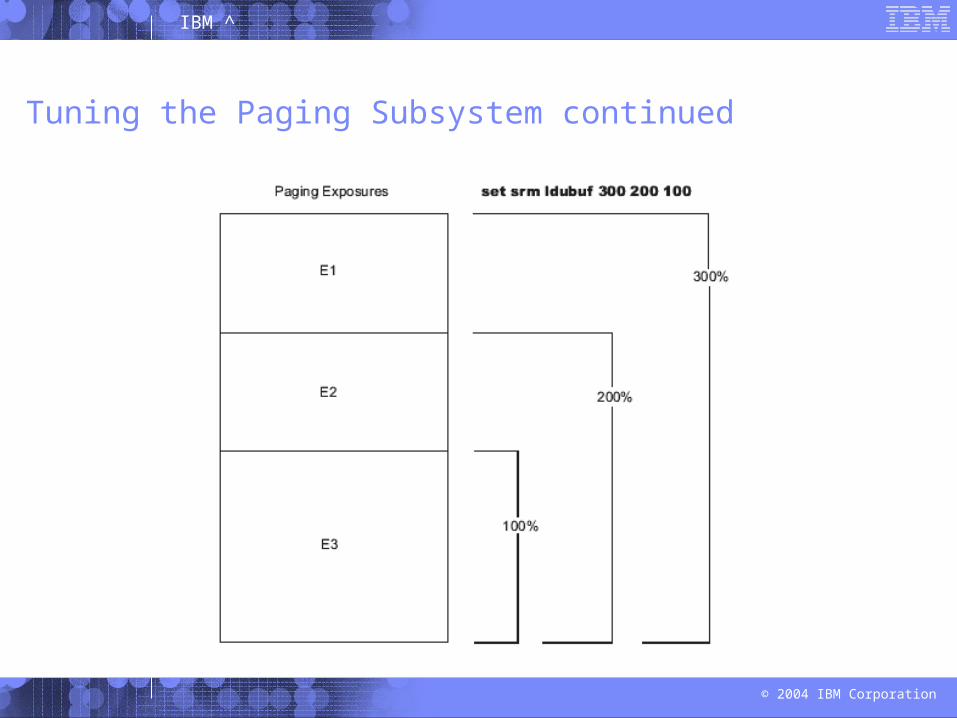
Tuning the Paging Subsystem
Paging is often the most influential component of overall response time.
To attempt to overcome a high paging rate, you should consider: Adding real storage
Adding expanded storage for CP to page to
Define more of your existing DASD as paging devices Display paging information using:
INDICATE LOAD
INDICATE PAGING
© 2004 IBM Corporation
IBM ^
Tuning the Paging Subsystem continued
© 2004 IBM Corporation
IBM ^
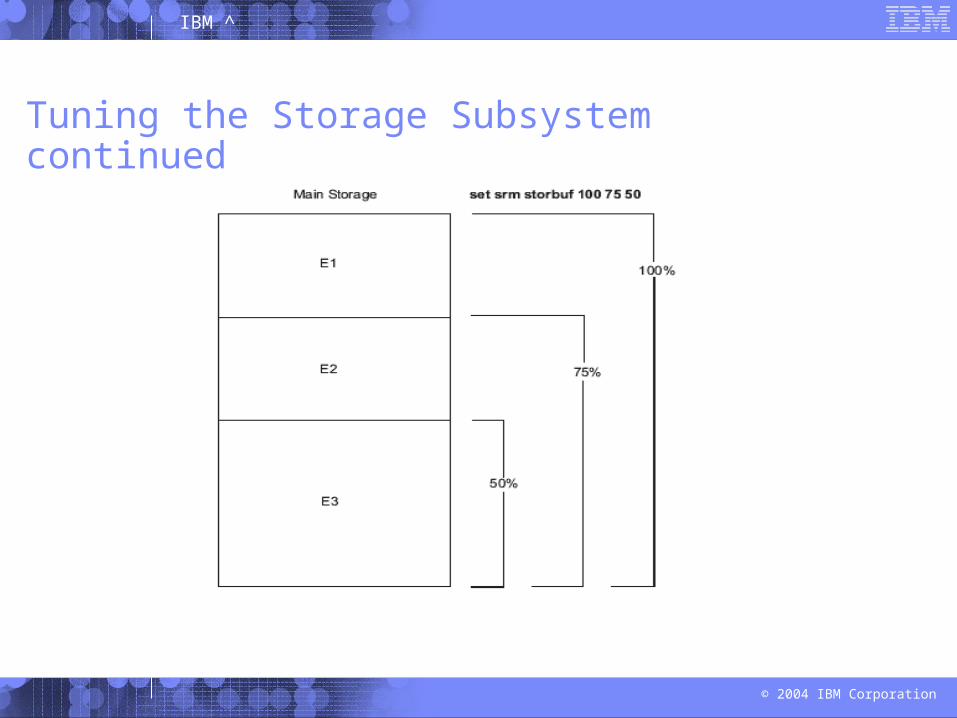
Tuning the Storage Subsystem
Waiting for storage to become available is a common cause of slow response time
To display information use the QUERY FRAMES command Use one of the following commands to control storage
allocation: SET RESERVED LOCK ATTACH XSTORE SET SRM STORBUF
© 2004 IBM Corporation
IBM ^
Tuning the Storage Subsystem continued
© 2004 IBM Corporation
IBM ^
Tuning the I/O Subsystem
Tune the I/O subsystem to determine what might be causing a system bottleneck.
Some guidelines for getting the best performance out of your system are:
Provide more real or expanded storage
Keep DASD volumes at a high degree of activity
Balance the activity on all DASD volumes
Reduce the number of I/O operations required per transaction To display I/O information, use the INDICATE I/O command.

© 2004 IBM Corporation
IBM ^
Tuning the I/O Subsystem continued
A subchannel measurement block is a control block that can be associated with a given device that contains measurement data
Three measurement components are: Connect time Function pending time Disconnect time
Some important ways to control I/O resource are: SET THROTTLE I/O Priority Queueing SET SRM DSPBUF SET SRM DSPSLICE
© 2004 IBM Corporation
IBM ^
Conclusion
Performance concepts help you set performance goals. When you configure your z/VM environment, use the INDICATE
and MONITOR commands to display and compare system characteristics.
The major goal for tuning your z/VM system is to optimize performance.

© 2004 IBM Corporation
IBM ^
Glossary
Channel command word (CCW): an instruction to an I/O processor (channel). Performance-oriented Assembler programmers used to code their own CCWs to improve efficiency.
Dispatch list: the virtual machines in this list are competing for the use of the real processors and all other scheduled system resources.
© 2004 IBM Corporation
IBM ^
Glossary
Dormant list: consists of the logged-on virtual machines that are not currently being considered for dispatching because they have no work to accomplish or are waiting for the completion of a long event.
Elapsed time slice: is the interval of time on a real processor that a set of virtual machines are competing for.
Eligible list: this list forms when there is more demand by virtual machines for real resources than are available
© 2004 IBM Corporation
IBM ^
Glossary
Event data: is collected and reported each time a designated system event occurs
Exclusive mode: in this mode, the virtual machine is the one, and the only one, connected to *MONITOR
INDICATE: this command provides the system analyst with a list of system activities
MONITOR: collects data during CP operations and stores the data collected in the saved segment in the form of monitor records
© 2004 IBM Corporation
IBM ^
Glossary
Sample data: is collected and reported at the end of each designated time interval
Share mode: any other virtual machine may connect to *MONITOR concurrently

© 2004 IBM Corporation
IBM ^
References
z/VM: Performance 4.3 – SC24-5999-02. URL: http://www.vm.ibm.com/pubs/pdf/hcsi1a50.pdf
Bitner, Bill. “z/VM Guest Performance: z/VM for zSeries Technical Conference V91”. April 8, 2002.
Bitner, Bill. “VM Performance Monitoring of Major VM Components”. February 22, 2001.
z/VM: Performance Report 4.3. IBM Corp 2002.