
Γαλαξίες – 2 Ελλειπτικοί Γαλαξίες 2 o μέρος...
22
Γαλαξίες – 2 Γαλαξίες – 2 Ελλειπτικοί Γαλαξίες Ελλειπτικοί Γαλαξίες 2 2 o o μέρος μέρος Συμπληρωματικά στοιχεία Συμπληρωματικά στοιχεία για σπειροειδείς για σπειροειδείς γαλαξίες γαλαξίες 12 Ιανουαρίου 2013 12 Ιανουαρίου 2013
-
Upload
isabel-betty-skinner -
Category
Documents
-
view
216 -
download
2
Transcript of Γαλαξίες – 2 Ελλειπτικοί Γαλαξίες 2 o μέρος...
Γαλαξίες – 2Γαλαξίες – 2Ελλειπτικοί ΓαλαξίεςΕλλειπτικοί Γαλαξίες 2 2oo μέροςμέρος
Συμπληρωματικά στοιχεία για Συμπληρωματικά στοιχεία για σπειροειδείς γαλαξίεςσπειροειδείς γαλαξίες
12 Ιανουαρίου 201312 Ιανουαρίου 2013

The Faber–Jackson The Faber–Jackson RelationRelation
• the velocity dispersion in the center of ellipticals, σ0, scales with luminosity
• The Faber–Jackson relation specifies a connection between the luminosity and a kinematic property of elliptical galaxies.
• Various other relations also exist between the
parameters of elliptical galaxies
(e.g. log Re – MΒ etc)
• So, the inference is that there may well be a relation between the various parameters for which the dispersion is smaller than that of the Faber–Jackson relation:
the fundamental plane.
(e.g. Primary component analysis)
Schneider 2007

The fundamental planeThe fundamental plane
Projections of the FP onto different two parameter planes
Schneider 2007
The distribution of ellipticalgalaxies in the three-dimensional parameter space

FP relation – virial theorem
Virial theorem
which agrees with the FP relation
provided that
i.e. if the M/L ratio increases with M

Introductory remarks for elliptical formation• Elliptical galaxies are the most massive stellar systems in the local Universe and • They appear to define a homogeneous class of objects with
– uniformly old and red populations, – Negligible amounts of gas, – very little star formation.
• 50 % or more of the stellar mass in the local Universe appears to be in early–type systems and bulges
• Their deceptively simple appearance inspired a ‘classical’ formation scenario in which they form in a single intense burst of star formation at high redshifts (z ~ 5), followed by passive evolution of their stellar
populations to the present day (Partridge & Peebles 1967; Larson 1975).
• This so-called monolithic scenario successfully explains – the tightness of the fundamental scaling relations (the colour–magnitude relation and the Fundamental Plane)– the evolution of these relations as a function of redshift (Kodama et al. 1998; van Dokkum &
Stanford 2003).
De Lucia et al. (2005)

Other suggestions for elliptical galaxy formationEllipticals are more complex than what the simple monolithic scenario predicts
• Toomre & Toomre (1972) suggested that elliptical galaxies can form from major mergers of massive disk galaxies.
• Detailed numerical simulations (Farouki & Shapiro 1982; Negroponte & White 1983) showed that the merger of two spiral galaxies of comparable mass can indeed produce a remnant with structural and photometric properties resembling those of elliptical galaxies.
• In more recent years, a large body of observational evidence has been collected that demonstrates that interactions and mergers indeed represent a common phenomenon at high redshifts, and that these processes affect the population of elliptical galaxies in the local Universe.
• Schweizer & Seitzer (1992) found evidence for bluer colours of elliptical galaxies with increasing morphological disturbance
• Later studies using absorption–line indices have demonstrated that a significant fraction of cluster early–type galaxies has undergone recent episodes of star formation (Barger et al. 1996, Menanteau, et al. 2001; van de Ven, et al. 2003, Treu et al. 2002 etc)
At least for a part of the elliptical galaxy population, a hierarchical formation scenario in which larger spheroidals are assembled relatively late from the merger of late–type galaxies of comparable mass. Such a bottom-up formation scenario is naturally expected for the structure formation process in cosmologies dominated by cold dark matter.

…The two competing theories for the formation of elliptical galaxies has remained open.
• A relatively large fraction of early–type systems shows clear evidence of interactions, mergers, and recent star formation.
• However, the data also seem to indicate that only a small fraction of the mass is involved in such episodes.
• The latter observational result has often been interpreted as strong evidence against the more extended star formation history naively predicted from hierarchical models.
• A related issue concerns the α -element enhancements observed in ellipticals.• α -elementσ are released mainly by supernovae type-II, while the main contribution to
the Fe-peak elements comes from supernovae type-Ia. • massive ellipticals have super-solar [/Fe] ratios, suggesting that they formed on
relatively short time–scales and/or have an initial mass function that is skewed towards massive stars.
• early models of the hierarchical merger paradigm did not reproduce this observed trend

Stellar populations of elliptical galaxies
• Population synthesis techniques. (first studies Tinsley 1972, Bruzual 1983; Guiderdoni & Rocca-Volmerange 1987;
Buzzoni 1989).
• Recent improvements have come through the development of medium to high resolution spectral models that include quite complete libraries of stellar spectra and improved treatments of stellar evolutionary theory (Vazdekis 2001; Bruzual & Charlot 2003; mThomas, Maraston & Bender 2003).
• The use of these more sophisticated models, together with the acquisition of better and larger amounts of data have recently established firm evidence for a mass–dependent evolutionary history of the elliptical galaxy population (De Lucia et al. 2004c; Kodama et al. 2004; Thomas et al. 2005; van der Wel et al. 2005; Treu et al. 2005).
• The data suggest that less massive ellipticals have more extended star formation histories than their more massive counterparts, giving them a lower characteristic formation redshift,
in marked contrast to naive expectations based on the growth of dark matter halos in
hierarchical CDM cosmologies.

New Hierarchical model results using the Millenium Simulation
• De Lucia et al. 2005 used the high-resolution simulation of cosmic structure growth – the Millennium Simulation of the concordance CDM cosmogony– together with semi-analytical techniques, to study how the star formation histories, ages and metallicities of elliptical galaxies depend on environment and on stellar mass.
• More massive elliptical galaxies have star formation histories that peak at higher redshifts ( 5) than lower mass systems,and can reach ≃star formation rates up to several thousands of solar masses per year for galaxies ending up in overdense regions.
• Less massive elliptical galaxies have star formation histories that peak at progressively lower redshifts and are extended over a longer time interval.

Elliptical Galaxy Formation ScenariosMonolithic vs hierarchical
Mo et al. (2010)

Main results and conclusions
• Elliptical galaxies in denser environments are on average older, more metal rich, and redder than the general population of ‘field’ ellipticals.
– high density regions form from the highest density peaks in the primordial field of density fluctuations, whose evolution is somewhat accelerated with respect to regions of ‘average’ density.
• Clear trend for increasing ages and metallicities, and for redder colours, with decreasing cluster–centric distance.
– a natural expectation of hierarchical models where the distance of the galaxies from the cluster centre is correlated with the time they were accreted onto the larger system.
– When this infall happens, we assume that the galaxy is stripped of its hot gas reservoir so it is no longer able to accrete fresh material for star formation. The galaxy then rapidly consumes its cold gas moving towards the red sequence.
• the most massive elliptical galaxies have the oldest and most metal rich stellar populations, in agreement with observational results. Also they are characterised
by the shortest formation time–scales
• Discrepancy: these old ages are in marked contrast to the late assembly times found for these galaxies: Massive ellipticals are predicted to be assembled later than their lower mass counterparts, and that they have a larger effective number of progenitor systems

AGN effectWhen no suppression of the condensation of gas in massive haloes is considered, the most massive ellipticals have the most extended star Formation histories. Too many massive systems are produced at redshift zero, at odds with observations. Late mergers and late accretion, which still involve a substantial amount of gas in this model, cause the formation of luminous and young bulge stars.
An artificial cutoff of the gas condensation,producesresults that are qualitatively similar to those obtained with the more physically motivated AGN model
“Modern semi-analytic models ofgalaxy formation do predict ‘anti-hierarchical’ star formationhistories for ellipticals in a CDM universe even thoughthe assembly of these galaxies is indeed hierarchical”

Spiral Galaxies• Compared to ellipticals, the spirals cover a distinctlysmaller range in absolute magnitude (and mass). Theyare limited to −16 > MB > −23 and 109Mּס < M < 1012Mּס
• Looking at the sequence of early-type spirals (i.e., Sa’sor SBa’s) to late-type spirals, we find a number of differencesthat can be used for classification
• a decreasing luminosity ratio of bulge and disk, withLbulge/Ldisk ~ 0.3 for Sa’s and ~ 0.05 for Sc’s
• an increasing opening angle of the spiral arms, from~ 6◦ for Sa’s to ~18◦ for Sc’s;
• an increasing brightness structure along the spiralarms: Sa’s have a “smooth” distribution of stars alongthe spiral arms, whereas the light distribution in thespiral arms of Sc’s is resolved into bright knots ofstars and HII regions.


Spiral galaxies Brightness Profiles
• The light profile of the bulge of spirals is described by a de Vaucouleurs profile to a good approximation
• the disk follows an exponential brightness profile, as is the case for our Milky Way
• μe is the surface brightness at the effective radius Re
• The central surface brightness and the scale-length of the disk are denoted by μ0 and hr , respectively.
• μ0 is not directly measurable since μ0 is not the central surface brightness of the galaxy, only that of its disk component. To determineμ0, the exponentialis extrapolated from large R inwards to R = 0.

The brightness profile of the haloes of spirals
• Difficult to study due to low surface brightness
• A stellar halo of red giant branch stars was detected n M31
– It extends out to more than 150 kpc from its center.
– The brightness profile of this stellar distribution indicates that for radii r <20 kpc it follows the extrapolation from the brightness profile of the bulge,
i.e., a deVaucouleurs profile.
– for larger radii it exceeds this extrapolation, showing a power-law profile which corresponds to a radial density profile of approximately
ρ ~ r−3, not unlike that observed in our Milky Way.

Low surface brightness spirals (LSB)
• the central surface brightness of disks has a very low spread, i.e., it is very similar for different galaxies (Freeman’s law, 1970). For
– Sa’s to Sc’s
μ0 = 21.52±0.39 B-mag/arcsec2 is observed,
– Sd spirals and later types,
μ0 = 22.61±0.47 B-mag/arcsec2.
• Galaxies exist which have a significantly lower surface brightness, the low surface brightness galaxies (LSBs). They seem to form a separate class of galaxies whose study is substantially more difficult compared to normal spirals because of their low surface brightness.
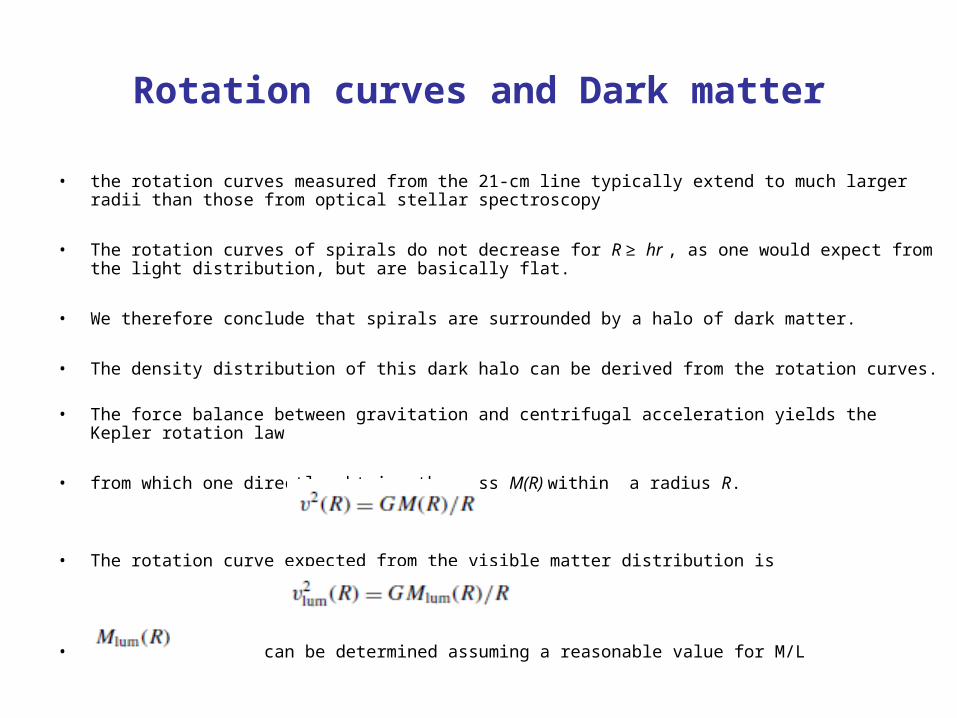
Rotation curves and Dark matter
• the rotation curves measured from the 21-cm line typically extend to much larger radii than those from optical stellar spectroscopy
• The rotation curves of spirals do not decrease for R ≥ hr , as one would expect from the light distribution, but are basically flat.
• We therefore conclude that spirals are surrounded by a halo of dark matter.
• The density distribution of this dark halo can be derived from the rotation curves.
• The force balance between gravitation and centrifugal acceleration yields the Kepler rotation law
• from which one directly obtains the mass M(R) within a radius R.
• The rotation curve expected from the visible matter distribution is
• can be determined assuming a reasonable value for M/L

• M/L can be obtained – The spectral light distribution of the stars, together with knowledge of
the properties of stellar populations,
– or by fitting the innermost part of the rotation curve (where the mass contribution of dark matter can presumably be neglected) assuming that M/L is independent of radius for the stellar population.
• From this estimate of the mass-to-light ratio, the discrepancy between υ2lum and υ2 yields the distribution of the dark matter,
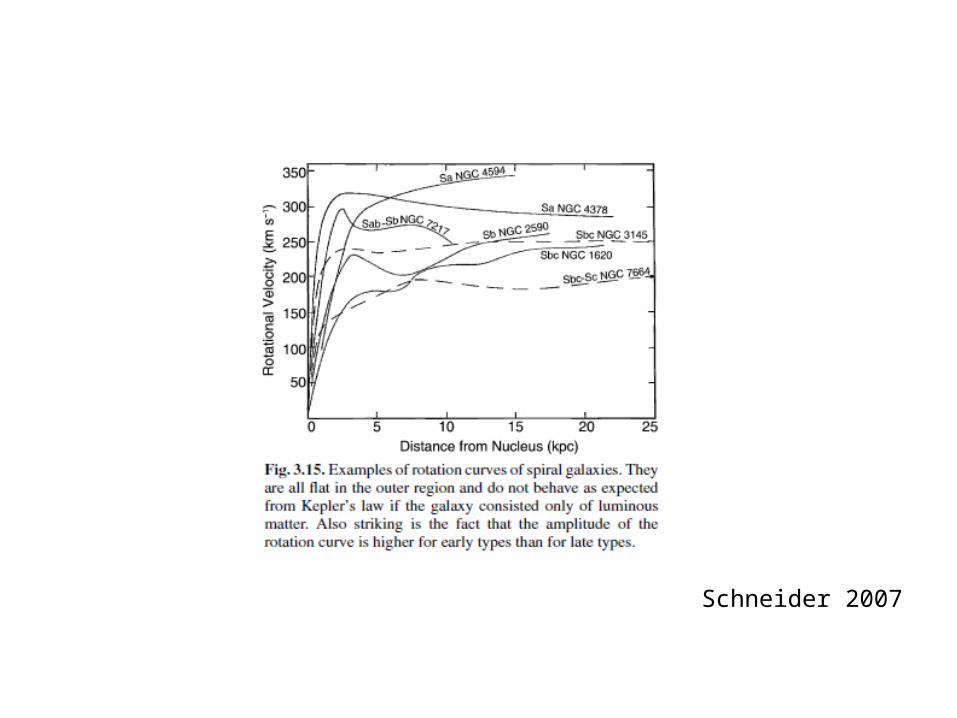
Schneider 2007

Correlations of Rotation Curves with Galaxy Properties
• The form and amplitude of the rotation curves of spirals are correlated with their luminosity and their Hubble type.
• The larger the luminosity of a spiral, the steeper the rise of v(R) in the central region, and the larger the maximum rotation velocity vmax.
• For the characteristic values of the various Hubble types, one finds– vmax ~300 km/s for Sa’s– vmax ~175 km/s for Sc’s, – vmax < 70 km/s for Irr’s.
• For equal luminosity, vmax is higher for earlier types of spirals.
• The shape (not the amplitude) of the rotation curvesof different Hubble types is similar, despite the fact that they have a different brightness profile as seen, for instance, from the varying bulge-to-disk ratio.
• This point is another indicator that the rotation curves cannot be explained by visible matter alone.

The Tully–Fisher Relation• Using 21-cm observations of spiral galaxies, in
1977 Tully & Fisher found that the maximum rotation velocity of spirals is closely related to their luminosity, following the relation
Schneider 2007