-1Z-rl- (:2~ - CAL FIRE - Home CREEK SPROUT STOCKING STUDY ON THE JACKSON DEMONSTRATION STATE FOREST...
21
'.'-.. , , , ._.~ '-...-.......- HARE CREEK SPROUT STOCKING STUDY ON THE JACKSON DEMONSTRATION STATE FOREST CDF CONTRACT iSCA41648 JAMES LINDQUIST RPFi661 MARCH 23,1987 ~- -.~=--" -1Z-rl- (:2 ~ ~ jU .-~~ , '/,.. , n .~ " ,~ . ., r-;l ~ ~ /f- /,,'-/1 r- /~~ . 17 . 11 1,.,.,J..( _.. ~ r! ' 'Vv'4 --?"~ - ~ ~ ~~-- /~f ~ \ ,W. r't.g. ~ ..,t.i-'.-A "-"- ('1 (..;. - $(~ :..... " . /"' ~ +<:,<,4,. ~ ~ .jS'F .H ; 1 1.( . .~'<- , '. r '''.') ( /?/} (J \)J ,
-
Upload
phamkhuong -
Category
Documents
-
view
215 -
download
1
Transcript of -1Z-rl- (:2~ - CAL FIRE - Home CREEK SPROUT STOCKING STUDY ON THE JACKSON DEMONSTRATION STATE FOREST...
'.'-.. , , , ._.~ '-...-.......-
HARE CREEK SPROUT STOCKING STUDY ON THE
JACKSON DEMONSTRATION STATE FOREST
CDF CONTRACT iSCA41648
JAMES LINDQUIST RPFi661
MARCH 23,1987
~- -.~=--"
-1Z-rl- (:2 ~
~jU .-~~, '/,.. , n
.~ ",~ .
., r-;l ~~ /f- /,,'-/1r-
/~~. 17 .
11 1,.,.,J..( _.. ~ r! '
'Vv'4 --?"~ - ~ ~
~~-- /~f ~\
,W. r't.g. ~ ..,t.i-'.-A
"-"- ('1 (..;. - $(~ :....." . /"'
~ +<:,<,4,. ~ ~ .jS'F
. H ;
1
1.(
.
.~'<-, '. r '''.')
( /?/} (J\)J,

INTRODUCTION
Relevance of ~he redwood sprout population, afterlogging, to the subsequentmanagement of the coastal red-wood/fir stands needs to be determined. Informationaboutpotential sprout stockingcan affect planting level~ andthe species selected to augment the natural sprouts alreadyin place. Regardless of the m~rits of redwood sprouts ver-sus seedlings, the fact remains that managers often have todeal with a dense set of aggressive sprouts. How to takeadvantage of and deal with sprouting is the job that mustbe addressed. '
Assessing the role that sprouts play in restockingstands after logginghas not received much attentiin. Mostwriters and researchersof redwood have always pointed outthat redwood reproducesfrom,seed and sprouts. But, thereis very little detailed information about the amount ofsprouting regeneration, or about its eventual functionalrole in management of this forest type. Show (1932) re-ported that because of sprouting most second-growth standSwere from 25 to 35 percent stocked, and in the examinedcutover areas most of the second-growth was obviouslysprouts. Later Person and Hallin (1942) noted that in Hum-boldt and Mendocino Counties an average of 7.8 percent ofthe stocking as sprouts.Yield tables of Lindquist andp~lley (1963) reportedthat 65 percent of the second-growthredwood stems sampled in their data were sprouts.,
,-"
, Reasons for-the difference between stocking values ofthe 1942 study relative to the 1963 view, are related pri-marily to the sampling systems used in the studies, and,the age of the sprouts considered. Random stocked milacresampling, used by Person and Hallin on small regeneration,is the number of quadrats with sprouts as a percent ofthose examined. Most old-growth stands seldom had more than30-40 redwood trees per acre. The probability ,of samplingstumps was low, and only a' few areas contained redwoodtissue that could sustain sprouting. However. because ofits tenacity and ability to grow well in clusters, redwoodwill develop several stems in a small area. In this context-a low percent of stocked quadrats can mean a much greater.number of established trees per acre. Point samples used In''the Lindquist and Palley study select' sample trees bysize; larger trees having a greater probability of beingselected. Thus the yield table val~es- show that redwoodsprouts represent the most important part of the crop treesin the stands sampled. ' ~'
Analysis of the regeneration 20 years after logging aclear-cut second-growth stand showed' that most'redwoodstumps have sprouted (Henry,1985). The degree of sproutstQcking is affected by the number and d~st~ibutionof
. 1.

redwoodstumps in the cut stand. There can be significantreduction of planting costs when an adequate number ofsprouts are established. Choice of species to plant mayalso be influenced by the densityof the redwood sprouts.Fast growing sprout clumps may retard small Douglas-firseedlings. Finally, where redwoodsprouting is successfulthe species composition of futureharvests could be quitedifferentfrom the current second-growthstands. Repeatedcroppingmay create nearly pure redwood sprout stands un-/less major efforts are made to maintain other species. ~
OBJECTIVES
~,;
cifV- '1
,~\
c;vY/t\r
\ _?'- <
~v.{~ .v
The main emphasis of this study is to develop a loney/ CN ppvrange study of the role of sprouts in future management of (r'f.}Jr~ 'J--
commercialstands. Sampling the initial sprout population ..<csr}<
provides the basis for determining how the initial sprouts 'v~v.o(f/
develop over time. Many of the original sprouts in the .>'{0--'\ '
initialsurvey will die, and it is hard to judge now what ~
the current sprout population will mean to the stand in 20. /II""'
years. A set of mapped sample plots in three managerialoptionspermitslong rangeexaminationof sproutdevelop-.ment following: clearcut without burning, clearcut withburning,~election cut with no slash treatment.
Specific objectives outlinedininclude the following topics.
the study proposal
1. To determine if silviculturaltreatment affects theinitial number and distribution of sprouts, and howthese change over time. .
2. To find if there are correlationsbetween sproutingand the numberand sizeof redwoodstumps.
3. To develop a method of predicting sprout stockingprior to harvest, this can be useful for planningplanting operations. c- .
4. To establish a set of permanent plots withdocumentation of.'the sprout p6rtion of theregeneration. These plots can be used in laterfor studies of precommercial t~inning
goodstandyears
FIELD METHODS
Three blocks of the Hare Creek 1983 logging operations'were selected for sampling (figure 1). The blocks were. allin section 26 Tl8N R17W about 5 miles from the coast andsoutheast of Fort Bragg. Descriptive values from the sampledata show, an age of 80-85 years, with a redwood site indexof 155-160. The species distribution of stumps was 59 per-.cent redwood and 41 percent whitewood. Two blocks wereclear cut; block C, a 20-acre parcel was unburned, andblock D, a lO-acr~ parcel was burned six months after log-ging. The third area, block A, was selectivly logged andnot burned. All logging was finished by the spring of 1984.
. 2. .

\\
\"
\
~------
FIGURE 1. Loco1 i on of 1he 1983 Hore Creek 51 udy,
ood 1oyout of the somp1e p)01S.

All sprouts were approximately the same age when sampled.Burning of block D, autumn of 1984, destroyed the originalcrop of sprouts. The sprouts measured were those whicharose in the 1985 growth season. Before the start of fieldwork a layout of the plot distribution of each block wasmade. Some adjustmentof plot location was requiredbecauseof conditions found in the blocks. All field work 1n theunburned blocks was completed by May of 1985. Sampling theburned block was delayed until fall to give,new sprouts anopportunity to have a seasons growth.
Six.4 acre plots were located in each block. Randomnumbers to define the northwest corner of each plot weredrawn, then put on the X and Y grid of each block. Plotsare 132 feet square, and posts are set at each exteriorcorner, and for a .2 acre (93.3 feet square) interiorplot.Plots boundaries are oriented to the cardinal directions.
A transit measured the azimuth to each tree or stumpinside the plot. A computer program computed the X and Ycoordinates for each tree or stump from the northwestcor-ner of the plot, where X and Y equal O. To compute the co-ordinates of each stand element, relative to the transit,azimuth, slope angle, and slope distance are needed. Thestumps coordinates are adjusted by the transit's to placethe stump at its proper location on the plot's datum plane.
All trees and stumps within the plot boundarieswerelocated and put on the maps. Also recorded were species,diameter (at breast height or stump top),' stump height,number of crown and/or root clumps, estimat~d total numberof crown ~nd/or root sprouts, and height of tallest sprout.A clump was definedas a distinct group of sprouts on thestump separated from other sprouts. Sprout clumps noted butnot associated with a stumP9/were also mapped. These 10-,catio~were assumedto have a stump of zero diameterandheight. . ' , .
-,--
"~-
RESULTS
, Maps showing the distribution of stumps,aDdassociatedsprouts in this study represent a major aspec~ of this work(an example, Figure 2). Maps and data will be used later toestimate how the initial sprouts developed into stems. Themaps will allow future workers to know ~here all stumpswith sprouts occurred in the initialinvento'ry. Correlationof established stems to the initial sprout population willbe useful in discussing the value of sprouts in restockinglogged land. Some indecision about the value of sproutscomes from not being sure of the origin of older s~ems~Simply'being near a stump is not suffiriient ~roof ofsprouting. Conversely a single sternwithout a visable stumpdoes not mean that the tree is a seedling. Many clumps re-
, 3~ ' ,

----.-.-- .- .-. _...- -- -... .- - .... ...---.----------. ----..
FIGURE 2. Distribution of stumps in the .4 acre plotshowing the species, locationr and relative size.
H.RE CREEK, BLOCK D, PLOT 1-. .
I
. Hor e Creek.'!> . ". ". . 1!> . I PLOT0 ). . .
X I SEP1 27. 1985. ' J.llndQUISI. .,JI,. x I " Rd"'ood
X. x 'Douglas-rir. I
I.
. '!>xGrcnd fIrI "
x -.x
JC
e.\6o Hllrduood.
e . . . IJ< X . . I. X ..x x.
x t!) IEX . e. xIE
JC 1!>IE X
1!> !x . XXx t!1 x
x xX >f. ..x I
1!> '!> . .. ' 1!> III
. .. IeIto
x I
. -. -- . -
FICGRE 3.Dist=itiGn of stocked milacre quadrats.Numbers show the cluffipsin each of 400 quadrarts ofeach mapped plot.
HARE CREEK, BLOCK D, PLOT 1
0 0 0 0 0 0 0 2. 0 0 0 0 2 0 0 2 0 (} 0 00 0 0 0 0 0 3 0 0 0 0 3 2 0 0 0 3 0 0 20 0 0 0 0 0 0 2 0 0 0 0 0 0 0 0 0 3 0 00 0 0 0 0 0 0 0 0 0 0 0 0 0 0 0 0 0 - 0 10 0 0 0 {) 0 2 0 0 0 0 10 0 0 0 0 O. 0 0 00 0 0 0 0 0 1 0 1 0 0 4'0 0 0 0 0- 0 0 00 0 0 .0 0 0 0 0 3 0 0 0 2 0 3 0 5 0 0 00 0 o. 0 0 0 0 2 0 0 0 0 0 3 2 0 0 0 0 30 0 0 0 0 6 0 0 0 0 3 0 0 0 0 0 2 0 0 00 0 3. 0 - 0 4 7 0 0 0 o. 0 '5 0 .0 3 4 0 0 00 0 0 .0 0 O' 0 0 0 0 - 0 1 0 0.0 6 3 0 0 00 0 0 0 .0 0 0 0 0 0 0 0 5 11 0 4 2- {).. 0 00 0 O' 0 0 0 0 0 0 0 0 0 0 0 0 4 o. O' 0 00 1 2 0 1 8 0 0 0 0 4 4 0 0 0 4 0 - -0 . 0 50 0 0 0 0 0 0 0 0 3 3 0 0 0 0 0 0 2. 3 40 0 0 0 0 0 0 0 0 O. 0 0' -0 0 0 0 0 0 o. 00 0 0 0 0 0 0 0 0 0 0..0. 0 0 0 0 0 0 0 00 0 0 0 0 0 0 0 0 0 0 0 0 0 0 0 0 0 0 00 0 0 0 0 0 0 0 0 0 0 0 0 0 0 0 0 0 0 00 0 0 4 0 0 0 0 0 0 O' 0 0 0 0 0 0 0 0 0

ported in this study occur in locations where no stump wasvisable, or were on small stumps that would not show in 20years.
Quadrat stocking
An auxiliary of the maps are printed graphics that -showthe number of clumps in each of 400 milacre quadrats ineach-af the 18 plots (an example, Figure 3). These displaysshow the spatial arrangement of stocked and non-stockedquadrats of each plot. A summary of the stocked quadrats,Table I, reveals that quadrat size effects the percent ofstocking. Average stocking of the 4-milacre quadrats is30.8 percent, three times that of the milacre quadrats,10.9 percent. In the three blocks the percent of stockedmilacre quadrats is 3 percent more than that reported byPerson and Hallin's 1942 study of cutover old-growth. The11 percent of the milacre stocked quadrats represent 110stocked quadrats per acre with an average of 390.2 clumpsper acre. Recent results from the Whiskey Springs studiesindicate' that it is reasonable to expect at least one es-tablished tree per clump in 15 years. This projects to 390redwood sprout stems per acre from the sprouting now inplace. '
Analysis of variance (ANOVA) of the'percentof stockedquadrats, of both size quadrats, reveals no significantdifferences among the three treatments. Nor were theresignificantdifferencesamong the average number of loca-tions with sprouts. Since the three blocks have no differ-ences in the unrlerlyingsprout stocking we assume homoge-neous initial stand stocking.Differences in sprout, devel-opment, which may later arise, are then more closely r.e-latedto treatmentby cuttingor burning. .
Linear regressions- that express the relation of -clumpsand sprouts to the percent of stocked quadrats are detailed -
in Table 5. The statistic, the correlation coefficient (R),shows the degree of association between two ~ariables.Clum~s per acre have the strongest rel~tion to quadratstocking,sprouts are less well correlated; All values of,R, as tested by the,' critical values of R (Table 21, : Zar,1974), are shown to be significantly different from'O.These details show that there are positive linear relationsof sprouting to quadrat stocking. "x (graphic view of theserelations are also shown in Figures 4 and, ,5. ~tocking ofeither size quadrat has a linear e~uation that-is useful toestimate sprouting activity (Table '6)..-
-,
Levels of sprouting
Details that describe the sprout po~ulatlons-ar~ ihownin Table 2. Large standard deviations of sprouts and clumpsoccur~,in blocks A and D as compared to block C~ 'How~v~r,
4.
~-./

Table 1. Summary of the stocked quadrats of the 18 mapped.4 acre plots of the 1985 Hare Creek Study. Number of siteswith sprouts from map data expressed in per acre terms.Results based on 400 milacre and 100 4-milacre quadrats.
----------------------------------------------------------
Block -C,Plot
123456
clearcut unburned.Sprt sites I-Milacre(No/acre) (%)165.0 13.287.5 6.0145.0 10.7105.0 8.5117.5 7.8157.5 11.8
4-Milacre(%)
39.019.028.026.023.033.0
----------------------------------------------------------
----------------------------------------------------------
~--------Ave. .
SD140.4
63.7.10.6.. 5.0
u. -'.-- - .-"30.5
13.7
- " - -
----------------------------------------------------------10.9
. 5~018 PIt.Ave ~42.418 PIt. SD 66.6
30.813.2 .
_.
.',
.. .--,. ,
Ave. 129.6 9.7 28.0SD 31.0 2.7 7.2
Block A, selection cut unburned.7 90.0 6.0 15.08 100.0 8.5 27.09 110.0 9.2 31.0
10 327.5 25.0 60.011 225.0 19.0 52.012 90.0 6.5 19.0
Ave. 157.2 12.4 34.0SD 98.1 . 7.8 18.1
Block D, clearcut burned.13 160.0 13.2 40.014 80.0 6.8 22.015 157.5 10.2 - 30.016 152.5 13.2 .38.0 -p. - - . -
17 235.0 .17.0 45.0--
18 57.5 3.0' 8.0

F1GURE Ll, C1ump5 per ocre over quodrot 5t ock Ing
1evels (or 18 p)ots of the Hore Creek study 1984.
4-MILACRE QUADRATS
.
..
. .-
. -. .
fCJ 2CJ 3CJ 4CJ ~CJ
STOCKING LEVELS (percent)51:1
. .
saaw
75C!Iocua:oc I
w 5m1a..
V)a..1:: 4SCJ::J-1
.uoc 3ae!wm1:: 15Cli::JZ
e.
j
I-MILACRE QUADRATS9CJ
w
75CJ I
.0:: .--<' - ..-u -. - ...-- . -
a:I .0::
W
5CJCJTa.. -- .---l/} .a..
4SCJ-+-- .
1:: .'::J-1U
3(j(j
w
1sa I..
.ro .1::::JZ
eIb(j 5 fS 2CJ 25 3"CJ
STOCKING LEVELS (percent)

FIGURE 5. Sprou'ts per oere over quodro1 s10ck iog
levels {or 18 plots o{ the Hore Creek study 1984.
4-MILRCRE QUADRATS
..
.
. . .
... .. .
re 213 3.CJ 4'CSTOCKING LEVELS (percent)
e 5'13
I-MILACRE QUADRATS
--
... .. .
--. --
.-.
~ ,
..
...
---
re. 1'5 2e 25-:STOCKJNGLEVELS (percent)
3"13
5(Lw
ua: 5C1
wc.. 4C1C1U1I-::>
3C1C10
Q..U1
2C1c)IXWenr:: lClCl::>z
e Ie
5C1C1w0:u
SBCIa:..
wa.. 4eCl1I1f-::J
3C1C10a::a..V)
2C1C1a::wen
lCle!1:::::>z
Iee
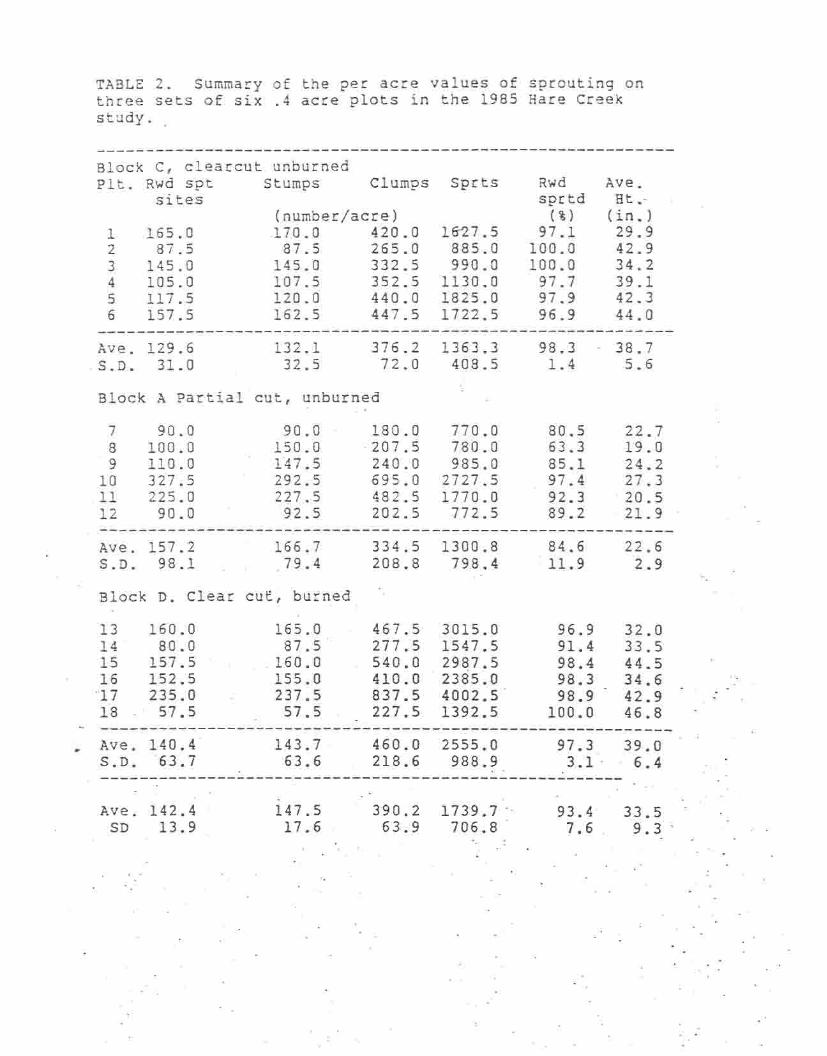
TABLE 2. Summary of the per acre values of sprouting onthree sets of six .4 acre plots in the 1985 Hare Creekstudy.
-----------------------------------------------------------
.
Block C, clearcut unburnedPIt. Rwd spt Stumps Clumps Sprts Rwd Ave.
sites sprtd Ht.-(number/acre) (%) (in.)
1 165.0 170.0 420.0 16-27.5 97.1 29.92 87.5 87.5 265.0 885.0 100.0 42.93 145.0 145.0 332.5 990.0 100.0 34.24 105.0 107.5 352.5 1130.0 97.7 39.15 117.5 120.0 440.0 1825.0 97.9 42.36 157.5 162.5 447.5 1722.5 96.9 44.0
-----------------------------------------------------------Ave. 129.6 132.1 376.2 1363.3 98.3 38.7-S.D. 31.0 32.5 72.0 408.5 1.4 5.6
Block A Partial cut, unburned
7 900 90.0 180.0 770.0 80.5 22.78 100.0 150.0 -207.5 780.0 63.3 19.09 110.0 1-47.5 240.0 985.0 85.1 24.210 327.5 292.5 695.0 2727.5 97.4 27.3
-11 225.0 227.5 482.5 1770.0. 92.3 .20.512 90.0 92.5 202.5 772.5 89.2 - 21.9-----------------------------------------------------------
Ave. 157.2 166.7 334.5 1300.8 84.6 22.6S.D. 98.1 79.4 208.8 798.4 : 11.9 2.9
Block D. Clear cuE burned
13 160.0 165.0 467.5 3015.0 96.9 32.014 - 80.0 87.5 277.5 1547.5 91.4 33.515 157.5 - 160.0 540.0 2987.5 98.4 44.516 152.5 155.0 410.0 2385.0 98.3 34.6--17 235.0 237.5 837.5 4002.5 98.9 42.9
..
18 57.5 57.5 227.5 1392.5 100.0 46.8.-- ------------------------------------------------------------ -
Ave. 140.4- 143.7. 460.0 2555.0 97.3 39.0S.D. -63.7 63.6 218.6 988.9 3.1 - - 6.4------------------------------------------------------
-
Ave. 142.4 147.5 390.2 1739.7"- 93.4- 33.5SD 13.9 17.6 63.9 70698 7.6 9.3
:" - .

spr'outing was recorded' as being at the root collar orhigher on the stump. Clumps not directly ~n contact,' withthe ground were consider,ed as, crown./Overall~ 12.8 percent
, of clumps, and 9.6, percent " ,of the sprout.s~ wer'e _<:=alled . asbeing, of cr~wn origin,( !Table' 3. Analysis of varlaric~--ofthis clump data shows a highly significant difference arn~~gjblocks.'There is a' significant difference /ofsproutsU'among.. '-,-~"
, the blocks. The heaviest crown sproutirig is in block' C, au, I
clear, cut with 21 percent of 'the'clumps and 16 percent/of,the sprouts classed ,as crown. Lowest inci~enc~ of crown' .'~sprouting'is in block D with clumps' a"t 6.6l and sprouts 4.8 '"
percent. Differences betw~enthe two clear' cuts may,r~suit,i-from burning slash. Crown stumps have a higher risk of' .loss when the' underlying 'stump tissue fails. Block D was,'burned six months after logging: this destroyed the initial'
" / '
crop of sprouts. Sampling was,delayed until new sprouts had, , 5.
there are no significant differences among the number ofsprouts or clumps in the three blocks. The overall view isthat, regardless of the silvicultural system or slashtreatment, redwood stumps can produce a large number ofclumps and sprouts. There is a large number of well estab-lished vigorous sprouts within a year of logging.
Note in Table 2 in the partially cut plots that someplots have more sites with sprouts than stumps; some uncuttrees have sprouts near the base of the stern.
Average sprout height of the tallest sprout at eachsite is'also shown in Table 2. Average heights and standarddeviations of,blocks C and D are nearly equal. Averageheight of block A is about 16 inches less. ANOVA reveals asignificant height difference among blocks. The Neuman andKuels multiple range test (MRT) (Zar,1974) indicates thatblock A is significantly different from blocks C and D.There is, however, no difference between blocks C and D.
Percent of redwood stumps with established sprouts 'isalso reported in Table 2. The ANOVAof this data reveals ahighly significant difference among the percents reportedfor the three blocks. The Neuman and Kuels' (MRT) revealsthat the difference is between block A and the two clearcutblocks C and D. There is no difference between the sprout-ing percentage of the ~wd clearcuts. Clearcut blocks exceed95 percent sprouted~ and the partial cut exceeds 80 per-cent. Ages of the stands are generally 80-85 years at stumpheight~ Information ,from a hearby commercially thinned40-year stand showed' 95 percent of the redwood stumps hadsprouted. There is no evidence that these older stumps havelost any capacity to sprout heavily. without plot 8jblock Ahas a" sprouting rate of 98 percent, much like th'at of theclearcut blocks.
, ,
Crown :sErouting rate - ,- -
'-'
". .-
/', I
i ,~O". -
.,.

Table 3. Average number of crown clumps and sprouts peracre for three logged blocks of the Hare Creek sproutstudy.
----------------------------------------------------------
BlockCrown clumps/acre
Per.ofAve SD total
Crown sprouts/acrePer.of
Ave. SD total~--
CAD
_78.341.230.4
19.628.729.3
(%)20.812.36.6
218.8117.9121.7
67.4101.6101.5
(%)16.09.14.8
---------------------------------------------------------
Total 50.0 25.1 12.8 152.8 57.2 8.8
Table 4. Cumulative percent of redwood stumps and sproutclumps by stump diameter class. Averages for the threeblocks are based on six plots per block..
Dia.Class
Rwd clumpsBLK C BLK D BLK A
Rwd stumpsBLK C' BLK D BLK A
----------------------------------------------------------
.. -- u. ... ..
-
~Nolacre
-.
376.2 460.0 334.5 129.6 140.4 . . 161.7- ...-
'. -- - - "-
,.
""".. . 0
~- "-".~. - .-
~~ "- .--
o.
." . u - - .
--"
.
, .
. .
(in.) (percent)1 11.9 9.8 25.3 24.1 21.1 36.75 20.3 24.7 . 33.4 33.1 40.0 43.110 28.0 37.6 44.1 41.2 54.0 55.215 49.7 60.9 . 62.6 59.7 72.4 71.020 69.5 82.4 76.7 75.2 88.1 82.325. 83.6 88.6 87.7 86.1 92.9 91.7.30 92.3 95.9 97.9 93.6 97.3 97.235 . 98.6 98.3 99.2 . 98.5 98.8 - 98.9
. . . .----------------------------------------------------------

grew, but many burned crown clumpsthe fall of 1984.
had not resprouted by
The total number of clumps in the burned block is 122percent of the clumps of the unburned block. But, crownclumps in the burned are 39 percent of crown clumps in theunburned.Since-there is no difference in stumps per acrethere is a strong suggestion that burning has reduced theamount of high risk crown sprouts.
Small stump sprouting
Small diameter stumps are important to the totalsprout restocking. The cumulativepercent of -numbe~ ofsprouts and stumps by diameter classes are shown in Table4. About 25 percent of the clumps occur on the 38 percentof the stumps which are 5 inches or less. This portion of'the stand contributes to sprout regeneration capacity farbeyond its e~o~?nic value. stumps larger than 25 inches,~thelargest 10 p~icent, ha~e13.4 percent of the clumps.Only 52 sprout clumps per acre are on 14 largest stumps ofthe plots.
- Whether sprouts growing on the small stumps develop invalue as those on larger stumps can be evaluated after aperiod of time. Small stumps, 1-2 inches, are not likely to.'be visable after a period of 10-15 years; this makes itdifficult to .identify tree origin. Tracking sprout locat-.ions with maps allows correct attribution of the origin of--each stem. -
Regressions and correlations
~\
.Thesecond objective listed was to determine whetheruseful relations exist between sprouting levels and stumpdiameter. These'rela~ions are examined'by calculation o~.linear regression and~ plotting of the data. Pertinen~val-,u~s of the regressions for each of the 18 plots are shownin Table 5..Visual examination of the plotted data and the -
L'equation statistics' show littl~ eviden~e ot a strong linea~"-trend in most' of ~the. plots; seldom'do the R val~es e~ceed.6. The equations estimate number of clumps or sprouts fromstumps diameter.' The range. of' clumps and s'p'r'outs'£:or. astump diameter is wide,-and it is not possible to make' re-liable estimates of a stump~ re$ponse. The average standard'error of estimate. (SEi) ,'is 1.32 . clumps, this is 48.5 p~rc-'ent of the avera~e of 2.81 clumps' .per'stump. For sprouts'the SEy avera~es 64.2 percent of the average of'sprou~s'per~stump. :,:., ','.' :-""~::-:':'-'
. ,
Useful estimates of sprout height. cannot be made fromstump diametet. Results of linear regression computations'(Table 5) show that R seldom is greate~ than ,.5, most rangefrom .1 to .3..This'leve~' of correlation is'low, and .does
- 6.' .' -.'
, .-
, .
--- - ---- .,
- .----,
'.. -.-..- --, ~
-----
. .'
""- ,-~-=-
P,' -
_n- '-
- '."°:,'-.~--
.-" -
. ,"

-,,- "." c- "-c '.-,,.,-'... -'-_."--"",,.,,"- -- _h"~ ~"-",,~.__O- ~.."-- ".
Table 5. Linear regressions of clumps and sprouts per stumpas a function of stump diameter. Height, tallest sprout oneach stump, is a function of stump diameter. Information
- from 18 plots mapped after logging in the Hare Creek 1983operations of the Jackson Demo. state Forest. Values are:a=intercept; b=slope coefficient; R=corr. coef.
----------------------------------------------------------clmps/stmp
PIt. a b Rspts/stmpa b R
height/stmpa b R
iNo.obs.
---------------------------------------------------------123456
1.94 .0421.97 .0731.66 .0831.60 .0972.09 .1092.43 .037
.37
.43
.57
.59
.50
.23
.45
.46
.19
.51
.41
.37
.55
.31
.74
.43
.85
.71
7.18 .1906.83 .2284.22 .3413.55 .397
10.55 .3205.98" .445
3.50 .4024.58 .3226.65 .1875.52 .3984.45 .3795.36 .207
9.69 1.0910.65 .5514.44 1.238.47 .8554.92 1.296.60 1~19
.32
.32
.65
.51
.34
.55
.64
.39
.25
.41
.47
.37
27.935.224.831.331.836.3
.141
.5391.281.429.670.693
23.7 -.07817.6.14526.8 -.20823.2 .52518.6 .21219.7 .135
.59 27.0
.33 32.7
.63 29.9
.65 26.8
.83" 29.1
.82 34.1
.10
.22
.68
.25
.27
.31
663558424763
.08 36
.14 "" 4D
.17 44
.27 131
.19 90
.10 36
.11
.05
.53
.44
.66
.46
64"32 "
6361
",,9423
Table 6. Linear regressions and correlations of relationsof sprouting and stand values of-the Hare Creek sprout._~study of 1985. Values are per acre and computed from data"" " .
"of 18 plots shown in tables 1 and 2. a=intercept, b=slope,"" "--,,- - -"-=-,,--" :"~=-o. . .-- " - --,,-
R=corre1ation coefficient, N=number "" """ "- ".. ~"'" ""i--;:;'~" :. -- -" ",,-------------------------------------------------------------
789101112
1.45 .0441.47 .0601.85 .0261.43 .0911.60 .0601.51 .047
1.98 .1122.50 .0621.86 .1322.02 .0791.57 .2122.24" .116
.603
.0941.24.9341.47.862
--- - -"
~~~"--~=~':~::~--_:~~=~~~::~: ~ ~ ~~~o~,~".- ,,'" ,,-:~~" ~<:,,~,,~,,-.
13141516,,1718
1 No~C1mps. % stkd. lnii1. 104.58" 26.288' .798 "18 "" ~.~" .~ -",,"
2 No.Spts. % stkd. lmil. 565.05 108.099 .619 ." 18 "
3 No."Clmps. % stkd. 4mil. 69.45 10.404 . .774 ,,184 "NO.Spts; % stkd. 4mil. 375.03 44.260- .622::18 ".S No.C1mps irwd stmps 31.34 " 2.4335 " .823' ':;L8 :o"~:"",,".:~',,",,-':'
6 No.Spts. Irwd stmps 250.0110.0998"-" .645" "'":180.,,...,,: ""-,,
7 No.Clmps "tsptd sites 65.99 2.2779 .858" "018::.": ". "" "
8 No.Spts. isptd sites 394:41 9.4500 ".673 18_"9 No~Crown trwd stmps" 35.04 .0857 .286 18 : -
10 No.Clrnps~ Irwd strops," '. 5.22 2.9,,938" .901 ',," , 12."" "" '0"" ."
11 No. c1mps tsptd si tes " 9.48 3. 0270 .~03 -" 12; ""~- ""-" '~ . . ,,",
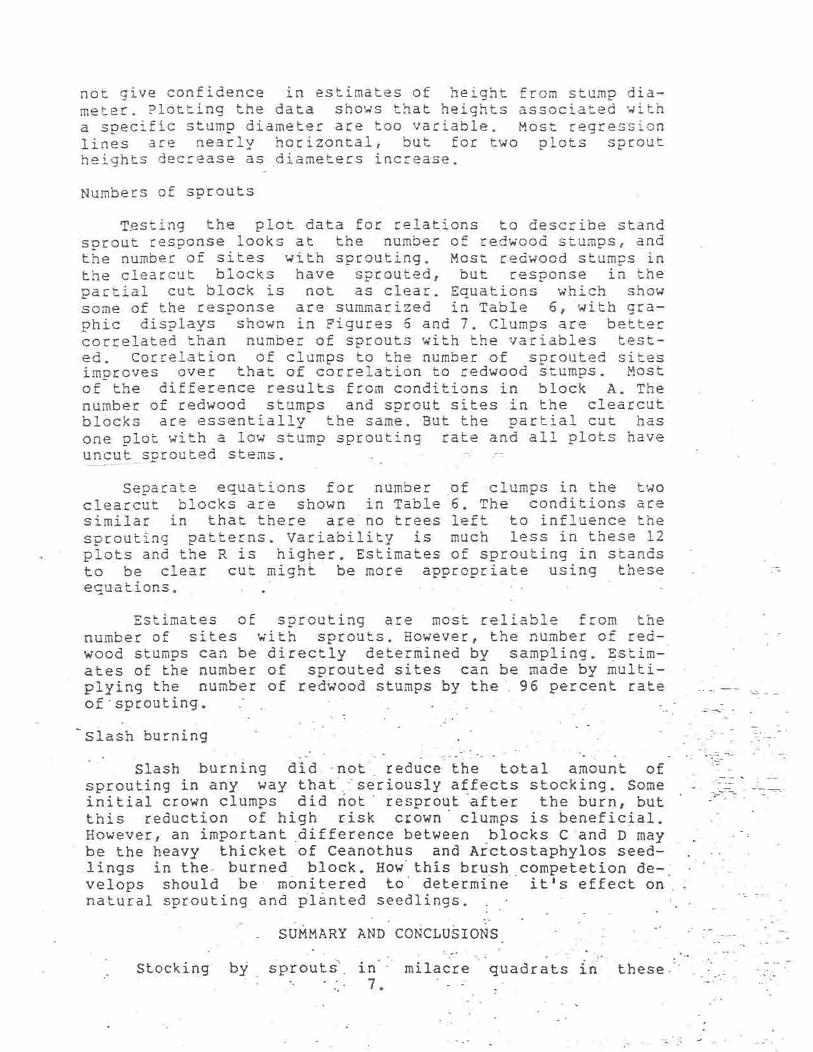
not give confidence in estimates of height from stump dia-meter. Plotting the data shows that heights associated witha specificstu~p diameter are too variable. Most regressionlines are nearly horizontal, but for two plots sproutheights decrease as diameters increase.
Numbers of sprouts
T~sting the plot data for relations to describe standsprout response looks at the number of redwood stumps, andthe numberof sites with sprouting. Most redwood stumps inthe clearcut blocks have sprouted, but response in thepartial cut block is not as clear. Equations which showsome of the response are summarized in Table 6, with gra-phic displays shown in Figures 6 and 7. Clumps are bettercorrelatedthan number of sprouts with the variables test-ed. Correlation of clumps to the number of sprouted sitesimproves over that of correlationto redwood stumps. Mostof the difference results from condition~in block A. Thenumber of redwood stumps and sprout sites in the clearcut'blocks are essentially the same. But the partial cut hasone plot with a low stump sprouting rate and all plots have~_~f,~E-,-§prau!:~.c]-~tems . . F r
Separate equations for number of clumps in the twoclear~ut blocks are shown in Table 6. The conditions aresimilar in that there are'no trees left to influencethesprouting patterns. variability is much less in these 12plots and the R is high~r. Estimatesof sprouting in standsto be clear cut might be more appropiiate using theseequations. , .
Estimates of sprouting are most reliable from thenumber of sites with sprouts. However, the number of red-wood stumpscan be directly determinedby sam~ling.~stim-'ates of the number of sprouted sites can be made by multi-plying the number of red~ood stumpsby the',96 percent rateof 'sprouting. . ' - .-
~ Slash burning"
, . .'". ",., ,, .
. Slash burning did -not~,reduce the total amount ofsprouting in any way that',~seriouslyaffects stocking. Someinitial crown clumps did riot'resprout ~fter the burn, but'this reduction of hLgh risk crown' clumps is beneficial.How~ver, an important ,difference'between ~locks C 'and D may
,be the heavy thicket of Ceanothus and Arctostaphylos seed-,lings in the- burned block. How'this brush competetion de-'velops should be' moni tered to' determi'ne" it IS effect on-,natural sprouting and ~l~nted seedlings. ' ,
.'::::: - . ~_.
-:--::-:--:,..,-'
SUMMARY AND CONCLUSIONS.-
stocking", :''-' :. -.,.' . ..." ':':..,: . . . ':'
by ..sprouts'. in' milacre quadrats in these --, "-, ., 7 . " .;' "-'
.- ,- .-:

F1GURE ~. Sprouts ond clumps per ~cre over the
number of redwood stumps for 18 p)ots of the Hare
Creek study 1984.
WIYUa:
IYwa..
bB~REDWOOD SPROUTS
s()e
4~[j~
3[j[jd..
.
U1t-:JaIYa..U1
IYWCDL::JZ
2D[j
...
.
J(~e
3"CJ~
C1
e
,-- "-
. -- '.
REDWOOD CLUMPS
- , - -- --- ---'~"'-',~-<---~" ,-,.-'-
-. - . -,. ~, '.~- ... -~= - ~~--::~.>;~~~~
"".-'- -,- ..._-- . -
.2". .>~Z .~~.~~~..' '-'.-"<' ~.:~.::::
.,'- - -
."
,,-- ~.,', '-
.
..: '::: '.-::' "~:~.:-..'.;. - -.-'- -, -. -, --, ..
. ,
.. ,'," '-'" ".,.''. -~"~,:' ::2:~h~'~~~:~-~'-;
. '..
,..
'. ." ':.:.- "";-i,,.:<.~~
25e;~.. 3CJ(;~;~.lff:7ACRE ' ~. '" '
--' .'.
,'..-. . ,', r'.
. . --',', , '. .'. -.
5CJ , fee. .: fSCJ 2~CJ..
NUMBEROF REDWOODSTUMPS PER
- - ... --------. -.---1
e n l'SCJ 2nB 2SeNUMBER OF REDWOOD STUMPS PER ACRE/
9(]
wCt:u 7SCJa:
"
cr.w
E>CJCJ(L
V)a..
4SCJL::J--1U
3(]CJ
wCDL: 15CJ:Jz
CCJ

w~ua:~wQ..
U1CL1:::J~U
REDWOOD CLUMPSsee"
7se-, " " -,'. '-. .',
''', -"',C-'""" "=- ',- -'"
." ...,-
. ..,' .,~ -.:: - -,'.;- ~--'...:. '-, =-,,--,c '.: -~~-,,.. ,--'--.'
"
-- "-"
G~e.. -.. , ','
, .- -'. ,.- .. . .. .' ..~c.,--,- .. . - ,'--.. .. '-- :i >- ".: _.~:...r''''
,,' '- .- .' . ., "- - --- ' ,-"
- ,>: .:: ,- - -,.
4se '. . ~:":~~~ . ',. ,",
.'-. .. ',', ,
"
~wCD1:::::>z
3Be .
. .".,' ...~/~-:"cii~~;. -".' p,
.lS{j
. ..e
,-, -.'"
(j6~~-;~i~~~e r~~: r5~ ,,- 2eC1 "''', 2SC1NUMBER OF SPROUT S1TE5 PER ACRE
C)
F1GURE '7. Sprou'ts end e1umps per oere over the
number o( sprou1ed sl1es (Dr 18 p)01S 0( 1he Here
Cr e e k 5 1 u d Y 1984..
5 (j CHLREDWOOD SPROUTS
w
S+
0:::ua:0:::wQ.. 4C](JL .
U1I-:J
3{j(jura ..(Y ---- ..Q..V1 I .
2DD!Y
,
. -----= .w .CD .1:: HD'-L4-:J ------ . .:z.
eC1 5C1 1'ee l'S/j 2'/j{j 2'S/j 3'!]()
NUMBER OF SPROUT SITES PER ACRE

second-growth stands is not much different than reported'in1942. However, the numbers of clumps and sprouts suggests arobust fast growing sprout population that could be a standof 400 established trees per acre in a few years. Thissprout population may not have the best spatial distribut-ion that management would like. Some additional inter-planting of redwood or Douglas-firmay be required to stockobvious openings. Clearly, you should not depend on a sim-ple value of milacre stocking to describe the sprout pop-ulation. If we assume one established stem per clump in 20years the stocking of the 4-milacrequadrat is a more use-ful measure of site occupancy. The 31 percent stockingmeans 77 quadrats with an average of 5.1 established stems.
Redwood averaged 60 percent of the total number ofstumps in the blocks, and sprou~ regenerationaverages 390clumps with 1739 sprouts per acre. Average height of thetallest sprout, at each sprout site is nearly 3 feet" and,about 90 percent sprouts are root collar origin. There isan aggressive well', established regeneration compone'nt inplace that, is vital to the final crop. Estimates of ' thesprout regenerat~o~ can be from the equations shown inTable 6. Wh-i-:l-e-t.henumber of" individual sprouts is con-stantly in flux; but we can assume at least one well es-,tablishedstem per clump site. Number of redwood stumps is'the most useful measure for making predictions of sprout'regeneration.The most valuable use of the estimate$ is toplan the planting to meet desired stocking levels. Plantinghas to be monitored so that it improves the distribution ofthe new stand at least cost.' '
)tI'5 '1,
.- - -'I~
"
/- ,;:- /1 ;,>'" " .' , .
Small suppressed redwood are often 'overlooked, butthey have ~vital role in the sprout restockingof loggedsites. Nearly~,25 percent of the clumps were on stumps 5inches or less.'~/Thereappears to be no difference' in thevigor of,sprouts between small stumps a~d large stumps. It
- ~simportant,that small suppressed stumps'be recognized and .'~'
,incrude,~..in: sampli,ng, the ,re,d~~od stump component. , -" ,- - ,':- " -=."'<-' '-= :-::.~-',. " , ", ;
~ 'There" is ,Ii ttleto\;'-gained by using "the prediction '" - . : ,:::~,:.:..:-
equations' 'of c~umps or sprouts, per stump ,from stump dia~"" -,'~,'~~~''meter (Table 5). Most stumps sprout; but the correlation of" "'"'- " -', "
sprouting to "stump'di?met~r 'is 'poor,'and of limited util-' ~.~-~ity. Sprout heights" are also poorly correlated, to stump ".1." ~ '
~iamete: '. and the equations ~ave, litt~e' practical value. It, ,~~ t. rtk.-
1S sufflc1:nt to know, that. 1n, the flrst growth sea'son many "~ ;.:,~,IC..
<:> "
<?f thes~ vlgorous sprout~ w1ll ;re~ch 4.S.feet. ;:..,,:,''::''-'-'<~=?>~7tr:.:':~,;:-", , ' ,. ,<, ' ':~';:-;'<,:.c:'::':" ' ',:';:':' " ,,:. ',; " ",~'7"':'>,.~" ,
, ~~-- RECOMMENDATIONS"",',' ,,' , ,:'.:~ -,,' " ,
,
/ /',
~j
/
," , ,
Specifici-deas about the, sprout population revealed Inthis study lead to some speci~ie- operationalsU9gestions~The main notio~ of these recommendationsis that the sprout.population"'willdevelop into' a vigorous component,of the
, , 8. ' " ,
'"

next stand. It is expensive and unwise to not consider theimpact of the native sprout population on management acti-vity. Costs of planting are high, and unnecessary treesshould not be part of restocking activity.
1. Sample cut blocks to determine the number of red-wood stems, take care to sample the small redwooddown to the 1 inch class.
2. Estimate the number of clumps per acre to expect onthe existing redwood. These estimates will help theordering of seedlings from the nursery.
3. Work closely with planting operators to develop anunderstanding of how to adjust planting patterns toexisting sprout populations.
4. If planting Douglas-fir; they should not be plantedclose to the heavy clumps of sprouts.
5. Evaluate effects of burning on the degree of brush/ .
competetion'OB-planted seedlings. In block D a yearafter the burn a very heavy carpet of brush is inplace~ .
. .
.."-'-;"". - ..-n . "'-
, -' .~--=--'.. . --
, .- - "- ., .., .
- ..'" '"
_. . -....;.,-". .:-. . u-::-:-.:~'-;;
."':..' -..'- .', "-.... . ~. '.- .-~.'-'-'.. .". . ',-'-'..
.. ~.".. '-;:';:~"_:~, ,".
.
"-""-"...
- - '-.,
-,. ,
-- - .' L..'"
-..... 0"" .
-. '.. .
. .
- ,,<
C', -,C ',., ,
..-. . "
..:.". .-,. .::"'.'::; ~.-
9.','
.' . '.'.. .., ..--:.;...:-'-"~.. - ,.,- ..'
...
'...

LITERATURE CITED
1. Henry, N. 1985. Early growt~ and yield three years afterprecommercial thinning in -third growth- redwood. JDSFNewsletter No.19. Cal. Div of Forestry, Fort Bragg. 7pp.
j)~----r'
Palley. 1963. Empirical yieldredwood. Calif. Agric.Exp.sta.
2. Lindquist J.L. and M.N.tables for young-growthBul. 796. 47pp.
3. Person, H.L., and W. Hallin. 1942. Natural restocking ofredwood cutover land. Jour. of Forestry. 40:683-688.
4. Show, S.B. 1932. Timber growing and logging practice inthe coast redwood region of California. USDA Forest Ser-'ice. Tech Bul.283. 22pp.
5. Zar,J.H. 1974. Biostatistical Analysis. prentic~-Hall,Englewood Cliffs,NJ. 620pp.
~,
--
-
"',.u,', .,
.. " " .. " '.".
"
,
"
- '. "'':';':' ;, ., 0 ._~--, -'." .,,=.. u '. .. .
-.:.":=-. :.~... .'..'~;-::',:,"'.:-' - '--c:-:.
-' ,..
'. """
., ';e,:, -'.. ",'"," ,',.-:-- ,.":
.'
'.,,". ' ',' '--,.'
- '- ,,:;: ''';;',-",~,".~-::'_'::-, ,.'"
,:, ' .. . ,.'.' ';; "
:'. . ',. . :~,:~.it~~~-'::~~~\~~:-::-
'.
.,~~,. ~'.. - 0-" ,.--,;"'.:." . -,
.,~.':~ :',',"
" ."~
, ,"'';''. ,'.
,~;; ~'/::'~E~~':":~~=~ ,- "~~'----' " ,
, ,.'...,,' '-'
'., ':..,~ - .":.',.': 0',
10.
.. ",
.:,..,;,:~,.'.::~~;:'~,'""","-
.,:,,':X';':,..~:f~,,~--<L;L:~. .",.
..-.


![Biochimica et Biophysica Acta - CORE · fluctuations, the model predicts a linear dependence of the relaxation rate, R 1Z=1/T 1Z, vs. the square of the order parameter [41]. R 1Z~K](https://static.fdocuments.in/doc/165x107/5e8756335489a70aea6a4d2a/biochimica-et-biophysica-acta-core-iuctuations-the-model-predicts-a-linear.jpg)