· 12/7/2018 · If a person below poverty line wants to buy a car, it is only a desire but not a...
76
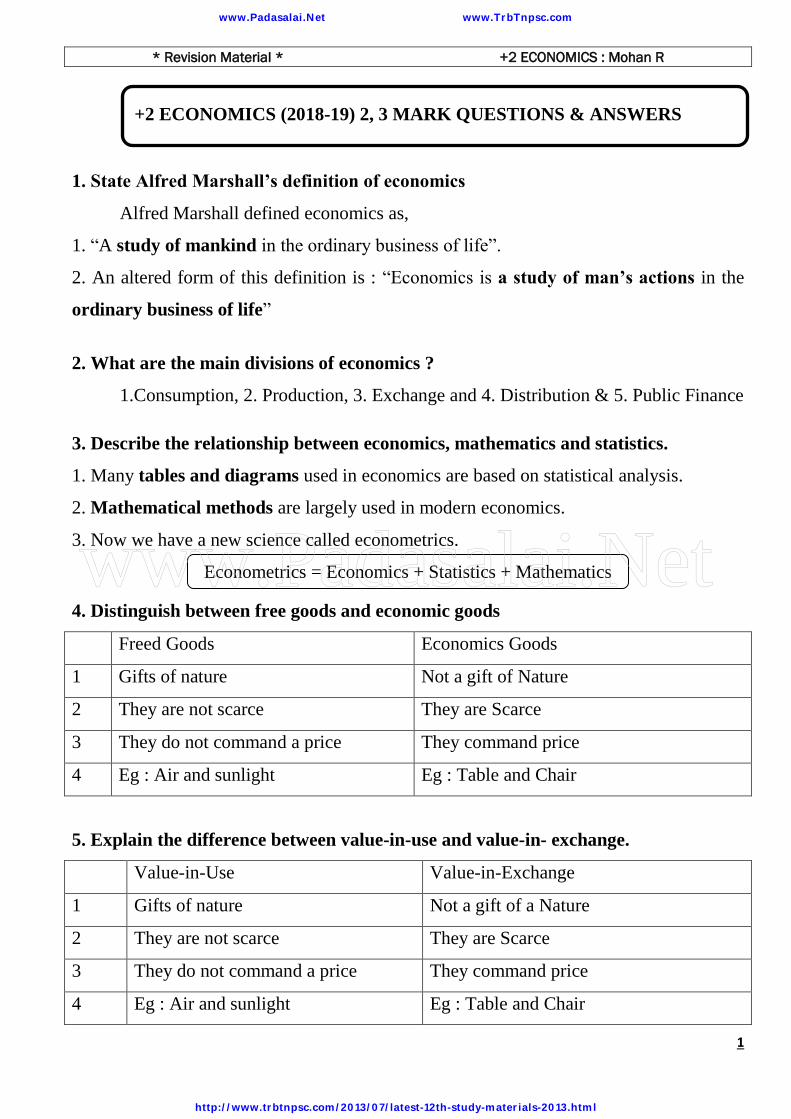
* Revision Material * +2 ECONOMICS : Mohan R 1 +2 ECONOMICS (2018-19) 2, 3 MARK QUESTIONS & ANSWERS 1. State Alfred Marshall’s definition of economics Alfred Marshall defined economics as, 1. “A study of mankind in the ordinary business of life”. 2. An altered form of this definition is : “Economics is a study of man’s actions in the ordinary business of life” 2. What are the main divisions of economics ? 1.Consumption, 2. Production, 3. Exchange and 4. Distribution & 5. Public Finance 3. Describe the relationship between economics, mathematics and statistics. 1. Many tables and diagrams used in economics are based on statistical analysis. 2. Mathematical methods are largely used in modern economics. 3. Now we have a new science called econometrics. Econometrics = Economics + Statistics + Mathematics 4. Distinguish between free goods and economic goods Freed Goods Economics Goods 1 Gifts of nature Not a gift of Nature 2 They are not scarce They are Scarce 3 They do not command a price They command price 4 Eg : Air and sunlight Eg : Table and Chair 5. Explain the difference between value-in-use and value-in- exchange. Value-in-Use Value-in-Exchange 1 Gifts of nature Not a gift of a Nature 2 They are not scarce They are Scarce 3 They do not command a price They command price 4 Eg : Air and sunlight Eg : Table and Chair www.Padasalai.Net www.TrbTnpsc.com http://www.trbtnpsc.com/2013/07/latest-12th-study-materials-2013.html www.Padasalai.Net
Transcript of · 12/7/2018 · If a person below poverty line wants to buy a car, it is only a desire but not a...
* Revision Material * +2 ECONOMICS : Mohan R
1
+2 ECONOMICS (2018-19) 2, 3 MARK QUESTIONS & ANSWERS
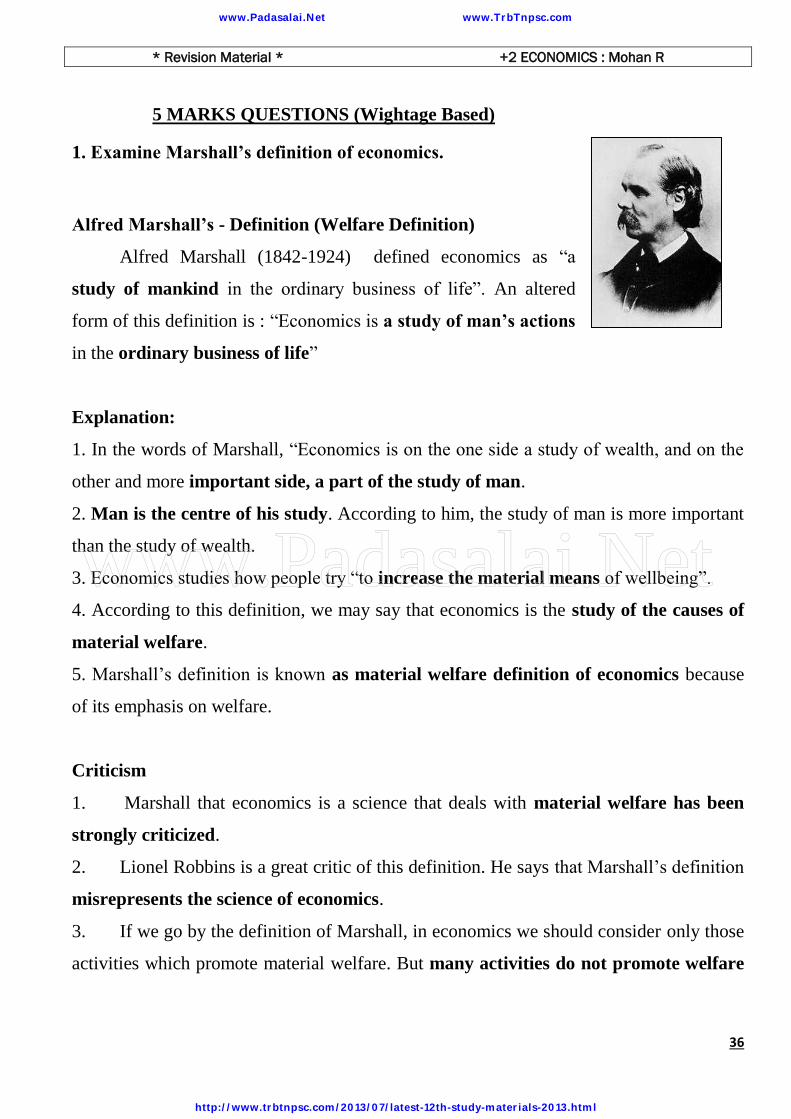
1. State Alfred Marshall’s definition of economics
Alfred Marshall defined economics as,
1. “A study of mankind in the ordinary business of life”.
2. An altered form of this definition is : “Economics is a study of man’s actions in the
ordinary business of life”
2. What are the main divisions of economics ?
1.Consumption, 2. Production, 3. Exchange and 4. Distribution & 5. Public Finance
3. Describe the relationship between economics, mathematics and statistics.
1. Many tables and diagrams used in economics are based on statistical analysis.
2. Mathematical methods are largely used in modern economics.
3. Now we have a new science called econometrics.
Econometrics = Economics + Statistics + Mathematics
4. Distinguish between free goods and economic goods
Freed Goods Economics Goods
1 Gifts of nature Not a gift of Nature
2 They are not scarce They are Scarce
3 They do not command a price They command price
4 Eg : Air and sunlight Eg : Table and Chair
5. Explain the difference between value-in-use and value-in- exchange.
Value-in-Use Value-in-Exchange
1 Gifts of nature Not a gift of a Nature
2 They are not scarce They are Scarce
3 They do not command a price They command price
4 Eg : Air and sunlight Eg : Table and Chair
www.Padasalai.Net www.TrbTnpsc.com
http://www.trbtnpsc.com/2013/07/latest-12th-study-materials-2013.html
www.Padasalai.Net

* Revision Material * +2 ECONOMICS : Mohan R
2
6. What are the basic issues of any society ?
1. What to produce and in what quantities ? (Food or weapons)
2. How shall goods be produced? (thermal power or from hydro power)
3. For whom shall the goods be produced ? (for a few rich or for many poor)
7. Name the important general economic systems ? TCS-M
1. Traditional Economy
2. Capitalist Economy
3. Socialist Economy
4. Mixed Economy
8. List the basic features of socialism. SL-CN
1. Social Welfare Motive
2. Limited Right to Private Property
3. Central Planning
4. No Market Forces
9. Is India a mixed economy ?
Yes, India is a mixed economy. Because, in a mixed economy, both public and
private institutions exercise economic control.
10. What is opportunity cost ?
1. The opportunity cost of an action is the value of next best alternative forgone.
2. The consideration of opportunity costs is one of the key differences between the
concepts of ‘economic cost’ and ‘accounting cost’.
3. For example, if you choose to watch cricket highlights in T.V., you must give up an
extra hour study.
11. What are the causes for wants ? (ESCAP)
1. Elementary causes
2. Social causes
www.Padasalai.Net www.TrbTnpsc.com
http://www.trbtnpsc.com/2013/07/latest-12th-study-materials-2013.html
www.Padasalai.Net

* Revision Material * +2 ECONOMICS : Mohan R
3
3. Customs and habits
4. Advertisements.
5. Psychological Causes.
12. What are the classifications of goods ? (NCL)
1. Necessaries Goods - food, clothing and shelter
2. Comforts Goods - TV, a sofa-cum- bed
3. Luxuries Goods - diamond studded jewels
13. Define the Law of Diminishing Marginal Utility.
According to Marshall, “The additional benefit which a person derives from a
given increase of his stock of a thing diminishes with every increase in the stock that he
already has”.
When person X
Continuously
eats apples
Circumstances Apples Marginal Utility
While Hungry 1st Apple High Marginal Utility
(Great Pleasure)
While not in Hungry
(after hungry) 2nd Apple Low Marginal Utility
14. What are the properties of Indifference curve ?
1. Indifference curves slope downwards to the right
2. Indifference curves are convex to the origin
3. No two indifference curves can ever cut each other.
15. Define “consumer’s surplus” in the words of Marshall.
“The excess of price which a person would be willing to pay rather than go without
the thing, over that which he actually does pay, is the economic measure of this surplus of
satisfaction. It may be called consumer’s surplus.”
Consumer’s surplus = Potential price – Actual price
www.Padasalai.Net www.TrbTnpsc.com
http://www.trbtnpsc.com/2013/07/latest-12th-study-materials-2013.html
www.Padasalai.Net

* Revision Material * +2 ECONOMICS : Mohan R
4
16. What is demand ?
Meaning:
“Demand for a commodity refers to the desire backed by ability to pay and
willingness to buy it.”
For Example:
1. If a person below poverty line wants to buy a car, it is only a desire but not a demand
as he cannot pay for the car.
2. If a rich man wants to buy a car, it is demand as he will be able to pay for the car.
Demand = Desire + Ability to Pay + Willingness
17. Enumerate the determinants of demand
1. Price
2. Tastes and preferences of the consumer
3. Income of the consumer
4. Price of substitutes
Dx = f (Px, Ps, Y, T, W)
18. Why does the demand curve slope downwards ?
1. Mainly due to the law of diminishing marginal utility.
2. The law of diminishing marginal utility states that an additional unit of a commodity
gives a lesser satisfaction.
3. Therefore, the consumer will buy more only at a lower price.
www.Padasalai.Net www.TrbTnpsc.com
http://www.trbtnpsc.com/2013/07/latest-12th-study-materials-2013.html
www.Padasalai.Net

* Revision Material * +2 ECONOMICS : Mohan R
5
19. Write a note on Giffen Paradox
Sir Robert Giffen discovered that the poor people will demand more of inferior
goods if their prices rise and demand less if their prices fall.
For example, poor people spend the major part of their income on coarse grains
(e.g. ragi, cholam ) and only a small part on rice. When the price of coarse grains rises,
they will buy less rice.
Poor
People
Price of Inferior Goods
(eg: Ragi & Coloam) Status
Demand of
Inferior Goods
Increases Real Income Decreases Demand is more
Falls Real Income Increases Demand is less
20. What are the types of elasticity of demand ?
1. Price elasticity of demand; 2. Income elasticity of demand;
and 3. Cross-elasticity of demand
21. What is equilibrium price ? (PEI Equilibrium)
1. There is only one price at which the preferences of sellers and buyers meet together.
2. At one point of price, the quantity demanded of a commodity by the buyer is
equivalent to the quantity the seller is willing to sell. This price is called as the
equilibrium price.
3. It occurs at the point of intersection of the supply curve and the demand curve.
Equilibrium Price = E = P = D = S
www.Padasalai.Net www.TrbTnpsc.com
http://www.trbtnpsc.com/2013/07/latest-12th-study-materials-2013.html
www.Padasalai.Net

* Revision Material * +2 ECONOMICS : Mohan R
6
22. Distinguish between change in demand and shift in demand.
Change in Demand Shift in Demand
1 Due to Change in Prices Only Due to Changes in Other than Prices
2 Demand Curves Remains same Demand Curve Shifts
3 Dx = f ( Px) D = f ( Ps, T, Y, W & etc.)
23. What are the determinants of shift in supply ?
1. Changes in Substitute Prices 2. Number of sellers in the market
3. Factor prices & 4. State of Technology
Sx = f ( Ps, N, Fp, Tech & etc.,)
24. Differentiate the short period from the long period.
Short Period Long Period
1 One factors will be a fixed input,
other inputs can be changed
Both Fixed & Variable inputs can be
changed
2 Supply Curve elastic,
but not flatter Supply Curve is more elastic, and flatter
3 P = Equilibrium Price P = Lower Equilibrium Price
25. Write a short note on market period.
1. Market period is the period during which the ability of the firms to affect any changes
in supply in response to any change in demand is extremely limited or almost nil.
2. Thus supply is more or less fixed in the market period without any change.
3. During Market Period : Supply curve is a Vertical Line.
26. Name the types of utility.
Form Utility, Time Utility, Place Utility & Possession Utility
www.Padasalai.Net www.TrbTnpsc.com
http://www.trbtnpsc.com/2013/07/latest-12th-study-materials-2013.html
www.Padasalai.Net

* Revision Material * +2 ECONOMICS : Mohan R
7
27. Define labour.
Alferd Marshall defines labour as
‘‘the use or exertion of body or mind, partly or wholly, with a view to
secure an income apart from the pleasure derived from the work’’.
28. What is meant by division of labour?
Dividing the process of production into distinct and several component processes
and assigning each component in the hands of a labour or a set of labourers, who are
specialists in that particular process.
For example, In the case of garment exporters, cutting of cloth, stitching of hands,
body, collars, holes for buttons, stitching of buttons, etc., are done independently by
different workers
29. What are the forms of capital ?
1. Physical Capital 2. Money Capital and 3. Human Capital
30. What is production function ? and what are its classification ?
The functional relationship between inputs and outputs is known as production
function. The production function is given as
Q = f (x1, x2, x 3….xn ) in which,
Q - Quantity produced, x1, x2, x3 ….xn - -q-Quantities of different factors
Classifications are,
1. Short-run production function (Law of Variable Proportions)
2. Long-run production function (Returns to Scale)
www.Padasalai.Net www.TrbTnpsc.com
http://www.trbtnpsc.com/2013/07/latest-12th-study-materials-2013.html
www.Padasalai.Net
* Revision Material * +2 ECONOMICS : Mohan R
8
31. Bring out the distinction between short run and long run.
Short Run
Short run is a period of time over which certain factors of production cannot be changed
Long-RunIn the long-run all factors are variable. Therefore the firm can change the size
of the plant (capital equipment, machinery etc) to meet the changes in demand.
32. Define opportunity cost.
The opportunity cost of any good is the next best alternative good that is
sacrificed. For example a farmer who is producing wheat can produce potatoes with the
same factors. Therefore the opportunity cost of a quintal of wheat is the amount of output
of potatoes given up.
33. What are economic costs ?
The economic cost includes not only the explicit cost but also the implicit cost. The
money rewards for the own services of the entrepreneur and the factors owned by himself
and employed in production are known as implicit costs or imputed costs.
34. Define marginal cost ?
Marginal cost is defined as the addition made to the total cost by the production of
one additional unit of output.
Symbolically, MCn = TCn – TCn-1 where
MCn = Marginal cost, TC n = Total cost of producing n units, TC n-1 =
Total cost of producing n-1 units
www.Padasalai.Net www.TrbTnpsc.com
http://www.trbtnpsc.com/2013/07/latest-12th-study-materials-2013.html
www.Padasalai.Net

* Revision Material * +2 ECONOMICS : Mohan R
9
35. Mention the relationship between MC and AC
1) When marginal cost is less than average cost, average cost is falling
2) When marginal cost is greater than the average cost, average cost is rising
3) The marginal cost curve must cut the average cost curve at AC’s minimum
point from below. (AC = MC)
36. What are the characteristics of a market? (EC DP)
1. Existence of buyers and sellers of the commodity.
2. The establishment of contact between the buyers and sellers.
3. Buyers and sellers deal with the same commodity or variety.
4. There should be a price for the commodity bought and sold in the market.
37. Classify the market based on competition.
38. Mention any three benefits of perfect competition.
1. There is consumer sovereignty.
2. The price is equal to the minimum average cost. It is beneficial to the consumer.
3. The products are homogeneous. This reduces the wastage of resources.
4. In the long run, the perfectly competitive firm is functioning at the optimum level. This
means that maximum economic efficiency in production is achieved.
www.Padasalai.Net www.TrbTnpsc.com
http://www.trbtnpsc.com/2013/07/latest-12th-study-materials-2013.html
www.Padasalai.Net

* Revision Material * +2 ECONOMICS : Mohan R
10
39. What are the conditions of price discrimination?
1. The demand must not be transferable from the high priced market to the low
priced market. If rich people do not buy the high-priced deluxe edition of the book, but
wait for the low-priced popular edition to come out, then personal discrimination will fail.
2. The monopolist should keep the two markets or different markets separate
so that the commodity will not be moving from one market to the other market.
40. Define price discrimination with an example.
Price discrimination may be defined as “the sale of technically similar products at
prices which are not proportional to marginal cost”. For example, all cinema theatres
charge different prices for different classes of people for the same screening of movies.
41. What are the assumptions of marginal productivity theory of distribution ?
1. There is perfect competition.
2. All units of a factor are homogeneous. It means that one unit of a factor is the same as
the other.
3. Factors can be substituted for each other. That is, all factors are interchangeable.
4. The theory is based on the law of diminishing returns as applied to business.
42. What is “Transfer earnings”?
Transfer earnings refer to the amount that a factor could earn in its best paid
alternative employment. It represents the opportunity cost of its present employment.
www.Padasalai.Net www.TrbTnpsc.com
http://www.trbtnpsc.com/2013/07/latest-12th-study-materials-2013.html
www.Padasalai.Net

* Revision Material * +2 ECONOMICS : Mohan R
11
43. Distinguish between real wages and money wages.
Real wages:
1. Refer to the commodities and services which the money wages command.
2. They depend mainly on the purchasing power of money, which in turn depends upon
the price level.
3. The standard of living of workers in a country depends upon the real wages.
Money Wages:
1. Money wages are also known as nominal
2. Further, a farm worker may get low money wages. But if he gets free board and
lodging, we must take that also into account while considering real wages.
44. What is standard of living theory of wages?
According to this theory, wages depend upon the standard of living of workers.
Standard of living refers to the bare necessaries of life and also education, and recreation
to which the worker is habituated.
45. What are the three motives of liquidity preference?
1. Transaction motive; 2. Precautionary motive; and 3. Speculative motive.
46. What are the assumptions of Say’s law of markets? (consumption, govt., closed)
1. All incomes of the households are spent on consumption of goods and services.
2. There is no government activity (no taxation, public spending, price control etc.).
3. It is a closed economy i.e. no relationship with other economies.
www.Padasalai.Net www.TrbTnpsc.com
http://www.trbtnpsc.com/2013/07/latest-12th-study-materials-2013.html
www.Padasalai.Net

* Revision Material * +2 ECONOMICS : Mohan R
12
47. What is effective demand?
Effective demand is the ability and willingness to spend by individuals, firms and
government. The level of output produced and hence the level of employment depends on
the level of total spending in the economy.
ED = ASF = ADF = Output = Income = Employment
48. Give the factors on which the aggregate demand depends.
1. Propensity to consume (Consumption function)
2. Inducement to invest (Investment function)
49. What are the three motives of liquidity preference theory?
1. Transaction motive; 2. Precautionary motive; and 3. Speculative motive.
50. Write a note on multiplier.
the magnified or amplified effect of initial investment on income is called as the
multiplier effect. It is measured by the ratio of change in equilibrium income to change in
expenditure.
change in equilibrium income
Or
51. Define Money.
Crowther, has defined money as, “anything that is generally acceptable as a means of
exchange (i.e, as a means of settling debts) and that at the same time acts as a measure
and as a store of value”.
www.Padasalai.Net www.TrbTnpsc.com
http://www.trbtnpsc.com/2013/07/latest-12th-study-materials-2013.html
www.Padasalai.Net

* Revision Material * +2 ECONOMICS : Mohan R
13
52. What are the four components of money supply in India ?
M1 = Currency with the public. (also known as narrow money)
M2 = M1 + Post Office savings deposits.
M3 = M1 + Time deposits of the public with the banks. ( also known as broad money)
M4 = M3 + Total Post Office deposits.
53. Define monetary policy.
Edward Shapiro – Definition of Monetary Policy
“Monetary policy is policy that employs the central bank’s control over the
supply and cost of money as an instrument for achieving the objectives of economic
policy”
54. What are the instruments of quantitative credit control? (BR’O Va-CaR)
1. Bank Rate policy
2. open Market operations
3. Variation of Cash Reserve ratios
55. What is Stagflation ?
Meaning of Stagflation:
“A situation marked by rising prices (inflation) and stagnation (over-production)
in demand is known as Stagflation”
Stagflation = Stagnation + Inflation
56. Define Public Finance.
According to Dalton, “Public finance is concerned with the income and
expenditure of public authorities and with the adjustment of the one with the other”.
www.Padasalai.Net www.TrbTnpsc.com
http://www.trbtnpsc.com/2013/07/latest-12th-study-materials-2013.html
www.Padasalai.Net
* Revision Material * +2 ECONOMICS : Mohan R
14
57. What is the subject matter of Public Finance ? (READ-F)
1. Public Expenditure 2. Public Revenue 3. Public Debt 4. Financial Administration
and 5. Federal finance
58. What are the canons of taxation ? (Canon = Rule) (EC EC)
1. Canon of Equity
2. Canon of Certainty
3. Canon of Economy
4. Canon of Convenience
59. What are the kinds of tax ?
1. Direct and Indirect taxes.
2. Proportional, progressive, Regressive and digressive taxes.
3. Specific and advalorem taxes.
4. Value-added tax (VAT)
5. Single and multiple taxes.
60. What is zero based budget?
1. In zero based budgeting, every year is considered as a new year thus providing a
connecting link between the previous year and the current year.
2. The past performance and programmes are not taken into account.
3. The budget is viewed as entirely a fresh and whole fiscal initiative i.e. from zero
bases.
www.Padasalai.Net www.TrbTnpsc.com
http://www.trbtnpsc.com/2013/07/latest-12th-study-materials-2013.html
www.Padasalai.Net

* Revision Material * +2 ECONOMICS : Mohan R
15
+2 ECONOMICS QUESTION
(3 MARKS & 5 MARKS) (Wightage Based)
1.Write a note on traditional economy. (PPP STR)
1. The basic problems are solved by traditions and custom rules every aspect of
behaviour.
2. It produces exactly to its consumption requirements.
3. It is a subsistence economy.
4. There is not much of sales as there is only small scale production.
5. The same product will be produced by every generation.
6. The production techniques are traditional.
2.Explain the salient features of capitalism. RPF-MM
1. Right to Private Property: Individuals have the right to buy and own property. There
is no limit and they can own any amount of property. They also have legal rights to use
their property in any way they like.
2. Profit-Motive: Profit is the only motive for the functioning of capitalism. Production
decisions involving high risks are taken by individual only to earn large profits. Hence,
profit-motive is the basic force that drives the capitalist economy.
3. Freedom of Choice: The question ‘what to produce?’ will be determined by the
producers. They have the freedom to decide. The factors of production can also be
employed anywhere freely to get due prices for their services. Similarly consumers have
the freedom to buy anything they want.
4. Market Forces: Market forces like demand, supply and price are the signals to direct
the system. Most of the economic activities are centered on price mechanism. Production,
consumption and distribution questions are expected to be solved by market forces.
www.Padasalai.Net www.TrbTnpsc.com
http://www.trbtnpsc.com/2013/07/latest-12th-study-materials-2013.html
www.Padasalai.Net

* Revision Material * +2 ECONOMICS : Mohan R
16
5. Minimal role of Government: As most of the basic economic problems are expected
to be solved by market forces, the government has minimal role in the economy. Their
role will be limited to some important functions. They include regulation of market,
defence, foreign policy, currency, etc.
3. What are the merits of socialist economy. (MI NEWS)
Merits of Socialist Economy
1. Efficient use of resources: The resources are utilized efficiently to produce
socially useful goods without taking the profit margin into account. Production is
increased by avoiding wastes of competition.
2. Economic Stability: Economy is free from business fluctuations. Government plans
well and everything is well coordinated to avoid over-production or unemployment.
There is stability because the production and consumption of goods and services are well
regulated.
3. Maximisation of Social Welfare: All citizens work for the welfare of the State.
Everybody receives his or her remuneration. The State concentrates on the production of
basic necessaries instead of luxury goods. The State provides free education, cheap and
congenial housing, public health amenities and social security for the people.
4. Absence of Monopoly: The elements of corporation and monopoly are eliminated
since there is absence of private ownership. The state is a monopoly but produces quality
goods at reasonable price.
5. Basic Needs are met: In socialist economies, basic human needs like water, education,
health, social security, etc, are provided. Human development is more in socialist
countries.
6. No extreme Inequality: As social welfare is the ultimate goal, there is no
concentration of wealth. Extreme inequality is prevented in socialist system.
www.Padasalai.Net www.TrbTnpsc.com
http://www.trbtnpsc.com/2013/07/latest-12th-study-materials-2013.html
www.Padasalai.Net

* Revision Material * +2 ECONOMICS : Mohan R
17
4. What are the merits and demerits of a mixed economy?
Merits of Mixed Economy
1. Efficient resource utilisation: The resources are utilized efficiently as good features
of both capitalism and socialism coexist. If there is misallocation of resources, the State
controls and regulates it. This ensures the efficient utilization of resources.
2. Prices are administered: The prices are not fixed always by forces of demand and
supply. In the case of goods which are scarce, the prices are administered by the
government and such goods are also rationed.
3. Social Welfare: In a mixed economy, planning is centralized and there is overall
welfare. Workers are given incentives and reward for any innovations. There is social
security provided to the workers. Inequalities of income and wealth are reduced.
Demerits of Mixed Economy
1. Lack of Co-ordination: The coordination between the public and private sectors is
poor in a mixed economy. Public sector spends huge public resources for infrastructure.
The private sector aims at profit maximization by using the infrastructure created by the
public sector.
2. Red –tapism and delay by Public Sector: There is every chance that the public sector
works inefficiently. There is too much of red-tapism and corruption leading to delays in
decision-making and project implementation. They result in inefficiency and also affect
production.
3. Economic FluctuationS (No Stability): The mixed economies experience economic
fluctuations. The lack of policy coordination between private and public sector results in
economic fluctuations.
www.Padasalai.Net www.TrbTnpsc.com
http://www.trbtnpsc.com/2013/07/latest-12th-study-materials-2013.html
www.Padasalai.Net

* Revision Material * +2 ECONOMICS : Mohan R
18
5. Explain ‘opportunity cost’ with an example.
Opportunity Cost – Meaning:
When you choose a particular alternative, the next best alternative must be given
up.
Explanation:
In other words, the opportunity cost of an action is the value of next best alternative
forgone. The consideration of opportunity costs is one of the key differences between the
concepts of ‘economic cost’ and ‘accounting cost’. Choices are mostly made on the basis
of opportunity cost.
Example:
For example, if you choose to watch cricket highlights in T.V., you must give up an
extra hour study. The choice of watching cricket in T.V. results in the loss of the next best
alternative- an extra hour study instead. Thus by watching T.V., you have forgone the
opportunity of scoring an extra five or ten marks in examination. Thus the “opportunity
cost” is the cost of something in terms of an opportunity forgone (and the benefits that
could be received from that opportunity).
www.Padasalai.Net www.TrbTnpsc.com
http://www.trbtnpsc.com/2013/07/latest-12th-study-materials-2013.html
www.Padasalai.Net

* Revision Material * +2 ECONOMICS : Mohan R
19
6. Give a note on long run average cost curve.
Long run Average Cost Curve (LAC)
The LAC Curve:
In the long-run all factors are variable. Therefore the firm can change the size of
the plant (capital equipment, machinery etc) to meet the changes in demand. A long-run
average cost curve depicts the functional relationship between output and the long-run
cost of production.
The Long run Average Cost (LAC) Curve is based on the assumption that in the
long run a firm has a number of alternatives with regard to the scale of operations.
Diagram 1
Diagram 2
www.Padasalai.Net www.TrbTnpsc.com
http://www.trbtnpsc.com/2013/07/latest-12th-study-materials-2013.html
www.Padasalai.Net

* Revision Material * +2 ECONOMICS : Mohan R
20
Explanation of SACs & LAC Curves:
We have assumed that technologically there are only three sizes of plants – small,
medium and large.
1. SAC1 is relevant for a small size plant,
2. SAC2 for a medium size plant and
3. SAC3 for a large size plant.
In the short period, when the output demanded is A, the firm will choose the
smallest size plant.
But for an output beyond OB, the firm will choose medium size plant as the
average cost of small size plant is higher for the same output (JC>KC). For output beyond
OD, the firm will choose large size plant (SAC3). In the short-run, the firm is tied with a
given plant but in the long-run, the firm moves from one plant to another. As the scale of
production is changed, a new plant is added. The long-run cost of production is the least
possible cost of production of any given level of output, when all inputs become variable,
including the size of the plant.
Other Names of LAC Curves:
1. The long run average cost curve is called ‘planning curve’ of a firm as it helps in
choosing a plant on the decided level of output.
2. The long- run average cost curve is also called envelope curve as it supports or
envelops a group of short-run cost curves.
3. From the figure we can understand that the long run average cost curve initially falls
with increase in output and after a certain point it rises making a boat shape.
www.Padasalai.Net www.TrbTnpsc.com
http://www.trbtnpsc.com/2013/07/latest-12th-study-materials-2013.html
www.Padasalai.Net

* Revision Material * +2 ECONOMICS : Mohan R
21
7. Explain the relationship between AR and MR curve
Average Revenue
Average revenue is the revenue per unit of the commodity sold. It is calculated by
dividing the total revenue by the number of units sold.
AR = TR / Q
Marginal Revenue
Marginal Revenue is the addition made to the total revenue by selling one more
unit of a commodity. MRn = TRn – TRn-1
www.Padasalai.Net www.TrbTnpsc.com
http://www.trbtnpsc.com/2013/07/latest-12th-study-materials-2013.html
www.Padasalai.Net

* Revision Material * +2 ECONOMICS : Mohan R
22
Relationship between AR and MR curves
1. When the average revenue (price) remains constant, the marginal revenue will
also sremain constant and will coincide with the average revenue.
2. A firm can sell large quantities only at lower prices.
3. In that case, the average revenue (price) of the product falls.
4. When AR falls MR will also fall. But fall in MR will be more than the fall in the AR.
Hence the marginal revenue curve will lie below the average revenue curve
8. Explain the short run average cost curves
Short run average cost curves
Average Fixed Cost (AFC)
The average fixed cost is the fixed cost per unit of output. It is obtained by dividing
the total fixed cost by the number of units of the commodity produced.
AFC = TFC / Q
Average Variable cost (AVC)
Average variable cost is the variable cost per unit of output. It is the total variable
cost divided by the number of units of output produced.
AVC = TVC / Q
Average Total Cost or Average Cost
Average total cost is simply called average cost which is the total cost divided by the
number of units of output produced.
AC = TC / Q (or)
AC = AFC+AVC
www.Padasalai.Net www.TrbTnpsc.com
http://www.trbtnpsc.com/2013/07/latest-12th-study-materials-2013.html
www.Padasalai.Net

* Revision Material * +2 ECONOMICS : Mohan R
23
Diagram Explanation:
From the figure,it can be understood that the behaviour of the average total cost
curve depends on the behaviour of AFC and AVC curves. In the beginning, both AFC
and AVC fall. So ATC curve falls. When AVC curve begins rising, AFC curve falls
steeply ie fall in AFC is more than the rise in AVC. So ATC curve continues to fall. But
as output increases further, there is a sharp increase in AVC, which is more than the fall
in AFC. Hence ATC curve rises after a point. The ATC curve like AVC curve falls first,
reaches the minimum value and then rises. Hence it has taken a U shape.
www.Padasalai.Net www.TrbTnpsc.com
http://www.trbtnpsc.com/2013/07/latest-12th-study-materials-2013.html
www.Padasalai.Net

* Revision Material * +2 ECONOMICS : Mohan R
24
9. Explain the marginal cost with suitable illustration.
Marginal Cost
Marginal cost is defined as the addition made to the total cost by the production of
one additional unit of output.
MCn = TCn – TCn-1
MC Curve Diagram:
www.Padasalai.Net www.TrbTnpsc.com
http://www.trbtnpsc.com/2013/07/latest-12th-study-materials-2013.html
www.Padasalai.Net

* Revision Material * +2 ECONOMICS : Mohan R
25
Explanation:
The marginal cost curve is ‘U’ shaped. The shape of the cost curve is determined
by the law of variable proportions. If increasing returns (economies of scale)is in
operation, the marginal cost curve will be declining, as the cost will be decreasing with
the increase in output. When the diminishing returns (diseconomies of scale) are in
operation, the MC curve will be increasing as it is the situation of increasing cost.
10. Explain the relationship between SAC and SMC.
Average Cost
Average total cost is simply called average cost which is the total cost divided by
the number of units of output produced.
AC = TC / Q (or)
AC = AFC+AVC
Marginal Cost
Marginal cost is defined as the addition made to the total cost by the production of
one additional unit of output.
MCn = TCn – TCn-1
The relationship can be given as follows:
1) When marginal cost is less than average cost, average cost is falling
2) When marginal cost is greater than the average cost, average cost is rising
3) The marginal cost curve must cut the average cost curve at AC’s minimum
point from below. (AC = MC)
www.Padasalai.Net www.TrbTnpsc.com
http://www.trbtnpsc.com/2013/07/latest-12th-study-materials-2013.html
www.Padasalai.Net

* Revision Material * +2 ECONOMICS : Mohan R
26
11. What are the criticisms of Say’s Law? (US-IRAN PMC LBW-12 Points)
1. Great Depression made Say’s law unpopular
2. All incomes earned are not always spent on consumption
3. Similarly whatever is saved is not automatically invested
4. The Law was based on wrong analysis of market
5. It suffers from the fallacy of aggregation
6. Aggregate supply and aggregate demand are not always equal
7. Rate of interest is not the equilibrating factor
8. Capitalist system is not self-adjusting always
9. Perfect competition is an unrealistic assumption
10. Money is a dominant force in the economy
11. The law is applicable only for Long period
12. Say’s law holds goods only in a Barter economy
www.Padasalai.Net www.TrbTnpsc.com
http://www.trbtnpsc.com/2013/07/latest-12th-study-materials-2013.html
www.Padasalai.Net

* Revision Material * +2 ECONOMICS : Mohan R
27
12. Draw the flow chart to depict the essence of Keynes theory.
www.Padasalai.Net www.TrbTnpsc.com
http://www.trbtnpsc.com/2013/07/latest-12th-study-materials-2013.html
www.Padasalai.Net

* Revision Material * +2 ECONOMICS : Mohan R
28
13. Describe the consumption function with a diagram
Consumption Function – Meaning:
The term ‘consumption function’ explains the relationship between income and
consumption. The proportion of income spent on actual consumption at different levels
of income is called propensity to consume.
Formula:
Diagram:
Equations and Explanations:
C = a + by …. ( 1 )
C = 4 + 0.8y …. ( 2 )
www.Padasalai.Net www.TrbTnpsc.com
http://www.trbtnpsc.com/2013/07/latest-12th-study-materials-2013.html
www.Padasalai.Net

* Revision Material * +2 ECONOMICS : Mohan R
29
Equation (1) : Y = a + bY where the constant ‘a’ is the amount of autonomous
consumption and slope (b) is MPC. The rate of change in consumption due to change in
income depends on the MPC.
Equation (2) : simply says that consumption (C) depends on income (Y). The +
sign indicates that as income increases, obviously consumption will also increase. But the
rate of increase in consumption will be little less than that of the rate of increase in
income. It is because some unspent portion of the income will be saved.
In Diagram : The vertical axis shows the spending on consumption indicated by C
and the horizontal axis shows income or output indicated by Y. The straight line
consumption function CC is defined in terms of equation C = 4 + .8Y.
The consumption curve CC is a short run curve. In this case consumption takes
place even when income is zero.
In equation (2) 4 is the level of initial consumption,
when income is zero and it is not affected by income. Even when income is zero,
people spend some minimum level either by gift or borrowing. This consumption which
is not related to income is called as autonomous consumption. That is the reason why
curve C starts from 4 on the vertical axis.
In equation (2) 0.8 indicates,
that 80 per cent of additional income is spent on consumption and it is called as
marginal propensity to consume (MPC). Thus MPC is the ratio of change in consumption
to change in income. In other words, MPC is the rate of change in propensity to consume.
www.Padasalai.Net www.TrbTnpsc.com
http://www.trbtnpsc.com/2013/07/latest-12th-study-materials-2013.html
www.Padasalai.Net

* Revision Material * +2 ECONOMICS : Mohan R
30
14. What are the determinants of consumption other than income?
(an Aged Lady on Govt. Quarters Living with Cultural Values, when watching
TV Advertisement, it is an ID Card Ad in which “Expectations about Price Rice and
Rate of Interest going on)
1. Income distribution
2. Size and nature of wealth distribution
3. Age distribution of population
4. Inflation or price level
5. Government policies
6. Rate of interest
7. Expectations about price, income, etc.
8. Advertisements
9. Improvement in the living standard
10. Changes in cultural values
15. What are the assumptions of Keynes’ Simple Income Determination?
(during 2G XM Wag Pri RI.CE – Less Full Emp. Stomach)
1. There are only Two sectors viz. consumers ( C ) and firms ( I ).
2. Government influence on the economy is nil. In other words government
expenditure ( G ) is zero. As there is no taxation, all personal income will
become disposable income.
3. The economy is a closed one without any influence of foreign trade (X-M) that is, X-M
is zero.
4. Wages and prices remain constant.
5. There are unemployed resources and hence less than full employment equilibrium
prevails.
6. There is no variation in the rate of interest.
7. Investment is autonomous and it has no effect on price level or rate of interest.
8. The consumption expenditure is stable.
www.Padasalai.Net www.TrbTnpsc.com
http://www.trbtnpsc.com/2013/07/latest-12th-study-materials-2013.html
www.Padasalai.Net

* Revision Material * +2 ECONOMICS : Mohan R
31
16. Explain the canons of taxation. (Canon = Rule) (EC EC)
1. Canon of Equity
2. Canon of Certainty
3. Canon of Economy
4. Canon of Convenience
1. Canon of Equity
This canon is also called the ‘ability to pay’ principle of taxation. It means that
taxes should be imposed according to the capacity of the tax payer. Poor should be taxed
less and rich should be taxed more. This canon involves the principle of justice.
2. Canon of Certainty
Every tax payer should know the amount of tax to be paid, when to be paid, and
where to be paid and also should be certain about the rate of tax to make investment
decisions.
3. Canon of Economy
This canon signifies that the cost of collecting the revenue should be kept at the
minimum possible level. The tax laws and procedures should be made simple, so as to
reduce the expenses in maintaining people’s income tax accounts. ie. administrative
expenditure to be kept at a minimum.
4. Canon of Convenience
Tax payment should be convenient and less burdensome to the tax payer. e.g.
income tax collected at source, sales tax collected at the time of sales and land tax
collected after harvest.
www.Padasalai.Net www.TrbTnpsc.com
http://www.trbtnpsc.com/2013/07/latest-12th-study-materials-2013.html
www.Padasalai.Net

* Revision Material * +2 ECONOMICS : Mohan R
32
17. What are main sources of tax and non-tax revenue of the state government.
(EX MLA NVN – GST & G O I L)
Tax Revenue:
1. Taxes on trade, profession and employment,
2. Taxes on the sale and purchase of goods except newspaper,
3. Taxes on agricultural income
4. Taxes on land and building,
5. Succession and estate duties in respect of agricultural land,
6. Excise duty on alcoholic liquors and narcotics,
7. Taxes on the entry of goods into a local area,
8. Taxes on mineral rights,
9. Taxes on the consumption of electricity
10. Taxes on vehicles, animals and boats,
11. Taxes on goods and passengers carried by road and inland water ways,
12. Stamp duties, court fees and registration,
13. Entertainment tax,
14. Taxes on advertisements other than those in newspaper,
Non Tax Revenue:
1. Land Revenue
2. Income from irrigation and forests,
3. Grants from the central
4. Other incomes such as income from registration and share in the income-tax, excise
and estate duties and debt services, loans and overdrafts.
www.Padasalai.Net www.TrbTnpsc.com
http://www.trbtnpsc.com/2013/07/latest-12th-study-materials-2013.html
www.Padasalai.Net

* Revision Material * +2 ECONOMICS : Mohan R
33
18. Define Budget. Explain the balanced and unbalanced budget.
Budget Defition:
Prof. Dimock says, “A budget is a balanced estimate of expenditures and receipts
for a given period of time. In the hands of the administration, the budget is record of past
performance, a method of current control and a projection of future plans”.
Kinds of Budget
1. Balanced budget
2. unbalanced budget
1) Balanced Budget :
A balanced budget is that, over a period of time, revenue does not fall short of
expenditure. In other words government budget is said to be balanced when its tax
revenue and expenditure are equal.
2) Unbalanced Budget
An unbalanced budget is that, over a period of time, revenue exceeds expenditure
or expenditure exceeds revenue. In other words, the government’s income or tax revenue
and expenditure are not equal.
a. Surplus Budget : When there is an excess of income over expenditure,
it is called a surplus budget.
b. Deficit Budget : When there is an excess of expenditure over income,
it is a case of deficit budget.
www.Padasalai.Net www.TrbTnpsc.com
http://www.trbtnpsc.com/2013/07/latest-12th-study-materials-2013.html
www.Padasalai.Net

* Revision Material * +2 ECONOMICS : Mohan R
34
19. What are the limitations of fiscal policy ?
1) Size of fiscal measures
The budget is not a mere statement of receipts and revenues of the government. It
explains and shapes the economic structure of a country. When the budget forms a small
part of the national income in developing economies, fiscal policy cannot have the desired
impact on the economic development.
2. Fiscal policy as ineffective anti-cyclical measure
Fiscal measures- both loosening fiscal policy and tightening fiscal policy- will not
stimulate speedy economic growth of a country, when the different sectors of the
economy are not closely integrated with one another. Action taken by the government
may not always have the same effect on all the sectors.
3. Administrative delay
Fiscal measures may introduce delay, uncertainties and arbitrariness arising from
administrative bottlenecks. As a result, fiscal policy fails to be a powerful and therefore a
useful stabilization policy.
4. Other Limitations
Large scale underemployment, lack of coordination from the public, tax evasion,
low tax base are the other limitations of fiscal policy.
www.Padasalai.Net www.TrbTnpsc.com
http://www.trbtnpsc.com/2013/07/latest-12th-study-materials-2013.html
www.Padasalai.Net

* Revision Material * +2 ECONOMICS : Mohan R
35
20. Differentiate between the direct and indirect taxes?
Basis for
Difference Direct Tax Indirect Tax
1. Meaning
Direct tax is referred to as the
tax, levied on person's income
and wealth and is paid directly
to the government.
Indirect Tax is referred to as the tax, levied on
a person who consumes the goods and services
and is paid indirectly to the government.
2. Nature Progressive Regressive
3. Incidence
and Impact Falls on the same person. Falls on different person.
4. Types
Wealth Tax, Income Tax,
Property Tax, Corporate Tax,
Import and Export Duties.
Central Sales tax, VAT (Value Added Tax),
Service Tax, STT (Security Transaction Tax),
Excise Duty, Custom Duty.
5. Evasion Tax evasion is possible. Tax evasion is hardly possible because it is
included in the price of the goods and services.
6. Inflation Direct tax helps in reducing the
inflation. Indirect taxes promotes the inflation.
7. Imposition
and collection
Imposed on and collected from
assessees, i.e. Individual.
Imposed on and collected from consumers of
goods and services but paid and deposited by
the assessee.
8. Burden Cannot be shifted. Can be shifted
9. Event Taxable income or wealth of
the assessee
Purchase/sale/manufacture of goods and
provision of services
www.Padasalai.Net www.TrbTnpsc.com
http://www.trbtnpsc.com/2013/07/latest-12th-study-materials-2013.html
www.Padasalai.Net
* Revision Material * +2 ECONOMICS : Mohan R
36
5 MARKS QUESTIONS (Wightage Based)
1. Examine Marshall’s definition of economics.
Alfred Marshall’s - Definition (Welfare Definition)
Alfred Marshall (1842-1924) defined economics as “a
study of mankind in the ordinary business of life”. An altered
form of this definition is : “Economics is a study of man’s actions
in the ordinary business of life”
Explanation:
1. In the words of Marshall, “Economics is on the one side a study of wealth, and on the
other and more important side, a part of the study of man.
2. Man is the centre of his study. According to him, the study of man is more important
than the study of wealth.
3. Economics studies how people try “to increase the material means of wellbeing”.
4. According to this definition, we may say that economics is the study of the causes of
material welfare.
5. Marshall’s definition is known as material welfare definition of economics because
of its emphasis on welfare.
Criticism
1. Marshall that economics is a science that deals with material welfare has been
strongly criticized.
2. Lionel Robbins is a great critic of this definition. He says that Marshall’s definition
misrepresents the science of economics.
3. If we go by the definition of Marshall, in economics we should consider only those
activities which promote material welfare. But many activities do not promote welfare
www.Padasalai.Net www.TrbTnpsc.com
http://www.trbtnpsc.com/2013/07/latest-12th-study-materials-2013.html
www.Padasalai.Net
* Revision Material * +2 ECONOMICS : Mohan R
37
but are rightly considered as economic activity. For example, we know that alcoholic
drinks and cigarettes are bad for our health. But these commodities are produced and sold.
4. Some activities promote welfare but not material welfare. For example, the
activities of doctors, lawyers, actors, musicians promote our welfare.
5. In the words of Lionel Robbins, “whatever economics is concerned with, it is not
concerned with the causes of material welfare as such”.
6. Marshall’s definition is classificatory. It is not analytical.
7. By introducing ethical concepts like welfare, economics will become an inexact
science.
Conclusion:
In spite of the above criticism against Marshall’s definition, we should not forget
that Marshall has widened the scope of economics by establishing a link between wealth
and man and his welfare.
www.Padasalai.Net www.TrbTnpsc.com
http://www.trbtnpsc.com/2013/07/latest-12th-study-materials-2013.html
www.Padasalai.Net

* Revision Material * +2 ECONOMICS : Mohan R
38
2. Examine Lionel Robbins definition of economics.
Lionel Robbins’ Definition (Scarcity Definition):
Lionel Robbins has defined economics as follows :
“Economics is the science which studies human behaviour as a
relationship between ends and scarce means which have alternative
uses”.
Basic assumptions of the Definition:
1. Ends are various. The term “ends” mean wants. Human wants are unlimited.
2. Means are limited. Means like time, money and resources are limited.
3. We can put time and money to alternative uses.
4. All wants are not of equal importance.
Explanation:
1. Though means are limited, if they do not have alternative uses, you cannot
economize anything.
2. If all wants are of equal importance, you cannot economize anything.
3. Economics studies human behaviour as a relationship between unlimited
wants and scarce means. As means are limited, we have to pay a price for them.
4 . We study in economics how the prices of scarce goods are determined. We have
to choose among different wants.
5. That is why we say that scarcity and choice are central problems in economics.
Economics is the science of choice.
6. Choice between alternatives is the basic principle underlying all economic
activity. This is applicable to all economic systems – capitalism, socialism and mixed
economy.
7. Robbins puts it. “To plan is to act with a purpose, to choose, and choice is the
essence of economic activity”.
www.Padasalai.Net www.TrbTnpsc.com
http://www.trbtnpsc.com/2013/07/latest-12th-study-materials-2013.html
www.Padasalai.Net

* Revision Material * +2 ECONOMICS : Mohan R
39
Criticism
1. Ethical aspects of economic problems are not taken into account in discussions.
2. Some economists say Robbins’ definition has no human touch about it.
3. Scarcity may arise during times of abundance as well. For example, the great
depression of 1930s was caused not so much by scarcity but by plenty.
Conclusion: In spite of the above criticisms, we have to note that most of the
economists have accepted the definition of Robbins because it emphasizes scarcity and
choice which are two important facts of life under all economic, political and legal
systems.
3. Discuss the relationship between economics and other social sciences.
(SoPoH-JEY-X - 7 Points)
I. Economics and Sociology
1. Sociology deals with all aspects of society. But economics deals only with the
economic aspects of a society.
2. It studies human behaviour in relation to scarce means and unlimited
wants.
3. In economics, we are interested in them only to the extent that they affect the economic
life of a society.
II. Economics and Politics
1. Both economics and politics are social sciences and there is a close connection between
them. Politics is the science of the State or political society.
www.Padasalai.Net www.TrbTnpsc.com
http://www.trbtnpsc.com/2013/07/latest-12th-study-materials-2013.html
www.Padasalai.Net

* Revision Material * +2 ECONOMICS : Mohan R
40
2. It studies about man in his relation to the State. Sometimes, political ideas and
institutions are influenced by economic conditions. For example, socialism was born of
economic inequalities and exploitation in England during the industrial revolution.
3. Karl Marx is considered as the Father of (scientific) socialism.
III. Economics and History
1. Economics and history are closely related. History is a record of the past events. In
history, we survey economic, political and social conditions of the people in the past.
2. In economics, we make use of historical data to formulate economic laws. We make
use of history in economics to study the material conditions of people in the past.
3. There is a separate branch of economics known as “Economic History”.
IV. Economics and Ethics
1. Ethics is a social science. It deals with moral questions.
2. There is connection between economics and ethics.
3. While economics, according to Marshall, aims at promoting material welfare, ethics
aims at promoting moral welfare.
V. Economics and Jurisprudence
1. Jurisprudence is the science of law. The economic progress of a nation
depends to a great extent on its legal system.
2. Good laws promote economic progress and bad laws act as an impediment to growth.
3. For example, in the past when we welcomed foreigners to invest in our country, they
used to say our taxation was complex and not good.
VI. Economics and psychology
1. Psychology is the science of mind. It deals with all kinds of human behaviour. For
example, we have child psychology, mob psychology, industrial psychology and criminal
psychology.
2. Economics studies one aspect of human behaviour.
www.Padasalai.Net www.TrbTnpsc.com
http://www.trbtnpsc.com/2013/07/latest-12th-study-materials-2013.html
www.Padasalai.Net

* Revision Material * +2 ECONOMICS : Mohan R
41
3. It studies human behaviour with reference to unlimited wants and limited means.
VII. Economics, mathematics and statistics
1. Many tables and diagrams used in economics are based on statistical analysis.
2. Mathematical methods are largely used in modern economics.
3. Now we have a new science called econometrics. It makes use of statistics and
mathematics in economics.
Econometrics = Economics + Statistics + Mathematics
www.Padasalai.Net www.TrbTnpsc.com
http://www.trbtnpsc.com/2013/07/latest-12th-study-materials-2013.html
www.Padasalai.Net

* Revision Material * +2 ECONOMICS : Mohan R
42
(Answer of Question 4 & 5 of Chapter 1 = two 5 Marks (total 10 marks) are
covered) Nature of Economics Laws, Importance of Laws & Scope of Economics
4. NATURE OF ECONOMICS LAWS:
1. Economics has its Own Laws:
Like other social sciences, economics has its own laws. A law is a statement of
what must happen given certain conditions. Every cause has a tendency to produce some
result.
2. Statements of Tendencies
The laws of economics are statements of tendencies. For example, according to the
law of demand, when there is fall in the price of a good, the demand for it will expand.
3. Economics – a Social Science:
Economics, politics are examples of social sciences. The laws of physical sciences
are exact. But the laws of economics are not as exact as the laws of physical sciences.
4. Cannot Conduct Experiments
We cannot conduct experiments with human beings either within the laboratory or
outside it. That is why economic laws cannot be as exact as the laws of physical sciences.
5. Laws are Complex and Inexact
As economics deals with man and his behaviour, its laws are complex and inexact.
That is why Marshall has said that “the laws of economics are to be compared with the
laws of tides rather than with the simple and exact law of gravitation”.
6. Indicate Probable Trends
Economic laws also indicate probable trends. For example, when there is increase
in the quantity of money, there may be increase in the price level. But we cannot say
exactly by how much prices will rise.
www.Padasalai.Net www.TrbTnpsc.com
http://www.trbtnpsc.com/2013/07/latest-12th-study-materials-2013.html
www.Padasalai.Net

* Revision Material * +2 ECONOMICS : Mohan R
43
7. Assumptions:
All economic laws are based on certain assumptions. As the following for example,
assumptions of law of demand, (TIPS)
(1) that the income
of the people remains the same,
(2) that their tastes remain the same
(3) that the prices of other goods remain the same, and
(4) that no new substitute for the good is
discovered. The law will hold good only when the above assumptions are fulfilled.
8. Hypothetical
Sometimes, it is said that the laws of economics are hypothetical. That is, we make
an hypothesis. Only after it is verified by facts and experiments and found true, it
becomes a law.
www.Padasalai.Net www.TrbTnpsc.com
http://www.trbtnpsc.com/2013/07/latest-12th-study-materials-2013.html
www.Padasalai.Net

* Revision Material * +2 ECONOMICS : Mohan R
44
IMPORTANCE OF ECONOMIC LAWS
1.Some economic laws - are applicable to all types of economic systems. They
have universal application.
2.Quantity theory of money - is valid under all economic systems – capitalism
or socialism or mixed economy.
3.The law of diminishing utility - is based on actual experience. It tells that
the more and more of a thing you have, the less and
less you want it.
4.The law of demand - is based on actual experience. In practice we find
that when price falls, demand increases. Price falls
when supply is more.
5.The law of diminishing marginal returns - has universal application. In
agriculture, it means that we cannot double the
output by doubling labour and capital. The law applies to
manufacturing industry also.
6.The Malthusian theory of population - tells that population increases at a
faster rate than food supply.
www.Padasalai.Net www.TrbTnpsc.com
http://www.trbtnpsc.com/2013/07/latest-12th-study-materials-2013.html
www.Padasalai.Net

* Revision Material * +2 ECONOMICS : Mohan R
45
5. SCOPE OF ECONOMICS:
Importance of Economics
1. Economics has become one of the important branches of social sciences.
2. It is of great practical value in our daily life. In pure sciences, we study the subject to
arrive at the truth. But an economist is a social scientist.
3. Economics must be fruit-bearing. Of course, an economist has no readymade answer
for immediate problems.
4. Economist can help the Government in making broad economic policies.
5. According to Keynes, “the theory of economics does not furnish a body of settled
conclusions immediately applicable to policy. It is a method, rather than a doctrine, an
apparatus of the mind, a technique of thinking,
which helps its possessor to draw correct conclusions”.
6. Most of the problems of the modern State are economic in nature. So
economists play an important role in the affairs of the State.
7. During World War II, the German economy was damaged heavily. There was
inflation, shortage of goods and mass unemployment. But the German economy
recovered quickly by following the advice of an economist Ludwig Erhard. The German
recovery is considered an economic miracle.
8. Similarly, J.M.Keynes, had great influence on the economic policies of the
American government when it was in great economic trouble during the 1930s.
www.Padasalai.Net www.TrbTnpsc.com
http://www.trbtnpsc.com/2013/07/latest-12th-study-materials-2013.html
www.Padasalai.Net

* Revision Material * +2 ECONOMICS : Mohan R
46
6. Explain the characteristics of human wants (SACCUR-HAV-9)
Characteristics of wants
1. Wants are unlimited: Man is a bundle of desires. There is no limit to human
wants. If one set of wants are fulfilled, immediately another set of wants would be felt.
2. Every want is satiable: wants in general are unlimited. But a single or a
particular want is satiable. We can completely satisfy a single want.
3. Wants are competitive: Wants are unlimited. The resources and time at our
disposal are much limited and we cannot satisfy all wants. So the wants will be competing
to get satisfied.
4. Wants are complementary: Some wants are complementary in nature, i.e. they have
to be satisfied together. Though the want may be a single one, we require many
commodities and services to satisfy that want.
5. Wants are alternative: A want can be satisfied by two or more goods or by
two or more methods. A want for hot drink may be satisfied by coffee or tea.
We may go by ‘bus’ or ‘train’ or by ‘taxi’ to reach our destination.
6. Wants vary with time, place and person: Wants are not static in character.
They are changing with time, place and person. We require hot drinks in winter
and cool drinks in summer.
7. Some wants recur again: Some wants are felt again and again. The want for food
can be satisfied by eating food. Again the same want appear after a few
hours. That is why we say wants are recurring in nature.
8. Wants are influenced by advertisements: Effective advertisements through
films, journals, radio and TV will create new wants and the existing wants get
modified.
9. Wants become habits and customs: If a particular want is satisfied repeatedly by a
commodity, then it becomes a habit. Example: drinking coffee and tea. Wants become
habits and habits are responsible for wants.
www.Padasalai.Net www.TrbTnpsc.com
http://www.trbtnpsc.com/2013/07/latest-12th-study-materials-2013.html
www.Padasalai.Net

* Revision Material * +2 ECONOMICS : Mohan R
47
7. Describe the Law of Diminishing Marginal Utility with a diagram?
Definition
According to Marshall, “The additional benefit which a person derives from a
given increase of his stock of a thing diminishes with every increase in the stock that
he already has”.
Assumptions of the Law (SITICS – RM)
1. The units of consumption must be in standard units e.g., a cup of tea, a bottle of cool
drink etc.
2. All the units of the commodity must be identical in all aspects like taste, quality,
colour and size.
3. The law holds good only when the process of consumption continues without any time
gap.
4. The consumer’s taste, habit or preference must remain the same during the
process of consumption.
5. The income of the consumer remains constant.
6. The prices of the commodity consumed and its substitutes are constant.
7. The consumer is assumed to be a rational economic man. As a rational
consumer, he wants to maximise the total utility.
8. Utility is measurable.
www.Padasalai.Net www.TrbTnpsc.com
http://www.trbtnpsc.com/2013/07/latest-12th-study-materials-2013.html
www.Padasalai.Net

* Revision Material * +2 ECONOMICS : Mohan R
48
Explanation
When person X
Continuously eats
apples
Circumstances Apples Marginal Utility
While Hungry 1st Apple High Marginal Utility
(Great Pleasure)
While not in Hungry (after
hungry) 2nd Apple Low Marginal Utility
Explanation of Table and Diagram: Table gives the utility derived by a
person from successive units of consumption of apples. From Table and figure it is very
clear that the marginal utility (addition made to the total utility) goes on declining. The
consumer derives 20 units of utility from the first apple he consumes. When he consumes
the apples continuously, the marginal utility falls to 5 units for the fourth apple and
becomes zero for the fifth apple. The marginal utilities are negative for the 6th and 7th
apples. Thus when the consumer consumes a commodity continuously, the marginal
utility declines, reaches zero and then becomes negative.
www.Padasalai.Net www.TrbTnpsc.com
http://www.trbtnpsc.com/2013/07/latest-12th-study-materials-2013.html
www.Padasalai.Net

* Revision Material * +2 ECONOMICS : Mohan R
49
Importance of Law of DMU
i) The Law of Diminishing Marginal Utility (DMU) is the foundation for various other
economic laws.
(ii) The Law of DMU operates in the case of money also.
(iii) This law is a handy tool for the Finance Minister for increasing tax rate on the
rich.
(iv) Producers are guided by the operation the Law of DMU, unconsciously.
Criticism
(i) Deriving utility is a psychological experience, In reality, utility cannot be measured.
(ii) a single commodity consumption mode is an unrealistic assumption.
In real life, a consumer consumes more than one good at a time.
(iii) According to the Law, a consumer should consume successive units of the
same good continuously. In real life it is not so.
(iv) In real life, the marginal utility derived from the consumption of a good cannot be
measured precisely in monetary terms.
(v) As utility itself is capable of varying from person to person, marginal utility
derived from the consumption of a good cannot be measured precisely.
www.Padasalai.Net www.TrbTnpsc.com
http://www.trbtnpsc.com/2013/07/latest-12th-study-materials-2013.html
www.Padasalai.Net
* Revision Material * +2 ECONOMICS : Mohan R
50
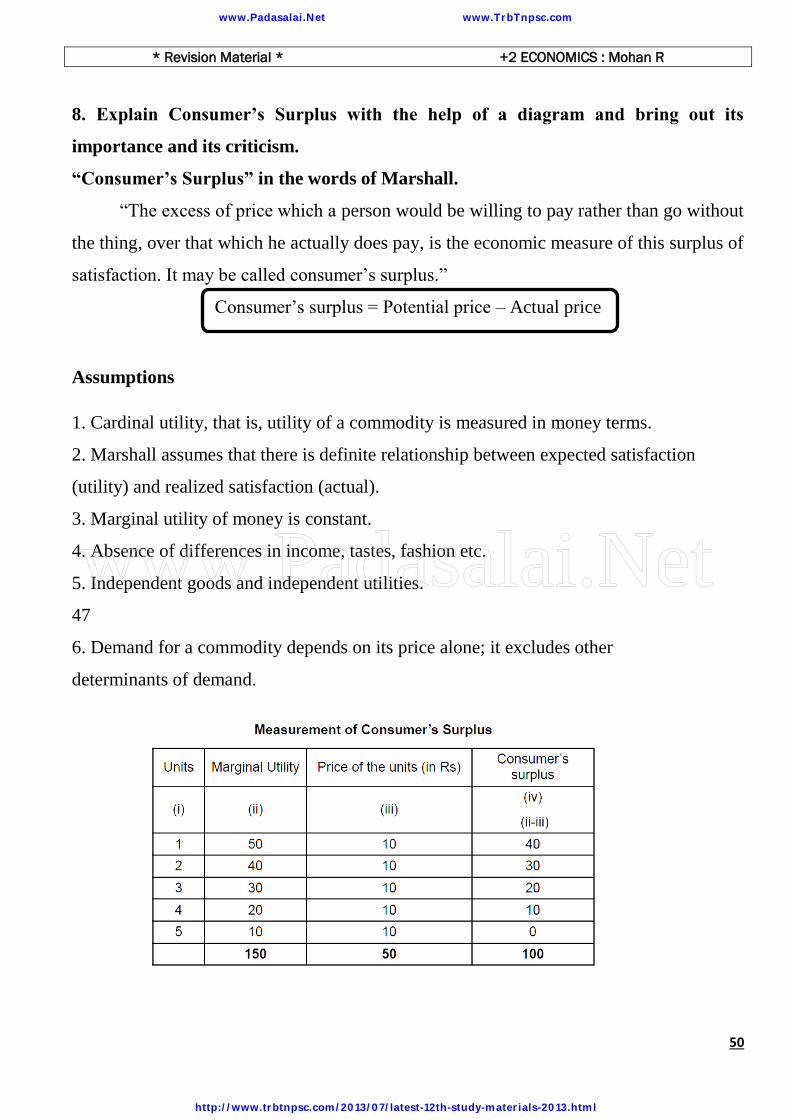
8. Explain Consumer’s Surplus with the help of a diagram and bring out its
importance and its criticism.
“Consumer’s Surplus” in the words of Marshall.
“The excess of price which a person would be willing to pay rather than go without
the thing, over that which he actually does pay, is the economic measure of this surplus of
satisfaction. It may be called consumer’s surplus.”
Consumer’s surplus = Potential price – Actual price
Assumptions
1. Cardinal utility, that is, utility of a commodity is measured in money terms.
2. Marshall assumes that there is definite relationship between expected satisfaction
(utility) and realized satisfaction (actual).
3. Marginal utility of money is constant.
4. Absence of differences in income, tastes, fashion etc.
5. Independent goods and independent utilities.
47
6. Demand for a commodity depends on its price alone; it excludes other
determinants of demand.
www.Padasalai.Net www.TrbTnpsc.com
http://www.trbtnpsc.com/2013/07/latest-12th-study-materials-2013.html
www.Padasalai.Net

* Revision Material * +2 ECONOMICS : Mohan R
51
In the above table, we have assumed that the market price of the commodity is
Rs10/- (column 3). Column 2 gives the marginal utility. The table consumer’s surplus for
each unit is the difference between Marginal Utility (column 2) minus market price
(column 3). The consumer’s surplus for all the units can be calculated as total utility
minus the total amount spent on the commodity i.e. consumer’s surplus = Rs 150 – 50 =
Rs 100. Consumer’s surplus can be illustrated with a diagram by taking units of the
commodity on the x-axis and the utility and price on the y-axis.
In the figure, MU is the marginal utility curve. OP is the price and OM is the
quantity purchased. For OM units, the consumer is willing to pay OAEM. The actual
amount he pays.
Criticism
1. Marshall assumed that there’s no interpersonal differences. But it will change with
regard to tastes, preferences, status etc.
2. Marshall assumed that there is constancy of marginal utility of money. But it is
unrealistic. Marginal utility of money increases with the fall in the stock of money.
Importance of Consumer’s Surplus
1. Consumer’s Surplus is useful to the Finance Minister in formulating taxation
policies. 2. It is also helpful in fixing a higher price by a monopolist in the market,
based on the extent of consumer’s surplus enjoyed by consumers. 3. Consumer’s Surplus
enables comparison of the standard of living of people of different regions or countries
www.Padasalai.Net www.TrbTnpsc.com
http://www.trbtnpsc.com/2013/07/latest-12th-study-materials-2013.html
www.Padasalai.Net

* Revision Material * +2 ECONOMICS : Mohan R
52
9. Explain the Indifference Curve Approach
Definition of Indifference Curve:
An indifference curve is the locus of different combinations of two commodities
giving the same level of satisfaction.
Assumptions of indifference curve analysis:
1. The consumer is rational. So, he prefers more goods to less goods.
2. He purchases two goods, X and Y only.
3. The price that a consumer pays for a commodity indicates the level of utility
derived by him.
4. His income remains constant
5. His tastes, Preference , habits remain unchanged.
Indifference schedule:
An indifference schedule is a statement of various combinations of
two commodities that will equally be accepted by the consumer. The various
combinations give equal satisfaction to the consumer. Therefore he is indifferent
between various combinations. Let us assume that the consumer buys two commodities -
bananas and biscuits. Then the indifference schudule will be:
.
www.Padasalai.Net www.TrbTnpsc.com
http://www.trbtnpsc.com/2013/07/latest-12th-study-materials-2013.html
www.Padasalai.Net

* Revision Material * +2 ECONOMICS : Mohan R
53
From the above schedule it can be understood that while the number of biscuits is
increasing, the number of bananas is decreasing so that the level of satisfaction is the
same for all the combinations. Therefore the consumer is indifferent between the
combinations A, B, C, D and E.
Indifference curve:
The data in the indifference schedule can be represented in the graph with
one commodity on the X-axis and another commodity in the Y-axis The various
combinations of the two commodities are plotted and joined to form a curve called
indifference curve. In the figure IC is an indifference curve showing combinations of the
two commodities given in the schedule.
All the points on this curve give equal level of satisfaction to the consumer.
Indifference curve is otherwise called ‘iso –utility curve’.
www.Padasalai.Net www.TrbTnpsc.com
http://www.trbtnpsc.com/2013/07/latest-12th-study-materials-2013.html
www.Padasalai.Net

* Revision Material * +2 ECONOMICS : Mohan R
54
10. What is Indifference curve map ? Explain the properties of indifference curve
with diagrams.
Definition of Indifference Curve:
An indifference curve is the locus of different combinations of two commodities
giving the same level of satisfaction.
Indifference Map : Meaning
Indifference Map is a group of indifference curves for two commodities
showing different levels of satisfaction.
In this indifference map, it should be clearly understood that a higher indifference
curve denotes higher level of satisfaction and a lower indifference curve represents lower
level of satisfaction. Being rational, the consumer will always choose a higher
indifference curve to get maximum satisfaction, other things being equal.
Properties of an Indifference curve
1. Indifference curves slope downwards to the right
2. Indifference curves are convex to the origin
3. No two indifference curves can ever cut each other.
www.Padasalai.Net www.TrbTnpsc.com
http://www.trbtnpsc.com/2013/07/latest-12th-study-materials-2013.html
www.Padasalai.Net

* Revision Material * +2 ECONOMICS : Mohan R
55
I. All indifference curves slope downwards from left to right
The downward slope of indifference curve must be attributed to the fact that the
consumer is substituting good X by good Y, increases the amount of Y and reduces the
amount of X. If the indifference curve were horizontal line running parallel to X axis then
the combination which it represents is the same amount of Y but more and more of
X. In that case, the satisfaction from the combination will not be equal. For the same
reason, it can be said that indifference curve will not be vertical.
II. All indifference curves are convex to the origin
This is because of the operation of a principle known as ‘Diminishing Marginal
Rate of Substitution’. The indifference curves are based on this principle. If they are
concave to the origin, then it will mean that MRS is increasing. Indifference curve cannot
be straight line except when the goods are perfect substitutes.
Marginal rate of substitution between X and Y referes to the amount of
commodity Y to be offered in exchange for one unit of X commodity. The MRS goes on
diminishing as consumer goes on substituting X for Y. The third assumption is that no
two indifference curves can ever cut each other. But in
www.Padasalai.Net www.TrbTnpsc.com
http://www.trbtnpsc.com/2013/07/latest-12th-study-materials-2013.html
www.Padasalai.Net

* Revision Material * +2 ECONOMICS : Mohan R
56
Figure 3.8 we find two indifference curves do cut each other. Point A which is on
indifference curve 2 represents a higher level of satisfaction to the consumer than at point
B which is on indifference curve 1. But point C lies on both curves. That means, two
levels of satisfaction A and B which are unequal have become equal. That cannot be
accepted. So indifference curves can never cut each other.
11. Discuss the law of demand.
Definition - Law of Demand:
Alfred Marshall stated that “ the greater the amount sold, the smaller must be the
price at which it is offered, in order that it may find purchasers;
or in other words, the amount demanded increases with a fall in price and diminishes with
rise in price”.
Dx = f (Px, Ps, Y, T, W)
The law of demand states that there is a negative or inverse relationship
between the price and quantity demanded of a commodity over a period of time.
Assumptions of the Law (TIPS F)
1. No change in the consumer’s income
2. No change in consumer’s tastes and preferences
3. No changes in the prices of other goods
4. No new substitutes for the goods have been discovered
5. People do not feel that the present fall in price is a prelude to a further decline in price.
Demand Schedule
Demand schedule is a tabular statement showing how much of a commodity is
demanded at different prices.
www.Padasalai.Net www.TrbTnpsc.com
http://www.trbtnpsc.com/2013/07/latest-12th-study-materials-2013.html
www.Padasalai.Net

* Revision Material * +2 ECONOMICS : Mohan R
57
Demand Schedule and Demand curve
Table 4.1 is a hypothetical demand schedule of an individual consumer. It
shows a list of prices and corresponding quantities demanded by an individual
consumer. This is an individual demand schedule.
Demand Curve
The demand schedule can be converted into a demand curve by measuring price on
vertical axis and quantity on horizontal axis as shown in Figure 4.1.
In Figure, 4.1 DD1 is the demand curve. The curve slopes downwards from left to
right showing that, when price rises, less is demanded and vice versa. Thus the demand
curve represents the inverse relationship between the price and quantity demanded, other
things remaining constant.
Why does the demand curve slope downwards? The demand curve
slopes downwards mainly due to the law of diminishing marginal utility.
www.Padasalai.Net www.TrbTnpsc.com
http://www.trbtnpsc.com/2013/07/latest-12th-study-materials-2013.html
www.Padasalai.Net

* Revision Material * +2 ECONOMICS : Mohan R
58
Market demand schedule
A demand schedule for a market can be constructed by adding up demand
schedules of the individual consumers in the market. Suppose that the market for oranges
consists of 2 consumers. The market demand is calculated as follows.
Market demand curve
The market demand also increases with a fall in price and vice versa.
In Figure 4.2, the quantity demanded by consumer I and consumer II are measured on the
horizontal axis and the market price is measured on the vertical
axis. The total demand of these two consumers i.e.
D1 + D2 = DD M
DDM – the market demand curve - also slopes downwards just like the individual
demand curve. Like normal demand curvs, it is convex to the origin. This reveals the
inverse relationship.
www.Padasalai.Net www.TrbTnpsc.com
http://www.trbtnpsc.com/2013/07/latest-12th-study-materials-2013.html
www.Padasalai.Net

* Revision Material * +2 ECONOMICS : Mohan R
59
Exceptions to the Law of Demand
(1) Veblen Effect
Veblen has pointed out that there are some goods demanded by very rich
people for their social prestige. When price of such goods rise, their use becomes more
attractive and they are purchased in larger quantities. Eg: Demand for diamonds
(2) Write a note on Giffen Paradox
Sir Robert Giffen discovered that the poor people will demand more of inferior
goods if their prices rise and demand less if their prices fall. E.g. Ragi, cholam.
Exceptional Demand - Diagram & Explanation:
When the price increases from OP to OP1, quantity demanded also increases from
OQ to OQ1 and vice versa. DD is the exceptional or abnormal demand curve. The
following is the list of few exceptions to the law of demand.
www.Padasalai.Net www.TrbTnpsc.com
http://www.trbtnpsc.com/2013/07/latest-12th-study-materials-2013.html
www.Padasalai.Net

* Revision Material * +2 ECONOMICS : Mohan R
60
12. Explain the methods of measurement of price elasticity of demand in detail.
Price elasticity of demand
“The degree of responsiveness of quantity demanded to a change in price is called
price elasticity of demand”
Measurement of price elasticity of demand
1) Percentage method
2) Point method or slope method
3) Total outlay method
4) Arc method
1. Percentage method
This is measured as the relative change in demand divided by relative change
in price (or) percentage change in demand divided by percentage change in price.
For example, the price of rice rises by 10% and the demand for rice falls by 15% Then
ep = 15/10 = 1.5
www.Padasalai.Net www.TrbTnpsc.com
http://www.trbtnpsc.com/2013/07/latest-12th-study-materials-2013.html
www.Padasalai.Net

* Revision Material * +2 ECONOMICS : Mohan R
61
Graphical illustration
All the five measures are illustrated in the following figures 4.6 to 4.10
respectively.
www.Padasalai.Net www.TrbTnpsc.com
http://www.trbtnpsc.com/2013/07/latest-12th-study-materials-2013.html
www.Padasalai.Net

* Revision Material * +2 ECONOMICS : Mohan R
62
a) Relatively Elastic demand, if the value of elasticity is greater than 1
b) Relatively Inelastic demand, if the value of elasticity is less than 1
c) Unitary elastic demand, if the value of elasticity is equal to 1.
d) Perfectly inelastic demand, if the value of elasticity is zero.
e) Perfectly elastic demand, if the value of elasticity is infinity.
www.Padasalai.Net www.TrbTnpsc.com
http://www.trbtnpsc.com/2013/07/latest-12th-study-materials-2013.html
www.Padasalai.Net

* Revision Material * +2 ECONOMICS : Mohan R
63
www.Padasalai.Net www.TrbTnpsc.com
http://www.trbtnpsc.com/2013/07/latest-12th-study-materials-2013.html
www.Padasalai.Net
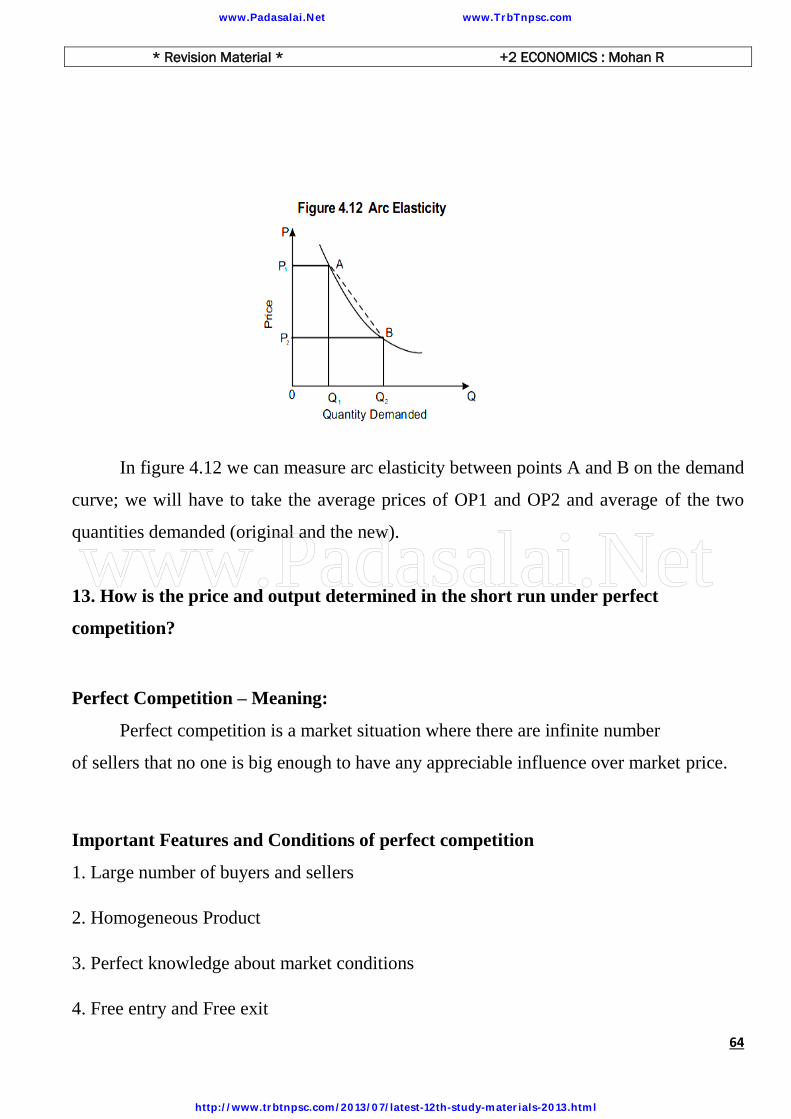
* Revision Material * +2 ECONOMICS : Mohan R
64
In figure 4.12 we can measure arc elasticity between points A and B on the demand
curve; we will have to take the average prices of OP1 and OP2 and average of the two
quantities demanded (original and the new).
13. How is the price and output determined in the short run under perfect
competition?
Perfect Competition – Meaning:
Perfect competition is a market situation where there are infinite number
of sellers that no one is big enough to have any appreciable influence over market price.
Important Features and Conditions of perfect competition
1. Large number of buyers and sellers
2. Homogeneous Product
3. Perfect knowledge about market conditions
4. Free entry and Free exit
www.Padasalai.Net www.TrbTnpsc.com
http://www.trbtnpsc.com/2013/07/latest-12th-study-materials-2013.html
www.Padasalai.Net

* Revision Material * +2 ECONOMICS : Mohan R
65
Nature of Revenue curves
1. Under perfect competition, the market price is determined by the market forces namely
the demand for and the supply of the products.
2. Hence there is uniform price in the market and all the units of the output are sold at the
same price.
3. As a result the average revenue is perfectly elastic.
4. The average revenue curve is horizontally parallel to X-axis.
Short run equilibrium price and output determination under perfect competition
1. Since a firm in the perfectly competitive market is a price-taker, it has to adjust its level
of output to maximise its profit.
2. The short run is a period the firm can produce more only by increasing the variable
inputs.
3. The firm in the perfectly competitive market can either earn supernormal profit or
normal profit or incur loss in the short period.
Super-normal Profit
When the average revenue of the firm is greater than its average cost, the firm is
earning super-normal profit.
www.Padasalai.Net www.TrbTnpsc.com
http://www.trbtnpsc.com/2013/07/latest-12th-study-materials-2013.html
www.Padasalai.Net

* Revision Material * +2 ECONOMICS : Mohan R
66
Diagrammatic Explanation:
In figure , output is measured along the x-axis and price, revenue and cost
along the y-axis. OP is the prevailing price in the market. PL is the demand curve or
average and the marginal revenue curve. SAC and SMC are the short run average and
marginal cost curves. The firm is in equilibrium at point ‘E’ where MR = MC and MC
curve cuts MR curve from below at the point of equilibrium. Therefore the firm will be
producing OM level of output. At the OM level of output ME is the AR and MF is the
average cost. The profit per unit of output is EF (the difference between ME and
MF). The total profits earned by the firm will be equal to EF (profit per unit) multiplied
by OM or HF (total output). Thus the total profits will be equal to the area HFEP. HFEP
is the supernormal profits earned by the firm.
14. Define monopoly. What are the characteristics and causes of monopoly?
Monopoly
Monopoly is a market structure in which there is a single seller, there are no close
substitutes for the commodity it produces and there are barriers to entry.
Characteristics of Monopoly
1. Single Seller: There is only one seller; he can control either price or supply of his
product. But he cannot control demand for the product, as there are many buyers. .
2. N o close Substitutes: There are no close substitutes for the product. The buyers have
no alternatives or choice. Either they have to buy the product or go without it.
3. Price: The monopolist has control over the supply so as to increase the price.
Sometimes he may adopt price discrimination. He may fix different prices for different
sets of consumers. A monopolist can either fix the price or quantity of output; but he
cannot do both, at the same time.
www.Padasalai.Net www.TrbTnpsc.com
http://www.trbtnpsc.com/2013/07/latest-12th-study-materials-2013.html
www.Padasalai.Net

* Revision Material * +2 ECONOMICS : Mohan R
67
4. N o Entry: There is no freedom to other producers to enter the market as the
monopolist is enjoying monopoly power. There are strong barriers for new firms to enter.
There are legal, technological, economic and natural obstacles, which may block the entry
of new producers.
5. Firm and Industry: Under monopoly, there is no difference between a firm and an
industry. As there is only one firm, that single firm constitutes the whole industry.
Causes for Monopoly
1. Natural: A monopoly may arise on account of some natural causes. Some minerals are
available only in certain regions. For example, South Africa has the monopoly of
diamonds; nickel in the world is mostly available in Canada and oil in Middle East. This
is natural monopoly.
2. Technical: Monopoly power may be enjoyed due to technical reasons. A firm may
have control over raw materials, technical knowledge, special know-how, scientific
secrets and formula that enable a monopolist to produce a commodity. e.g., Coco Cola.
3. Legal: Monopoly power is achieved through patent rights, copyright and trade marks
by the producers. This is called legal monopoly.
4. Large Amount of Capital: The manufacture of some goods requires a large amount of
capital or lumpiness of capital. All firms cannot enter the field because they cannot afford
to invest such a large amount of capital. This may give rise to monopoly. For example,
iron and steel industry, railways, etc.
5. State: Government will have the sole right of producing and selling some goods. They
are State monopolies. For example, we have public utilities like electricity and railways.
These public utilities are undertaken by the State.
www.Padasalai.Net www.TrbTnpsc.com
http://www.trbtnpsc.com/2013/07/latest-12th-study-materials-2013.html
www.Padasalai.Net
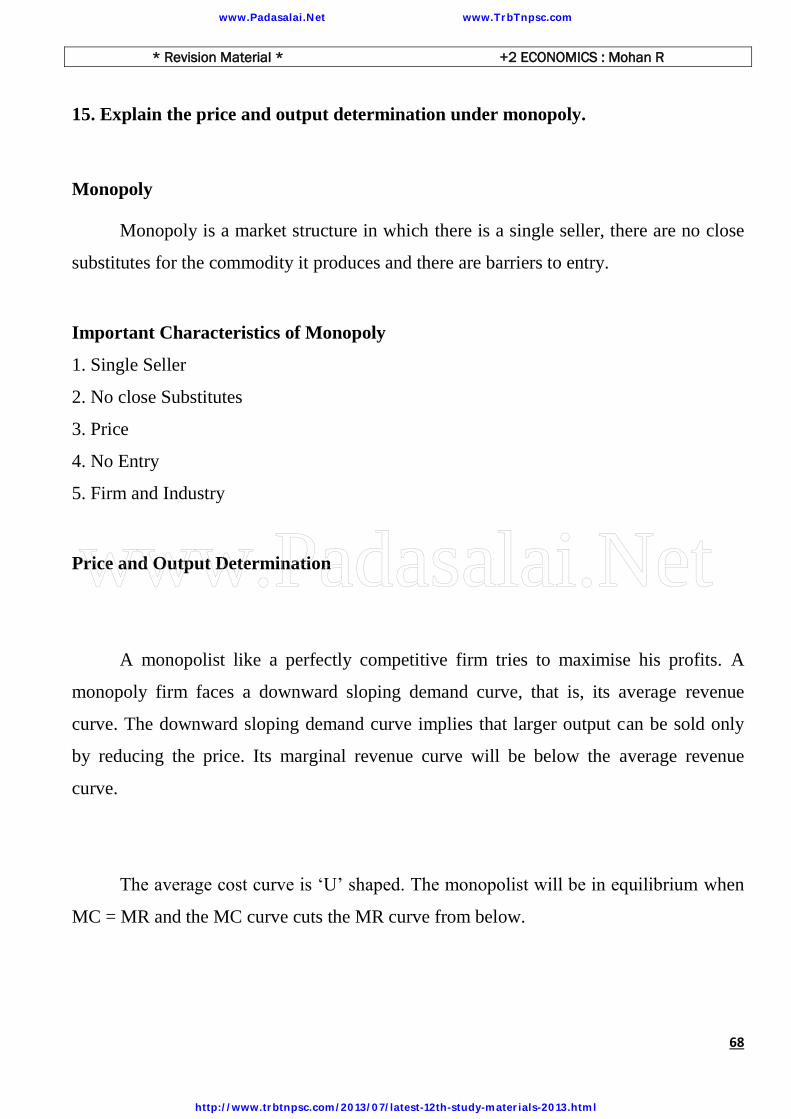
* Revision Material * +2 ECONOMICS : Mohan R
68
15. Explain the price and output determination under monopoly.
Monopoly
Monopoly is a market structure in which there is a single seller, there are no close
substitutes for the commodity it produces and there are barriers to entry.
Important Characteristics of Monopoly
1. Single Seller
2. No close Substitutes
3. Price
4. No Entry
5. Firm and Industry
Price and Output Determination
A monopolist like a perfectly competitive firm tries to maximise his profits. A
monopoly firm faces a downward sloping demand curve, that is, its average revenue
curve. The downward sloping demand curve implies that larger output can be sold only
by reducing the price. Its marginal revenue curve will be below the average revenue
curve.
The average cost curve is ‘U’ shaped. The monopolist will be in equilibrium when
MC = MR and the MC curve cuts the MR curve from below.
www.Padasalai.Net www.TrbTnpsc.com
http://www.trbtnpsc.com/2013/07/latest-12th-study-materials-2013.html
www.Padasalai.Net

* Revision Material * +2 ECONOMICS : Mohan R
69
In figure, AR is the Average Revenue Curve and MR is the Marginal revenue
curve. AR curve is falling and MR curve lies below AR. The monopolist is in equilibrium
at E where MR = MC. He produces OM units of output and fixes price at OP. At OM
output, the average revenue is MS and average cost MT. Therefore the profit per unit is
MS-MT = TS. Total profit is average profit (TS) multiplied by output (OM), which is
equal to HTSP. The monopolist is in equilibrium at point E and produces OM output at
which he is earning maximum profit. The monopoly price is higher than the marginal
revenue and marginal cost.
www.Padasalai.Net www.TrbTnpsc.com
http://www.trbtnpsc.com/2013/07/latest-12th-study-materials-2013.html
www.Padasalai.Net

* Revision Material * +2 ECONOMICS : Mohan R
70
16. Explain the advantages and disadvantages of monopoly.
Advantages of Monopoly:
1. Monopoly firms have large-scale production possibilities and also can enjoy
both internal and external economies. This will result in the reduction of costs of
production. Output can be sold at low prices.
2. Monopoly firms have vast financial resources which could be used for research and
development. This will enable the firms to innovate quickly.
3. There are a number of weak firms in an industry. These firms can combine
together in the form of monopoly to meet competition. In such a case, market
can be expanded.
Disadvantages of Monopoly:
1. A monopolist always charges a high price, which is higher than the competitive price.
Thus a monopolist exploits the consumers.
2. A monopolist is interested in getting maximum profit. He may restrict the output and
raise prices. Thus, he creates artificial scarcity for his product.
3. A monopolist often charges different prices for the same product from different
consumers. He extracts maximum price according to the ability to pay of different
consumers.
4. A monopolist may adopt wrong practices to establish absolute monopoly power.
5. In a country dominated by monopolies, wealth is concentrated in the hands of
a few. It will lead to inequality of incomes.
www.Padasalai.Net www.TrbTnpsc.com
http://www.trbtnpsc.com/2013/07/latest-12th-study-materials-2013.html
www.Padasalai.Net

* Revision Material * +2 ECONOMICS : Mohan R
71
17. Differentiate the perfect competition from monopoly.
18. Explain the price and output determination under monopolistic competition.
Monopolistic Competition – Meaning:
Monopolistic competition refers to the market situation in which a
large number of sellers produce goods which are close substitutes of one another. The
products are similar but not identical.
The following are the examples of monopolistic competition in Indian context.
1. Shampoo - Sun Silk, Clinic Plus, Ponds & etc
2. Tooth Paste - Binaca, Colgate, Forhans & etc
www.Padasalai.Net www.TrbTnpsc.com
http://www.trbtnpsc.com/2013/07/latest-12th-study-materials-2013.html
www.Padasalai.Net
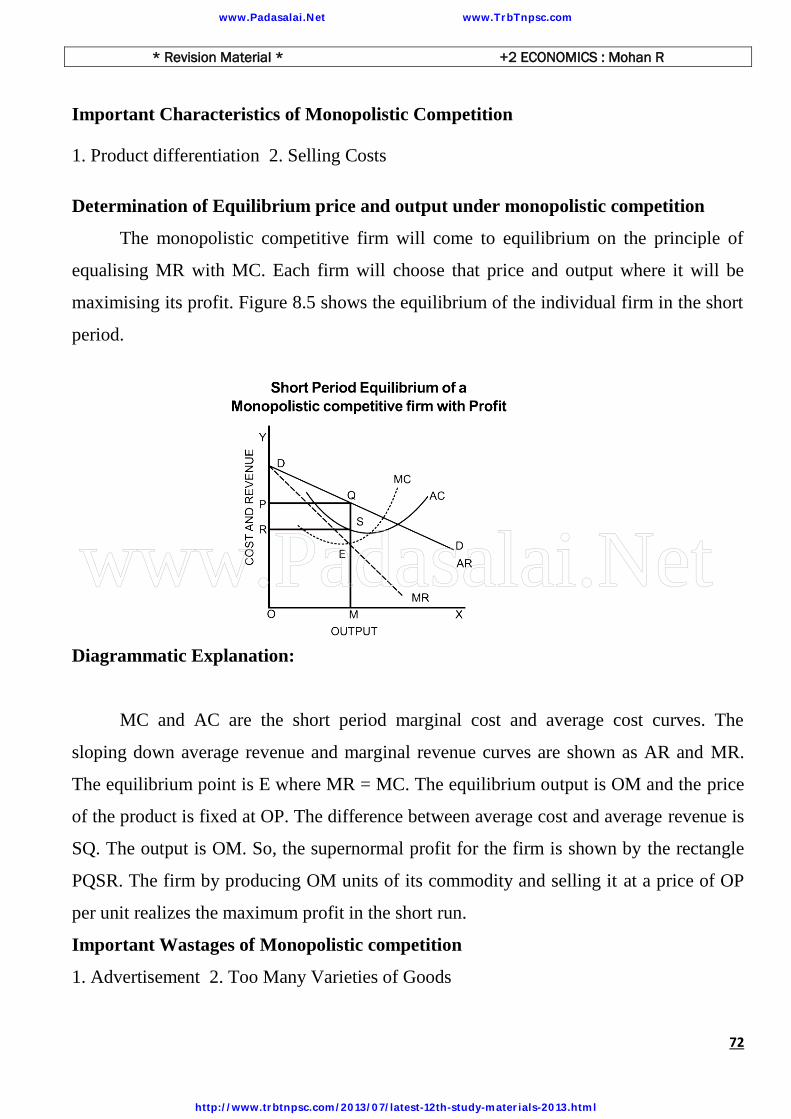
* Revision Material * +2 ECONOMICS : Mohan R
72
Important Characteristics of Monopolistic Competition
1. Product differentiation 2. Selling Costs
Determination of Equilibrium price and output under monopolistic competition
The monopolistic competitive firm will come to equilibrium on the principle of
equalising MR with MC. Each firm will choose that price and output where it will be
maximising its profit. Figure 8.5 shows the equilibrium of the individual firm in the short
period.
Diagrammatic Explanation:
MC and AC are the short period marginal cost and average cost curves. The
sloping down average revenue and marginal revenue curves are shown as AR and MR.
The equilibrium point is E where MR = MC. The equilibrium output is OM and the price
of the product is fixed at OP. The difference between average cost and average revenue is
SQ. The output is OM. So, the supernormal profit for the firm is shown by the rectangle
PQSR. The firm by producing OM units of its commodity and selling it at a price of OP
per unit realizes the maximum profit in the short run.
Important Wastages of Monopolistic competition
1. Advertisement 2. Too Many Varieties of Goods
www.Padasalai.Net www.TrbTnpsc.com
http://www.trbtnpsc.com/2013/07/latest-12th-study-materials-2013.html
www.Padasalai.Net
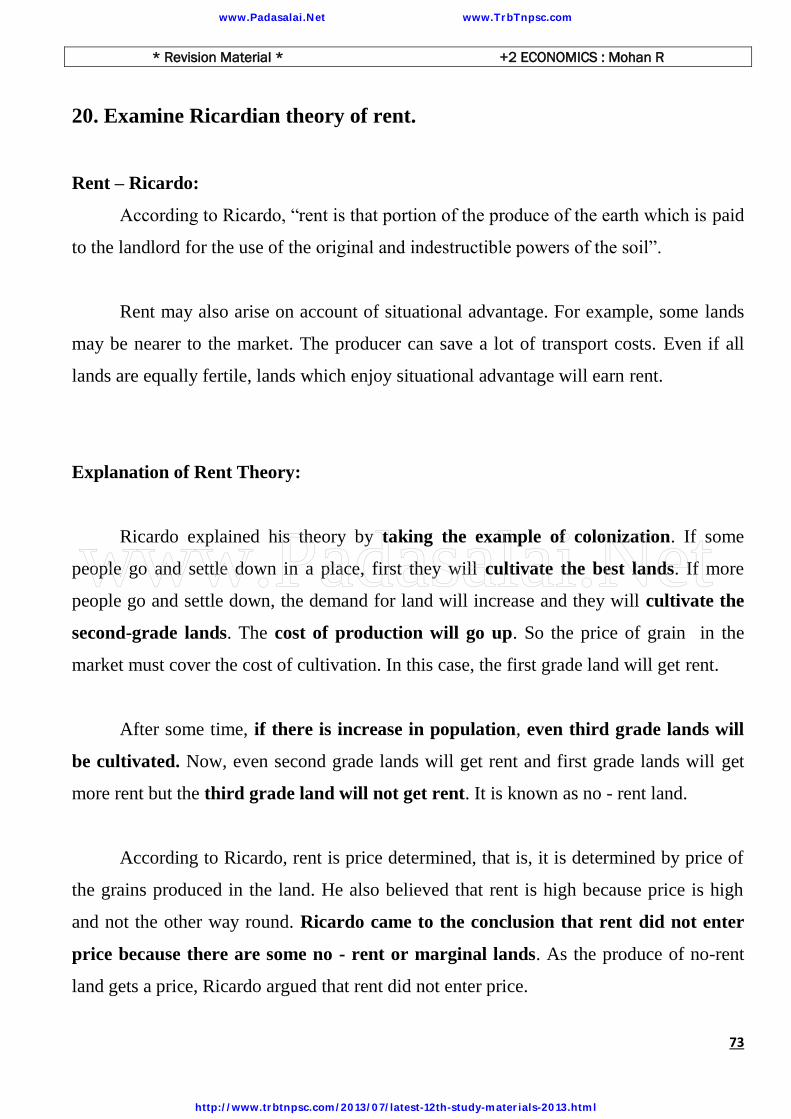
* Revision Material * +2 ECONOMICS : Mohan R
73
20. Examine Ricardian theory of rent.
Rent – Ricardo:
According to Ricardo, “rent is that portion of the produce of the earth which is paid
to the landlord for the use of the original and indestructible powers of the soil”.
Rent may also arise on account of situational advantage. For example, some lands
may be nearer to the market. The producer can save a lot of transport costs. Even if all
lands are equally fertile, lands which enjoy situational advantage will earn rent.
Explanation of Rent Theory:
Ricardo explained his theory by taking the example of colonization. If some
people go and settle down in a place, first they will cultivate the best lands. If more
people go and settle down, the demand for land will increase and they will cultivate the
second-grade lands. The cost of production will go up. So the price of grain in the
market must cover the cost of cultivation. In this case, the first grade land will get rent.
After some time, if there is increase in population, even third grade lands will
be cultivated. Now, even second grade lands will get rent and first grade lands will get
more rent but the third grade land will not get rent. It is known as no - rent land.
According to Ricardo, rent is price determined, that is, it is determined by price of
the grains produced in the land. He also believed that rent is high because price is high
and not the other way round. Ricardo came to the conclusion that rent did not enter
price because there are some no - rent or marginal lands. As the produce of no-rent
land gets a price, Ricardo argued that rent did not enter price.
www.Padasalai.Net www.TrbTnpsc.com
http://www.trbtnpsc.com/2013/07/latest-12th-study-materials-2013.html
www.Padasalai.Net

* Revision Material * +2 ECONOMICS : Mohan R
74
In figure 9.3, grades of land are shown along the X axis and the output up the y–
axis. The shaded area in the diagram indicates rent. In this case, grade I and gradeII
lands get rent. The grade III land will not get rent.
Criticism of the Ricardian Theory of Rent
1. According to Ricardo, land has “original and indestructible powers”. But the fertility of
land may decline after some time because of continuous cultivation.
2. Ricardo believed that rent is peculiar to land alone. But many modern economists argue
that the rent aspect can be seen in other factors like labour and capital. Rent arises
whenever the supply of a factor is inelastic in relation to the demand for it.
3. Ricardo is of the view that rent does not enter the price of the commodity produced in
it. But rent enters the price from the point of view of a single firm.
4. Ricardian theory does not take note of scarcity rent.
5. It is based on perfect competition. Only under perfect competition, there will be one
price for a good. But in the real world, we don’t have imperfect competition.
Conclusion:
Though there are some criticisms against the Ricardian theory, we may note it tells
that because of increasing pressure on land, we have to cultivate inferior lands.
www.Padasalai.Net www.TrbTnpsc.com
http://www.trbtnpsc.com/2013/07/latest-12th-study-materials-2013.html
www.Padasalai.Net

* Revision Material * +2 ECONOMICS : Mohan R
75
21. Loanable funds theory (Neo – classical theory) of Interest
Meaning :
The term “loanable funds” includes not only saving out of current income but also
bank credit, dishoarding and disinvestments. But by saving, the classical economists
referred only to saving out of current income. We know now that bank credit is an
important source of funds for investment.
Explanation:
In the classical theory, saving was demanded only for investment. But according to
loanable funds theory, the demand for funds arose, not only for investment but also for
hoarding wealth.
The classical theory regarded interest as a function of saving and investment, (r = f
(S.I.) But, according to loanable funds theory, the rate of interest is a function of four
variables, i.e r = f (I S M.L.) where r is the rate of interest, I = investment, S = saving,
M = bank credit and L = desire to hoard or the desire for liquidity.
www.Padasalai.Net www.TrbTnpsc.com
http://www.trbtnpsc.com/2013/07/latest-12th-study-materials-2013.html
www.Padasalai.Net

* Revision Material * +2 ECONOMICS : Mohan R
76
In Figure, the Curve ‘S’ represents savings, the curve ‘M’ represents bank credit
(including dishoarded and disinvested wealth). The curve S + M represents total loanable
funds at different rates of interest. On the demand side, the curve I represents demand for
investment. The curve L represents demand for idle cash balances or to hoard money. The
curve I + L represents the total demand for loanable funds at different rates of interest.
The market rate of interest rm is determined by the intersection of S + M curve and I + L
curve. The aggregate demand for loanable funds is equal to the aggregate supply of
loanable funds at this rate of interest. In the classical theory, rn which may be called the
natural rate of interest is determined by the intersection of I and S curves. That is, when
the rate of interest is rn, the demand for investment is equal to the supply of savings.
Criticism : There is no doubt that loanable funds theory is an improvement over the
classical theory of interest. It has been criticized on the ground that it assumes that saving
is a function of the rate of interest ; 2. it ignores the influence of the changes in the level
of investment on employment, income and on savings.
www.Padasalai.Net www.TrbTnpsc.com
http://www.trbtnpsc.com/2013/07/latest-12th-study-materials-2013.html
www.Padasalai.Net