© 12-June-2016 Chemsheets A2 1070 … · 2 The 1H and 13C NMR spectra of C 5 H 10 O 2 are shown....
13
© www.CHEMSHEETS.co.uk 12-June-2016 Chemsheets A2 1070 Page 1
Transcript of © 12-June-2016 Chemsheets A2 1070 … · 2 The 1H and 13C NMR spectra of C 5 H 10 O 2 are shown....

© www.CHEMSHEETS.co.uk 12-June-2016 Chemsheets A2 1070 Page 1
© www.CHEMSHEETS.co.uk 12-June-2016 Chemsheets A2 1070 Page 2
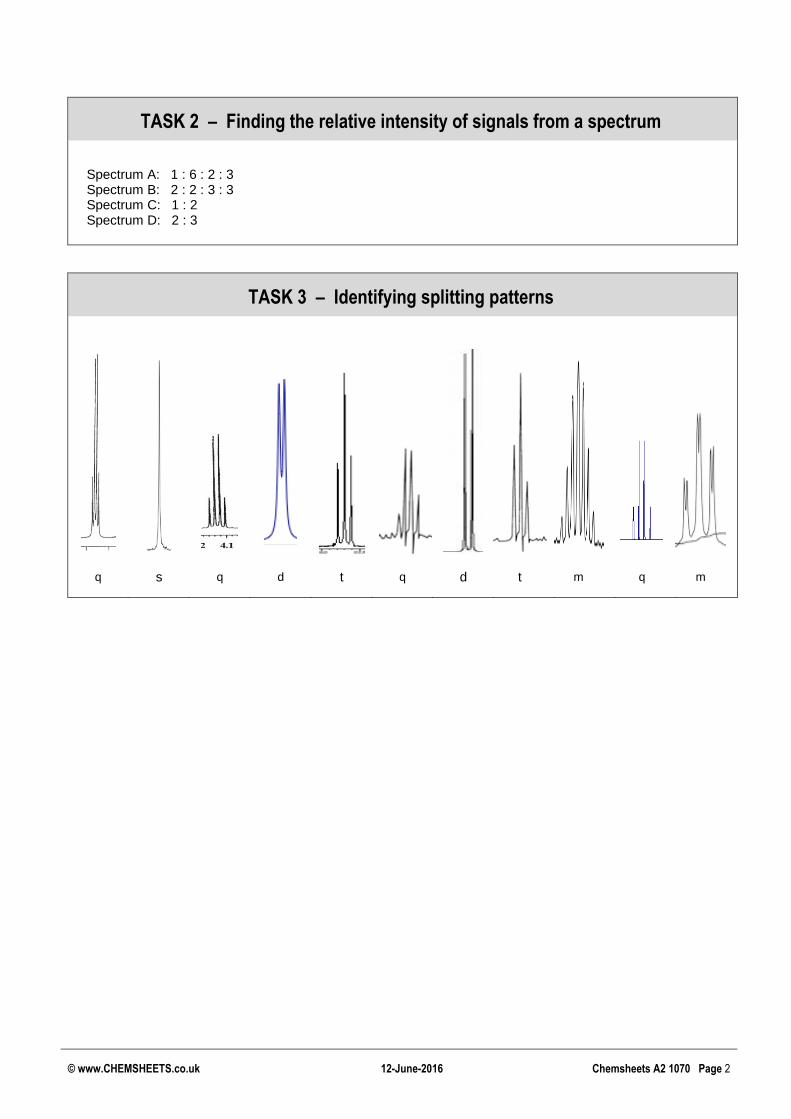
TASK 2 – Finding the relative intensity of signals from a spectrum
Spectrum A: 1 : 6 : 2 : 3 Spectrum B: 2 : 2 : 3 : 3 Spectrum C: 1 : 2 Spectrum D: 2 : 3
TASK 3 – Identifying splitting patterns
q s q d t q d t m q m

© www.CHEMSHEETS.co.uk 12-June-2016 Chemsheets A2 1070 Page 3
TASK 1 – Predicting 1H NMR spectra
Compound Structure Number
of signals Relative intensity
of signals Splitting patterns
of signals Position of signals
2-bromo-2-methylbutane
3 3 : 2 : 6 t, q, s
0.7-1.2 (3, t)
1.2-1.4 (2, q)
0.7-1.2 (6, s)
methylpropene
2 3 : 1 s, s 0.7-1.2 (3, s)
4.5-6.0 (1, s)
propene 3 2 : 1 : 3 d, m, d
0.7-1.2 (3, d)
4.5-6.0 (1, m)
4.5-6.0 (2, d)
2-chloropropane
2 6 : 1 d, m 0.7-1.2 (6, d)
3.1-3.9 (1, m)
propanone
1 s 2.1-2.6 (s)
methylamine
2 3 : 2 t, q 0.7-1.2 (3, t)
1.0-4.5 (2, q)
ethyl propanoate
4 3 : 2 : 2 : 3 t, q, q, t 0.7-1.2 (3, t), 0.7-1.2 (3, t)
2.1-2.6 (2, q), 3.7-4.1 (2, q)
1,2-dibromopropane
3 2 : 1 : 3 d, m, d
3.1-4.2 (2, d)
3.1-4.2 (1, m)
0.7-1.2 (3, d)
dimethylethyl propanoate
3 3 : 2 : 9 t, q, s
0.7-1.2 (3, t)
2.1-2.6 (2, q)
0.7-1.2 (9, s)
but-2-ene
2 3 : 1 d, q 0.7-1.2 (3, d)
4.5-6.0 (1, q)
© www.CHEMSHEETS.co.uk 12-June-2016 Chemsheets A2 1070 Page 4
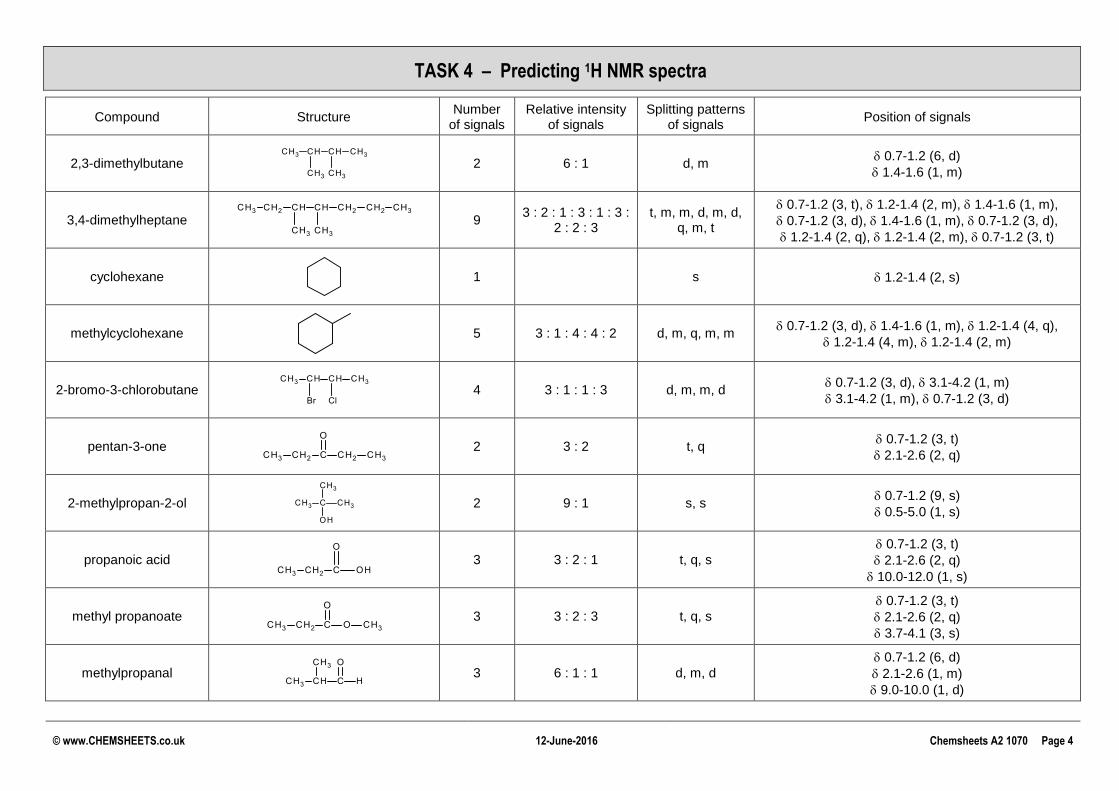
TASK 4 – Predicting 1H NMR spectra
Compound Structure Number
of signals Relative intensity
of signals Splitting patterns
of signals Position of signals
2,3-dimethylbutane
2 6 : 1 d, m 0.7-1.2 (6, d)
1.4-1.6 (1, m)
3,4-dimethylheptane
9 3 : 2 : 1 : 3 : 1 : 3 :
2 : 2 : 3 t, m, m, d, m, d,
q, m, t
0.7-1.2 (3, t), 1.2-1.4 (2, m), 1.4-1.6 (1, m),
0.7-1.2 (3, d), 1.4-1.6 (1, m), 0.7-1.2 (3, d),
1.2-1.4 (2, q), 1.2-1.4 (2, m), 0.7-1.2 (3, t)
cyclohexane
1 s 1.2-1.4 (2, s)
methylcyclohexane
5 3 : 1 : 4 : 4 : 2 d, m, q, m, m 0.7-1.2 (3, d), 1.4-1.6 (1, m), 1.2-1.4 (4, q),
1.2-1.4 (4, m), 1.2-1.4 (2, m)
2-bromo-3-chlorobutane
4 3 : 1 : 1 : 3 d, m, m, d 0.7-1.2 (3, d), 3.1-4.2 (1, m)
3.1-4.2 (1, m), 0.7-1.2 (3, d)
pentan-3-one
2 3 : 2 t, q 0.7-1.2 (3, t)
2.1-2.6 (2, q)
2-methylpropan-2-ol
2 9 : 1 s, s 0.7-1.2 (9, s)
0.5-5.0 (1, s)
propanoic acid
3 3 : 2 : 1 t, q, s
0.7-1.2 (3, t)
2.1-2.6 (2, q)
10.0-12.0 (1, s)
methyl propanoate
3 3 : 2 : 3 t, q, s
0.7-1.2 (3, t)
2.1-2.6 (2, q)
3.7-4.1 (3, s)
methylpropanal
3 6 : 1 : 1 d, m, d
0.7-1.2 (6, d)
2.1-2.6 (1, m)
9.0-10.0 (1, d)
© www.CHEMSHEETS.co.uk 12-June-2016 Chemsheets A2 1070 Page 5
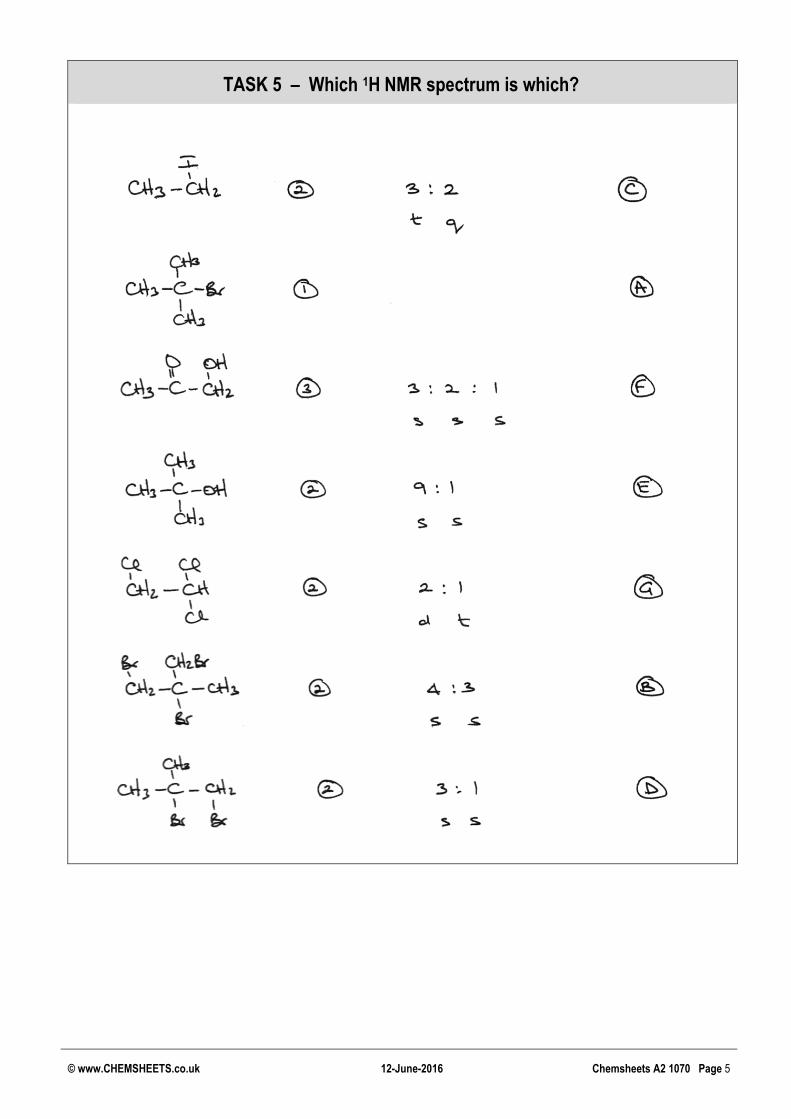
TASK 5 – Which 1H NMR spectrum is which?

© www.CHEMSHEETS.co.uk 12-June-2016 Chemsheets A2 1070 Page 6
TASK 6 – Identifying compounds

© www.CHEMSHEETS.co.uk 12-June-2016 Chemsheets A2 1070 Page 7
TASK 7 – Identifying compounds using 1H NMR
1.2
0.8
1.2
5.4
1.8
1.2
0.8
0.8
1.2
1
2

© www.CHEMSHEETS.co.uk 12-June-2016 Chemsheets A2 1070 Page 8
0.3
0.6
0.9
2.7
1.5
1.0
3.0
1.5
3
4

© www.CHEMSHEETS.co.uk 12-June-2016 Chemsheets A2 1070 Page 9
TASK 8 – Predicting 13C NMR spectra
Compound Structure Number of signals
Position of signals
2-bromo-2-methylbutane
4 5-40 (CH3CH2), 5-40 (CH3CH2), 10-70 (CBr), 5-40 ((CH3)2CBr)
methylpropene
3 90-150 (CH2), 90-150 (C), 5-40 ((CH3)2)
propene 3 90-150 (CH2), 90-150 (C), 5-40 (CH3)
2-chloropropane
2 5-40 (CH3), 10-70 (CHCl)
propanone
2 20-50 (CH3), 190-220 (CO)
methylamine
1 25-60 (CH3)
ethyl propanoate
5 5-40 (CH3CH2CO), 20-50 (CH2CO), 160-185 (CO),
50-90 (OCH2), 5-40 (OCH2CH3)
1,2-dibromopropane
3 10-70 (CH2Br), 10-70 (CHBr), 5-40 (CH3)
dimethylethyl propanoate
5 5-40 (CH3CH2CO), 20-50 (CH2CO), 160-185 (CO),
50-90 (OC), 5-40 (OCCH3)
but-2-ene
2 5-40 (CH3), 90-150 (CH)
© www.CHEMSHEETS.co.uk 12-Jun-2016 Chemsheets A2 1070 Page 10
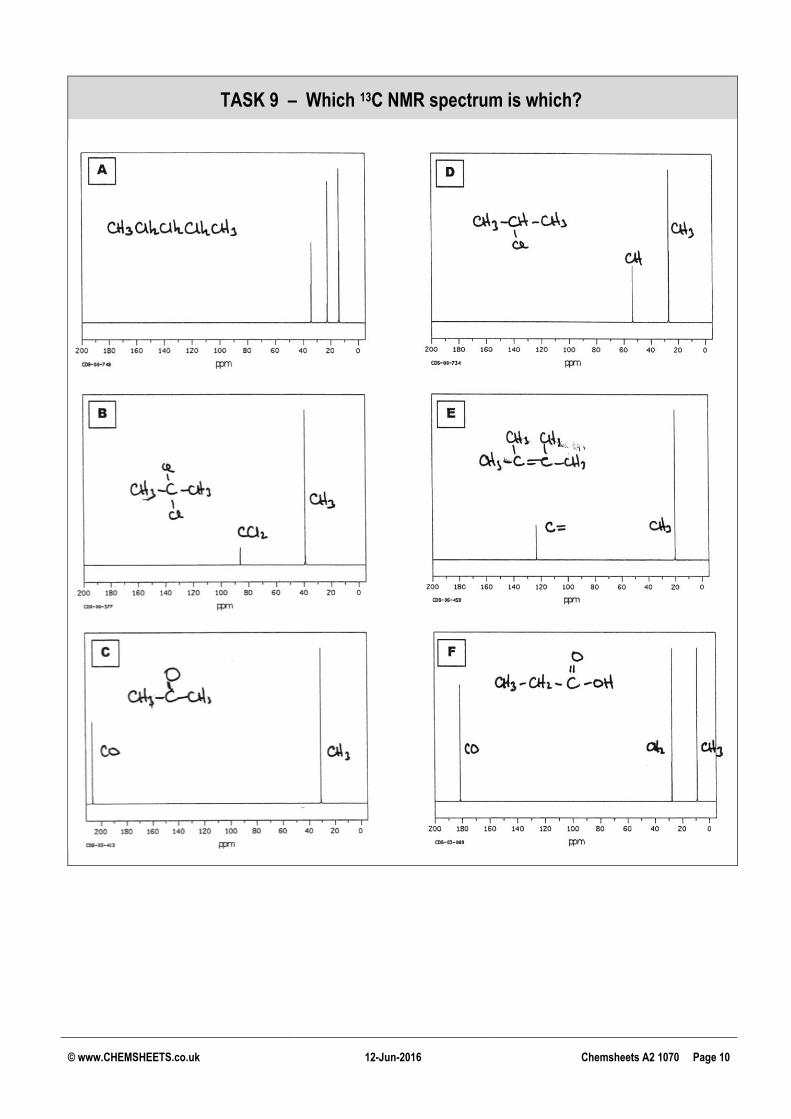
TASK 9 – Which 13C NMR spectrum is which?

© www.CHEMSHEETS.co.uk 12-Jun-2016 Chemsheets A2 1070 Page 11
TASK 10 – Using 1H and 13C NMR together to identify compounds
1 The 1H and
13C NMR spectra of C5H9OCl are shown. Deduce the structure of the compound and then
explain each signal.
0.5
1.0
1.5 1.5

© www.CHEMSHEETS.co.uk 12-Jun-2016 Chemsheets A2 1070 Page 12
2 The
1H and
13C NMR spectra of C5H10O2 are shown. Deduce the structure of the compound and then
explain each signal.
3 The 1H and
13C NMR spectra of C4H8OBr2 are shown. Deduce the structure of the compound and then
explain each signal.
0.7
2.1
13C NMR
2.4
1.2
0.4
© www.CHEMSHEETS.co.uk 12-Jun-2016 Chemsheets A2 1070 Page 13
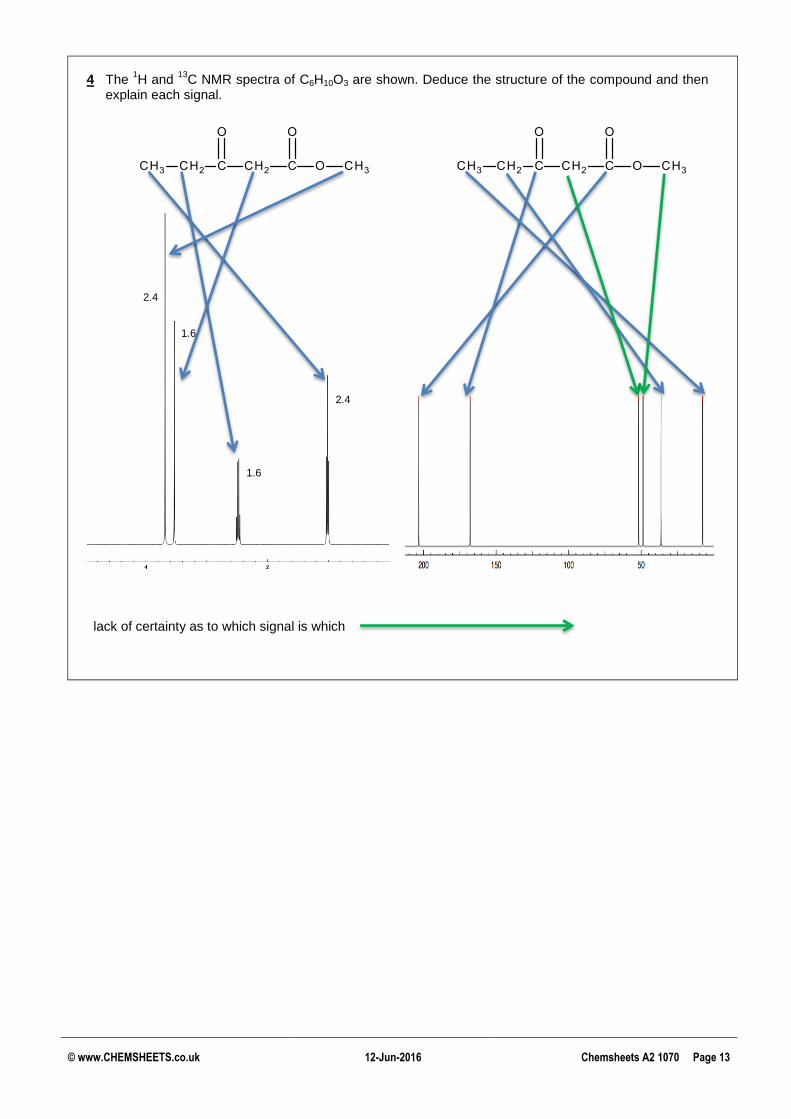
4 The
1H and
13C NMR spectra of C6H10O3 are shown. Deduce the structure of the compound and then
explain each signal.
lack of certainty as to which signal is which
2.4
1.6
1.6
2.4